Interest rates have covered an incredible amount of territory over the past 60 years. The yield of the 10-year U.S. Treasury Note has offered investors yields ranging from 15.32% to 0.68%.
As investors, we consider the income component to be an important part of a typical portfolio asset allocation. The certainty of the annual income and return of the invested funds provide a sense of safety and security. Investments in bonds also provide protection in contrast to more volatile investments like equities, which provide growth in assets, but with more uncertain returns.
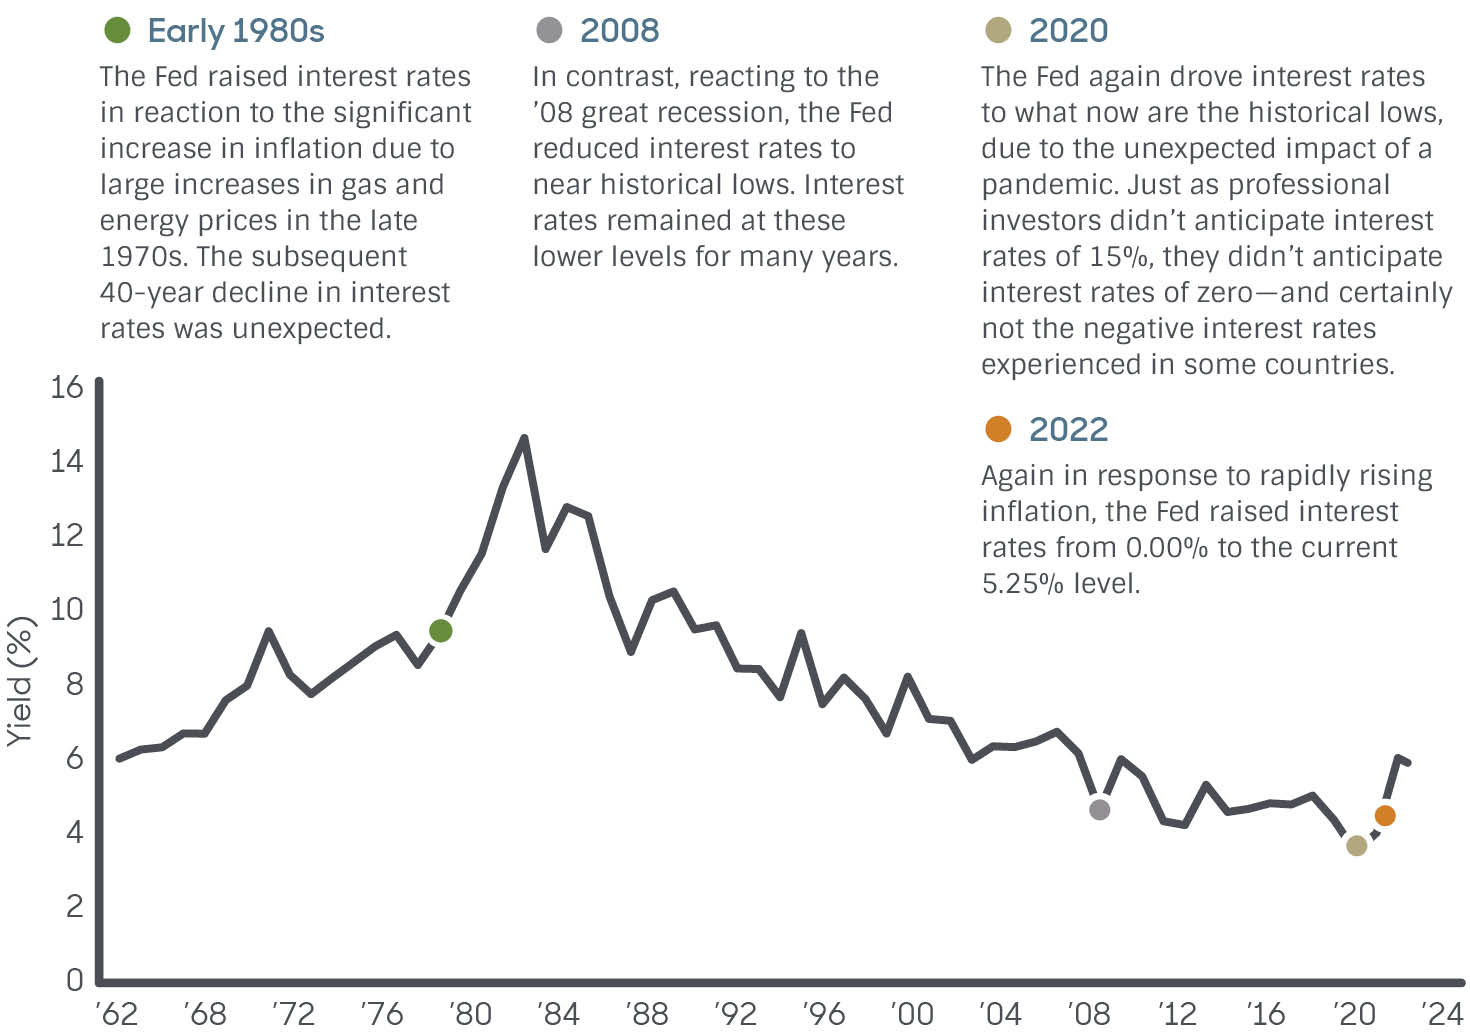
The chart below illustrates the significant range of annual income an investor could receive from investments in a 10-year U.S. Treasury Note.
Consider investing $100,000 at the yield rate of 3.72% in June 2023. This investment would provide $3,720 of income for 10 years, totaling $37,200, as well as the return your investment of $100,000. On the other hand, the same $100,000 investment invested at the mid-2020 lowpoint of 0.68% would provide just $680 of income for 10 years, totaling $6,800 and the return of your $100,000 investment. That’s quite a difference in total income following just two years of rate increases.
What causes such extreme differences in interest rates? There are many economic and monetary factors that influence interest rates, but most powerful is the Federal Reserve Board (Fed). As the central banking authority of the U.S., the Fed controls the monetary system through a network of 12 Reserve Banks. The significant rise or fall in interest rates over the past 60 years was primarily driven by the Fed’s actions in response to potential financial crises.
What is fixed income?
Fixed income refers to low-risk investments that offer a predetermined (or “fixed”) return rate for a set period. For a 10-year Treasury Note, the investor would receive a set return amount each year for a 10-year span. In addition to this annual income, the investor receives their original investment at the end of the term.
The opinions and analyses expressed in this newsletter are based on RMB Capital Management, LLC’s (“RMB Capital”) research and professional experience are expressed as of the date of our mailing of this newsletter. Certain information expressed represents an assessment at a specific point in time and is not intended to be a forecast or guarantee of future results, nor is it intended to speak to any future time periods. RMB Capital makes no warranty or representation, express or implied, nor does RMB Capital accept any liability, with respect to the information and data set forth herein, and RMB Capital specifically disclaims any duty to update any of the information and data contained in this newsletter. The information and data in this newsletter does not constitute legal, tax, accounting, investment or other professional advice. Returns are presented net of fees. An investment cannot be made directly in an index. The index data assumes reinvestment of all income and does not bear fees, taxes, or transaction costs. The investment strategy and types of securities held by the comparison index may be substantially different from the investment strategy and types of securities held by your account. RMB Asset Management is a division of RMB Capital Management.
Certified Financial Planner Board of Standards, Inc. owns the certification marks CFP®, CERTIFIED FINANCIAL PLANNER™ and federally registered CFP (with flame design) in the U.S., which it awards to individuals who successfully complete CFP Board's initial and ongoing certification requirements.
The CFA® and Chartered Financial Analyst® are registered trademarks owned by CFA Institute.