


Key Takeaways
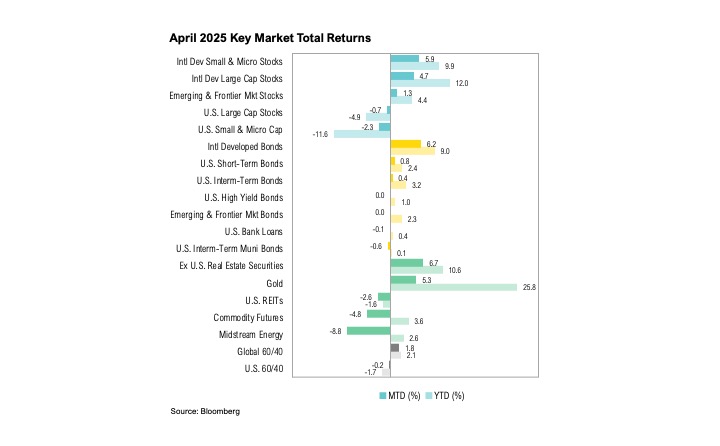
- Despite notable intramonth swings in both directions, U.S. large-cap stocks ended April down 0.7% while U.S. small-cap stocks declined by 2.3%. U.S. intermediate-term bonds gained 0.4%.
- Investor sentiment weakened. Nearly half of Bank of America survey respondents now expect a recession this year, and bearish sentiment in the AAII survey stayed above 50% for a record-breaking 10 straight weeks.
- Despite weakening consumer sentiment, spending held up—likely due to consumers front-loading purchases ahead of anticipated tariff-driven price hikes, highlighting the gap between soft and hard data.
- Earnings call transcripts indicate that many companies and their customers are taking a “wait-and-see” approach to tariffs, delaying further investment and business decisions until trade policy becomes clearer.
Overview
Markets fluctuated throughout April in response to tariff announcements. Despite notable intramonth swings in both directions, U.S. large-cap stocks, as represented by the S&P 500, ended the month down just 0.7%. The Russell 2000 Index, which tracks U.S. small-cap stocks, declined 2.3%. U.S. intermediate-term bonds, as measured by the Bloomberg U.S. Aggregate Bond Index, gained 0.4% in April.
Headline inflation eased to 2.4% year-over-year in March while core inflation dropped below 3.0% (to 2.8%) for the first time since April 2021.1 Lower energy costs were a key contributor to easing price pressures while shelter inflation rose by 0.2% month-over-month, rising by the slowest pace since August 2021. Despite easing prices, consumers’ inflation expectations skyrocketed in April, rising to 6.5%.2
Preliminary estimates for first-quarter GDP showed the U.S. economy contracting at an annualized rate of 0.3% quarter-over-quarter.3 This slowdown was largely attributed to a sharp rise in imports ahead of anticipated tariffs, with imports soaring 41.3% in the first quarter. Consumer spending rose 1.8%, while government spending declined by 1.4%.
First-quarter earnings season kicked off in April, with over 70% of S&P 500 companies having reported results. As of the end of the month, the blended year-over-year earnings growth rate for the S&P 500 stood at 12.8%, a notable improvement from the 7.2% estimate at the end of March.4 However, full-year 2025 earnings growth estimates declined over the month, from 11.2% to 7.3%.

Wait and See
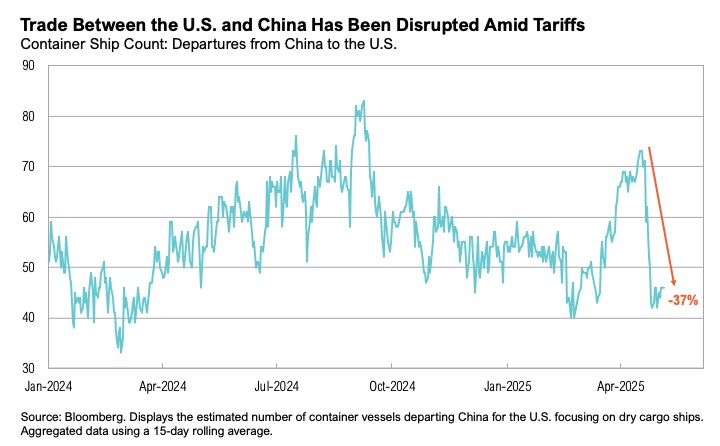
On April 2, President Trump announced sweeping tariffs: a 10% baseline on nearly all imports and higher rates targeting 60 specific countries.5 He dubbed it “Liberation Day,” framing the move as a response to trade imbalances and a push to bolster domestic manufacturing. This brought the average U.S. tariff rate to 22.5%—the highest level in over a century. Markets reacted swiftly and sharply—longer-term Treasury yields spiked while U.S. and international equity markets tumbled. Just over a week later, on April 9, Trump announced a 90-day pause on reciprocal tariffs with China as the sole exception.6 By the end of April, amid escalating tit-for-tat measures, the average trade-weighted U.S. tariff rate on Chinese exports had climbed to 124% while China’s average trade-weighted tariff rate on U.S. exports rose to 147%.7 The result was a sharp disruption in trade: the number of container ships departing from China to the U.S. dropped by 37% between April 18 and April 30.8 On May 12, the U.S. and China agreed to suspend most tariffs on each other’s goods for 90 days, pending further negotiations. As part of the deal, the U.S. will reduce its 125% “reciprocal” tariff on Chinese goods to 10%, while China will likewise lower its retaliatory tariff on U.S. goods from 125% to 10%. However, the separate U.S. tariff of 20% on Chinese goods related to the fentanyl issue will remain in place, bringing the total U.S. tariffs on Chinese goods to 30%.
Throughout April, markets moved sharply in response to tariff developments. U.S. large-cap stocks fell 12% between April 2 and April 8. Then, on April 9, following the announcement of a 90-day tariff pause, they rebounded 10%, marking the third-largest one-day gain since World War II. Treasury markets experienced similarly dramatic shifts. Between April 4 and April 11, the 10-year Treasury yield rose 0.5% to 4.5%, its largest weekly increase since 2001. Over the same period, the 30-year yield climbed 0.5% to 4.9%, the biggest five-day gain since April 1987.
Bond market volatility appears to have played a key role in the decision to pause tariff escalation. On April 10, Kevin Hassett, director of the U.S. National Economic Council, noted that:
“There’s no doubt that the Treasury market made it so that the decision about the time to move [on the tariff pause] was made with, I think perhaps, a little more urgency.”9
Investor sentiment remained bearish throughout the month. For a record tenth consecutive week, more than 50% of respondents to the American Association of Individual Investors (AAII) survey reported bearish views. Yet, actual positioning suggested investors were also taking more of a wait-and-see approach, as actual equity exposures did not drop nearly as much as the “soft” survey data would suggest. The National Association of Active Investment Managers (NAAIM) Exposure Index ended April at 60%, well above its four-week average of 48%, and the AAII Asset Allocation Survey showed average investor portfolios holding 65% in U.S. stocks.10,11
Meanwhile, concerns about a global recession intensified. According to the April Bank of America Fund Manager Survey, 80% of respondents cited a trade-war-triggered global recession as the top “tail risk” (a rare but potentially severe event).12 42% of survey respondents now expect a recession—the most since June 2023 and the fourth-highest reading over the past 20 years.12 Meanwhile, betting markets show the probability of a recession this year hovering just above 50%.13,14
The disconnect between soft data (surveys) and hard data (actual indicators) intensified over the month. While consumer sentiment deteriorated in April, retail sales and personal spending remained strong. The University of Michigan’s consumer sentiment index fell to 52.2, the lowest reading since June 2022, while the Conference Board’s consumer confidence index dropped to 86, the weakest since August 2020.15 Its expectations index fell to 54.4, a 13-year low. In contrast, hard economic data reflected a resilient consumer. March retail sales rose 1.4% month-over-month—the largest increase in more than two years—and personal spending rose 0.7%. However, some of this spending likely reflected consumers front-loading purchases ahead of expected tariff-related price increases. Should tariff uncertainty continue to impact supply chains and pricing—or should tariffs be expeditiously rolled back—a convergence between soft and hard data is likely.
Tariff-related uncertainty dominated corporate earnings calls throughout April. According to Barron’s, mentions of “tariffs” rose 132% over the past 90 days compared to the previous quarter, surpassing levels seen during the 2018 trade tensions.16 Additionally, recent corporate earnings reports expose the challenge in navigating this landscape. Many companies adopted a “wait-and-see” approach to tariffs, delaying further investment and/or significant business decisions until trade policy becomes clearer. Some examples are below.
According to Citigroup CEO Jane Fraser:
“While our corporate and consumer clients are resilient and in good financial health, the world is in a wait-and-see mode and is facing a more negative macroeconomic outlook than anyone had anticipated at the beginning of the year.”17
Goldman Sachs also noted growing uncertainty and concern about the impact of the trade wars:
“Our clients, including corporate CEOs and institutional investors, are concerned by the significant near-term and longer-term uncertainty that has constrained their ability to make important decisions.”18
M&T Bank CFO, Daryl Bible, noted that customers are “on hold” until further clarity emerges regarding tariffs:
“Business-wise, our customers really wanted to make a lot of investments. They want to do acquisitions. They are just really on pause right now. I think it's just a lack of confidence. They don't know what the rules of the road are right now.”19
Similarly, Regions Financial CFO David Jackson Turner said in the company’s earnings call that:
“Customers are delaying investment decisions pending further clarity.”20
Going a step further, Delta Air Lines, American Airlines, Ford, General Motors, United Airlines, UPS, and Thermo Fisher were among the list of companies that suspended earnings guidance altogether given the uncertain macro backdrop.21
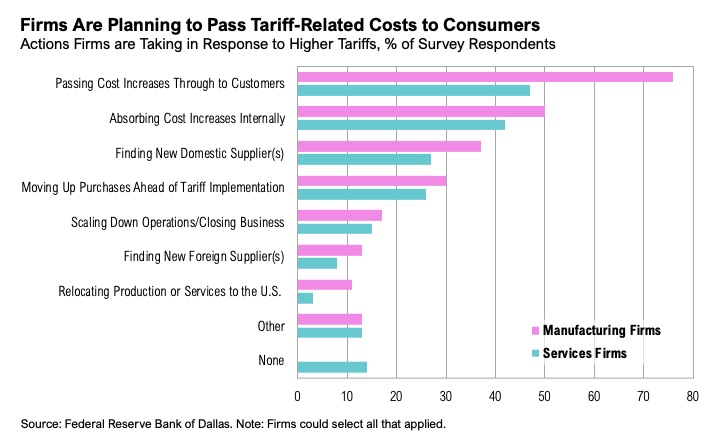
Regardless of how things play out, businesses will face a period of intense disruption. On April 28, the Federal Reserve Bank of Dallas released a survey detailing how companies are responding to higher tariffs. The most common response was passing cost increases on to customers, with nearly 80% of manufacturing firms and 50% of services firms opting to do so.22
Markets
Despite wild fluctuations throughout the month, U.S. large-cap stocks ended April down only 0.7% while U.S. small-cap stocks declined by 2.3%. International markets fared better than their U.S. counterparts for the fourth consecutive month. International developed (ex-U.S.) small cap stocks gained 5.9% while international developed market large cap stocks ended April up 4.7%. A similar pattern occurred in fixed income markets: international developed market bonds gained 6.2% over the month, notably outperforming U.S. intermediate-term bonds, which gained only 0.4%. High-yield credit spreads spiked to 4.3% in mid-April on tariff uncertainty, before easing to end the month back at 3.5%. Despite the volatility, credit spreads remained tight relative to history.
Gold, which gained 5.3% in April and is up nearly 26% year-to-date, reached a new record high of $3,434 on April 21 as tariff uncertainty spurred demand for safe-haven assets. West Texas Intermediate (WTI) crude oil ended April below $60 per barrel, dropping to $58, the lowest level since January 2021.
Looking Forward
The administration is encouraging consumers, businesses, and markets to look beyond the near-term pain posed by tariff consequences, focusing instead on the potential boost in small business spending, domestic manufacturing, and capital investment that may result. As long as markets see sufficient evidence that this approach is working, broader disruptions may remain contained. However, if these efforts falter, the U.S. economic adjustment will likely be more painful, and markets may need more time to adjust, creating additional volatility. Chair Powell spoke for everyone in the May 7 FOMC press conference, when he said: “Everyone is just waiting to see how developments play out… and I can’t really give you a timeframe on that.”23
There is an unusually high amount of uncertainty in the market spurred by the tariff announcement in early April and the subsequent escalation and de-escalation of the “trade war” over the last 30 days. We expect the increased volatility in markets to continue in the coming weeks and months and remain cautious with risk assets as the current cycle plays out. To guide our views, we will be watching the outcomes of various trade negotiations and how companies respond to the new trade dynamics with business decisions. The Federal Reserve will continue to play a key role and their response to both economic conditions and stress on financial markets is another area to watch.
The range of outcomes is very wide during this period of uncertainty. No one can predict the future and this is not a time to be making big bets or trying to time the market. While there may be further downside in the markets from here, we would look to maintain targeted risk asset exposure moving forward. Liquidity is extremely valuable in this environment. Although equity valuations generally remain at above average levels, we would view lower asset prices as a potential opportunity to put additional capital to work. We remain biased towards high-quality companies with strong management teams that will be able to navigate the current environment within our core stock portfolios. We have been well-positioned within core bond portfolios with a low weight toward shorter-duration corporate bonds and a higher weight toward longer-duration treasury bonds. We continue to tactically rebalance within asset classes and make changes within individual portfolios. These portfolio level changes are likely to have more clarity than macro views in this environment. As always, we believe clients are best served reminding themselves of the timeless principles of patience and diversification. The key to successful investing is often remaining committed to long-term investment plans.
Citations
- FRED: https://fred.stlouisfed.org/series/CPILFESL#
- Trading Economics: https://tradingeconomics.com/united-states/michigan-inflation-expectations
- BEA: https://www.bea.gov/sites/default/files/2025-04/gdp1q25-adv.pdf
- FactSet: https://advantage.factset.com/hubfs/Website/Resources%20Section/Research%20Desk/Earnings%20Insight/EarningsInsight_050225A.pdf
- NPR: https://www.npr.org/2025/04/02/nx-s1-5345802/trump-tariffs-liberation-day
- CNN: https://edition.cnn.com/2025/04/09/business/reciprocal-tariff-pause-trump
- Reuters: https://www.reuters.com/world/trump-says-we-know-china-tariffs-will-come-down-145-percent-2025-05-08/
- CNBC: https://www.cnbc.com/2025/04/22/busiest-us-ports-see-big-drop-in-chinese-freight-vessel-traffic.html
- NBC: https://www.cnbc.com/2025/04/10/china-trump-tariffs-live-updates.html
- AAII: https://www.aaii.com/sentimentsurvey
- NAAIM: https://naaim.org/programs/naaim-exposure-index/
- TrustNet: https://www.trustnet.com/News/13445706/aprils-bofa-fund-manager-survey-the-fifth-most-bearish-in-25-years/fund/fund/sectors
- Kalshi: https://kalshi.com/markets/kxrecssnber/recession
- Polymarket: https://polymarket.com/event/us-recession-in-2025
- Trading Economics: https://tradingeconomics.com/united-states/consumer-confidence
- Barron’s: https://www.barrons.com/articles/tariffs-earnings-calls-stock-ccab0e3b
- Citigroup: https://www.citigroup.com/rcs/citigpa/storage/public/Earnings/Q12025/transcript.pdf
- Investing.com: https://www.investing.com/news/transcripts/earnings-call-transcript-goldman-sachs-beats-q1-2025-forecasts-stock-rises-93CH-3983899
- Seeking Alpha: https://seekingalpha.com/article/4775014-m-and-t-bank-corporation-mtb-q1-2025-earnings-call-transcript
- Seeking Alpha: https://seekingalpha.com/article/4775983-regions-financial-corporation-rf-q1-2025-earnings-call-transcript
- Forbes: https://www.forbes.com/sites/tylerroush/2025/05/08/toyota-says-tariffs-will-cut-profits-by-20-joining-these-companies-warning-of-tariff-impacts/
- Federal Reserve Bank of Dallas: https://www.dallasfed.org/research/surveys/tbos/2025/2504q#tab-tssos
- Federal Reserve: https://www.federalreserve.gov/mediacenter/files/FOMCpresconf20250507.pdf
Index Definitions
The S&P 500 Index is widely regarded as the best single gauge of the United States equity market. It includes 500 leading companies in leading industries of the U.S. economy. The S&P 500 focuses on the large cap segment of the market and covers approximately 75% of U.S. equities.
The Bloomberg Barclays U.S. Aggregate Index represents securities that are SEC-registered, taxable, and dollar denominated. The index covers the U.S. investment grade fixed rate bond market, with index components for government and corporate securities, mortgage pass-through securities, and asset-backed securities. Duration is roughly 5 years.
The Bloomberg U.S. Corporate High Yield Bond Index measures the USD-denominated, high yield, fixed-rate corporate bond market. Securities are classified as high yield if the middle rating of Moody’s, Fitch and S&P is Ba1/BB+/BB+ or below. Bonds from issuers with an emerging markets country of risk, based on the indices’ EM country definition, are excluded.
The Russell 1000® Value Index measures the performance of the large-cap value segment of the U.S. equity universe. It includes those Russell 1000 companies with lower price-to-book ratios and lower expected and historical growth rates.
The Russell 1000® Growth Index measures the performance of the large- cap growth segment of the US equity universe. It includes those Russell 1000 companies with relatively higher price-to-book ratios, higher I/B/E/S forecast medium term (2 year) growth and higher sales per share historical growth (5 years).
The Russell 2000® Index measures the performance of the small-cap segment of the US equity universe. It includes approximately 2000 of the smallest US equity securities in the Russell 3000 Index based on a combination of market capitalization and current index membership. The Russell 2000 Index represents approximately 10% of the total market capitalization of the Russell 3000 Index. Because the Russell 2000 serves as a proxy for lower quality, small cap stocks, it provides an appropriate benchmark for RMB Special Situations.
MSCI EAFE Index*: an equity index which captures large and mid-cap representation across 21 of 23 Developed Markets countries around the world, excluding the U.S. and Canada. With 926 constituents, the index covers approximately 85% of the free float-adjusted market capitalization in each country.
The MSCI Emerging Markets Index* measures equity market performance in the global emerging markets universe. It covers over 2,700 securities in 21 markets that are currently classified as EM countries. The MSCI EM Index universe spans large, mid and small cap securities and can be segmented across all styles and sectors.
The U.S. Dollar Index is used to measure the value of the dollar against a basket of six foreign currencies: the euro, Swiss franc, Japanese yen, Canadian dollar, British pound, and Swedish krona.
The Deutsche Bank EM FX Equally Weighted Spot Index, an equal-weighted basket of 21 emerging market currencies.
MSCI U.S. REIT Index is a free float-adjusted market capitalization weighted index that is comprised of equity Real Estate Investment Trusts (REITs). The index is based on the MSCI USA Investable Market Index (IMI), its parent index, which captures the large, mid and small cap segments of the USA market. With 150 constituents, it represents about 99% of the US REIT universe and securities are classified under the Equity REITs Industry (under the Real Estate Sector) according to the Global Industry Classification Standard (GICS®), have core real estate exposure (i.e., only selected Specialized REITs are eligible) and carry REIT tax status.
MSCI China NR Index: designed to measure the performance of the large and mid cap segments of the Chilean market. With 12 constituents, the index covers approximately 85% of the Chile equity universe.
MSCI South Africa NR Index: designed to measure the performance of the large and mid cap segments of the South African market. With 37 constituents, the index covers approximately 85% of the free float-adjusted market capitalization in South Africa.
*Source: MSCI.MSCI makes no express or implied warranties or representations and shall have no liability whatsoever with respect to any MSCI data contained herein. The MSCI data may not be further redistributed or used as a basis for other indexes or any securities or financial products. This report is not approved, endorsed, reviewed or produced by MSCI. None of the MSCI data is intended to constitute investment advice or a recommendation to make (or refrain from making) any kind of investment decision and may not be relied on as such.
All market pricing and performance data from Bloomberg, unless otherwise cited. Asset class and sector performance are gross of fees unless otherwise indicated.
The opinions and analyses expressed in this newsletter are based on Curi RMB Capital, LLC’s (“Curi RMB Capital”) research and professional experience are expressed as of the date of our mailing of this newsletter. Certain information expressed represents an assessment at a specific point in time and is not intended to be a forecast or guarantee of future results, nor is it intended to speak to any future time periods. Curi RMB Capital makes no warranty or representation, express or implied, nor does Curi RMB Capital accept any liability, with respect to the information and data set forth herein, and Curi RMB Capital specifically disclaims any duty to update any of the information and data contained in this newsletter. The information and data in this newsletter does not constitute legal, tax, accounting, investment or other professional advice. Returns are presented net of fees. An investment cannot be made directly in an index. The index data assumes reinvestment of all income and does not bear fees, taxes, or transaction costs. The investment strategy and types of securities held by the comparison index may be substantially different from the investment strategy and types of securities held by your account. RMB Asset Management is a division of Curi RMB Capital.