


Key Takeaways
- U.S. markets faced a challenging first quarter. U.S. large-cap stocks ended the quarter down 4%, while U.S. small-cap stocks declined by nearly 10%.
- The government is pursuing aggressive trade and fiscal policies, using tariffs and reducing wasteful spending to restructure federal debt—partly to support extending tax cuts.
- March saw a sharp drop in both investor and consumer sentiment, with tariff-related concerns cited as the key reason for growing uncertainty.
- The Trump administration is making a high-stakes economic gambit—betting that short-term pain from tariffs and tighter fiscal policies will yield long-term gains in deficit reduction, domestic manufacturing, and rebalanced global trade.
Overview
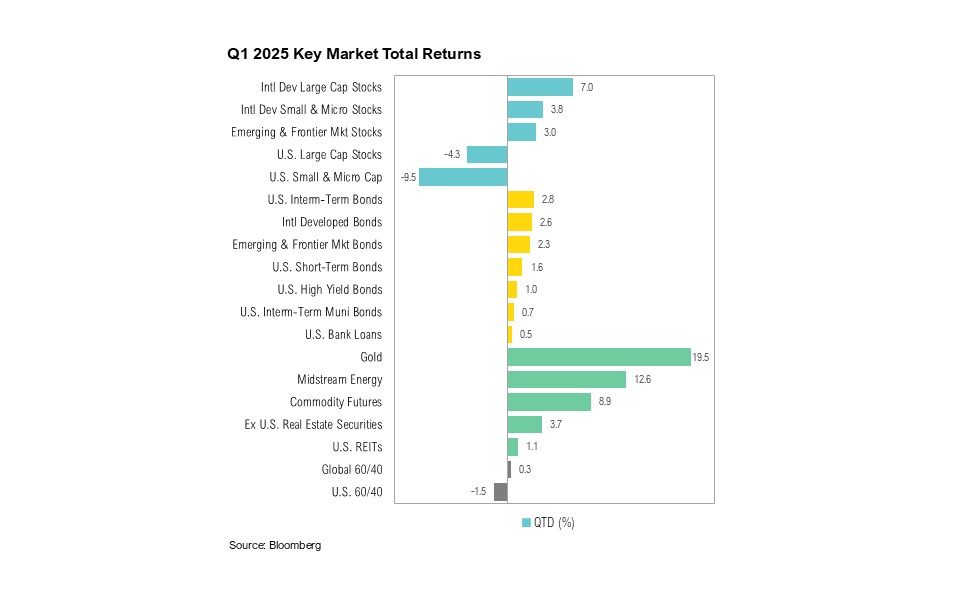
U.S. equity markets faced a challenging first quarter. U.S. large-cap stocks, as represented by the S&P 500, ended the first three months of 2025 down 4.3%, while the small-cap Russell 2000 Index declined 9.5%. This marked the worst quarter for both U.S. large- and small-cap stocks since the second quarter of 2022. In contrast, U.S. fixed income markets fared better, with the Bloomberg U.S. Aggregate Bond Index gaining 2.8% in the first three months of the new year.
Final fourth-quarter gross domestic product (GDP) results, released at the end of March, confirmed that the U.S. economy continued its steady pace of growth throughout 2024. GDP growth for the quarter was revised marginally upward, from 2.3% to an annualized 2.4%.1 Government spending increased at an annualized rate of 3.1% while consumer spending grew by 4.0%—the strongest pace of 2024.
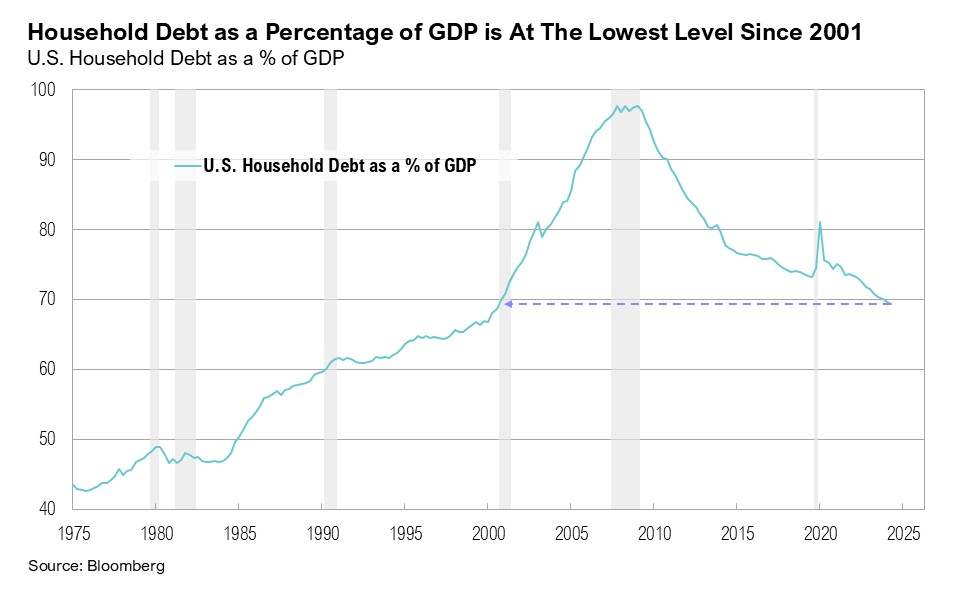
Personal income has grown steadily in 2025, rising 0.9% month-over-month in January, followed by another strong increase of 0.8% in February. Although personal savings remain below pre-pandemic levels, they have started to recover, reaching 4.6% in February as income growth outpaced spending.2 Meanwhile, U.S. household debt-to-GDP levels have declined to 70%, the lowest since 2001.
Inflation remains sticky, but there are promising signs. Headline inflation rose to 3.0% year-over-year in January before easing to 2.8% in February, aided by declines in food and energy prices. Notably, core inflation in February rose at the slowest pace since April 2021, increasing by 3.1% year-over-year.3 As expected, the Federal Reserve kept interest rates unchanged at its March Federal Open Market Committee (FOMC) meeting. Despite inflation above 2%, Fed officials still anticipate the equivalent of two 0.25% rate reductions for 2025, while market expectations for rate cuts increased from two 0.25% cuts to three, with the first cut expected in June.4 The Fed also announced plans to slow the pace of quantitative tightening, reducing its monthly runoff from $60 billion to $40 billion, with a maximum Treasury runoff of $5 billion per month starting in April.5 Fed Chair Jerome Powell attributed this decision to the debt ceiling, which was reached in January.
The 2024 earnings season concluded in March, and S&P 500 earnings grew by a solid 11% for the year. Growth was led by the communication services (+23%), technology (+19%), and financial (+19%) sectors.6 Looking ahead, earnings growth estimates for the first quarter have declined from 12% at the start of the year to 7% by the end of March. At the sector level, healthcare (+36%), technology (+15%), and utilities (+10%) are expected to drive earnings growth in the first quarter.6
Gambit
In chess, a gambit is a strategy where a player deliberately sacrifices a piece in the opening to gain a positional or tactical advantage. The goal is usually to achieve faster development, gain better control of the board, or put the opponent in a difficult situation. As the economy adjusts to reduced government spending and the impact of tariffs, President Donald Trump and Treasury Secretary Scott Bessent are willing to accept short-term economic pain to pursue potential long-term gains.
The Mar-a-Lago Accord is a conceptual economic strategy proposed by the Trump administration that aims to restructure the global financial system to reduce U.S. debt and address economic imbalances.7 Key elements of the proposal include boosting American manufacturing and restructuring U.S. debt by leveraging tariffs and geopolitical influence, including pressuring trade partners to absorb financial burdens and adjust currency values.8 Though not an official policy, the Mar-a-Lago Accord envisions reshaping global trade and finance by tying economic measures to national security while sparking debate over its feasibility and risks.
The Trump administration’s high-stakes economic gambit seeks to reduce government spending and increase revenue to extend the expiring Tax Cuts and Jobs Act beyond its scheduled expiration at the end of 2025. The administration has also proposed eliminating income taxes on Social Security benefits, overtime, and tips, which would reduce government revenue by over $1.5 trillion over the next ten years.9,10
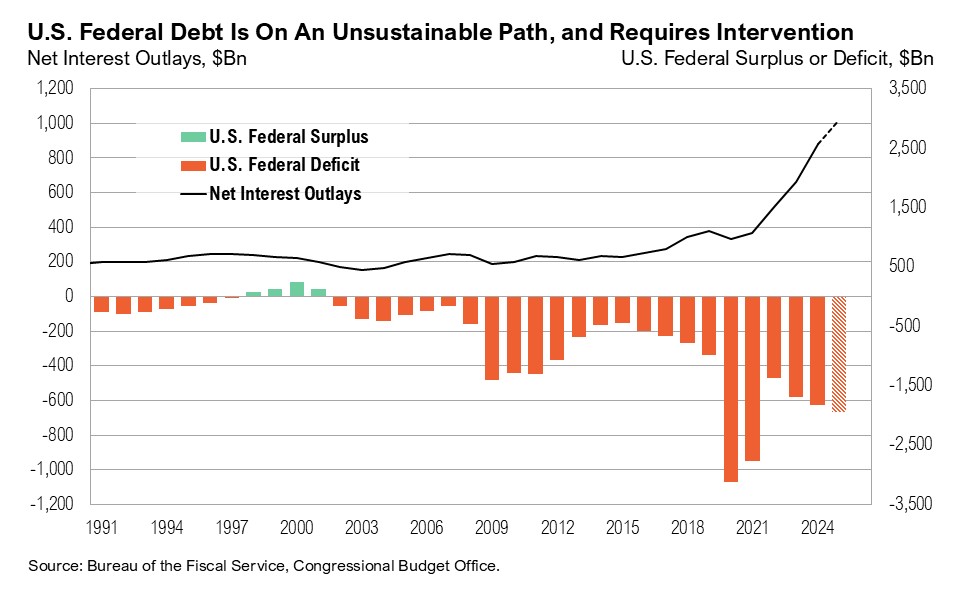
The government has made it clear that reducing the fiscal deficit is a primary objective. The Department of Government Efficiency (or DOGE)—established to enhance government accountability and efficiency through strategic oversight and reform—claims to have already saved the government approximately $140 billion.11 While this remains a small fraction of the $1.2 trillion fiscal deficit accumulated so far this fiscal year, the initiative, spearheaded by Elon Musk, appears to have widespread support, at least for now.12,13,14 Treasury Secretary Scott Bessent has publicly endorsed Musk’s efforts, stating, “I am completely aligned with what Elon’s doing.”15 Public sentiment also favors cutting wasteful government spending. A recent Harvard CAPS-Harris poll of over 2,400 registered U.S. voters found overwhelming support for the government’s policies on eliminating fraud and waste in government spending, as well as reducing previously allocated expenditures.13 The survey revealed that 77% of Americans believe a full review of government spending is necessary, while 83%—including 72% of Democrats and 94% of Republicans—agree that spending should be cut.13 According to Musk, DOGE aims to achieve its goal of cutting wasteful government spending by $1 trillion by the end of May 2025.16
One of the Trump administration’s opening moves has been implementing aggressive targeted tariffs on various countries and global trade sectors, citing national security and economic interests. On April 2, baseline tariffs of 10% were announced on all imports to the U.S., and higher rates were implemented for major trading partners.17,18 U.S. trade partners with the highest reciprocal tariffs include China (54%), the European Union (20%), Vietnam (46%), South Africa (30%), and Japan (24%).17,18 Unlike China, Canada and Mexico avoided additional tariffs. The Trump administration also confirmed a 25% tariff on all foreign-made automobiles.
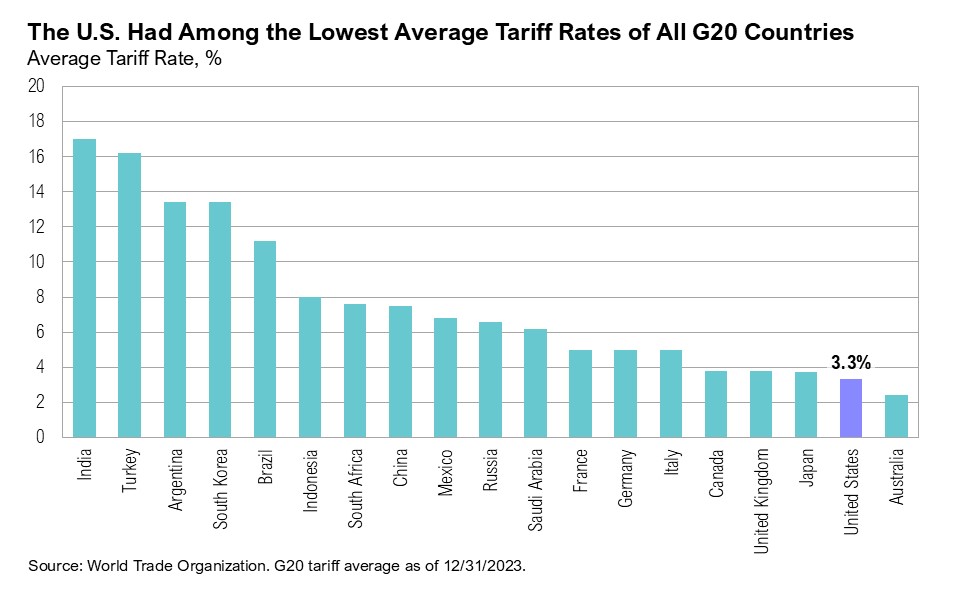
The Trump administration appears to be leveraging tariffs for two primary purposes: as a negotiating tool and as a macroeconomic strategy. When used as a macroeconomic tool, these tariffs are designed to protect domestic U.S. industries and encourage reshoring. Unlike most countries, the U.S. has historically maintained relatively low trade barriers, with an average tariff rate of roughly 3%. A third reason for aggressive tariffs on Canada and Mexico was to curb drug trafficking and stop the flow of drugs crossing into the U.S. via neighboring borders. Recent data from the U.S. Customs and Border Protection shows drug seizures in February dropping to the lowest level in at least three years.20
Several countries have already proposed tariff cuts on U.S. imports in efforts to avoid reciprocal tariffs. For example, India has offered to cut tariffs on over half of U.S. imports, including farm products such as almonds, worth $23 billion.21 Similarly, the European Union is engaged in talks to identify potential concessions in exchange for the partial removal of U.S. tariffs.22 To avoid or mitigate tariffs, global corporations have pledged nearly $1 trillion in U.S. investment since Trump’s inauguration.23 Apple, for example, has committed $500 billion over the next four years, while Taiwan Semiconductor plans to invest $100 billion to advance semiconductor manufacturing in the U.S., and South Korea’s Hyundai investing $21 billion over the next three years to improve the U.S. supply chain and build a new steel plant in Louisiana.23,24
But all gambits come at an immediate cost. Investor sentiment declined sharply in March. The American Association of Individual Investors (AAII) sentiment survey showed bearish sentiment rising to a one-year high of 61% in the last week of February, and sentiment remained negative throughout March. An average of 58% of survey respondents expressed a bearish outlook for U.S. equities over the next six months.25 Similarly, the Bank of America’s Global Fund Manager Survey in March recorded the largest pullback in investor sentiment in five years. In just three months, the percentage of fund managers overweight in U.S. equities fell from a record high to one of the lowest levels in over twenty years.26 While the National Federation of Independent Businesses (NFIB) Small Business Optimism Index remained above average in February, the Small Business Uncertainty Index rose to its second-highest level on record since 1975.27
Consumer confidence followed a similar downward trajectory. The Conference Board’s Consumer Confidence Index in March fell to its lowest level since the pandemic, and the University of Michigan’s survey recorded its lowest sentiment reading since November 2022.28,29 The University of Michigan survey also found that expectations for personal finances hit the lowest level since 1978, and an unprecedented 51% of respondents made unsolicited negative comments about government economic policy.29,30 Across both investor and consumer surveys, tariffs were cited as the primary driver of growing uncertainty.
The Federal Reserve’s latest economic projections, released at the March Federal Open Market Committee meeting, suggest that they believe tariffs are unlikely to have a lasting impact on inflation. While year-over-year inflation expectations for 2025 have risen from 2.5% to 2.8%, the Fed forecasts inflation to decline to 2.2% in 2026 and 2.0% the following year, indicating that any potential tariff-related price pressures may be temporary.31 The Fed’s 2025 outlook expects a slight slowdown in economic growth (from 2.1% to 1.7% year-over-year), and unemployment is projected to remain near historic lows at 4.4%.31
Markets
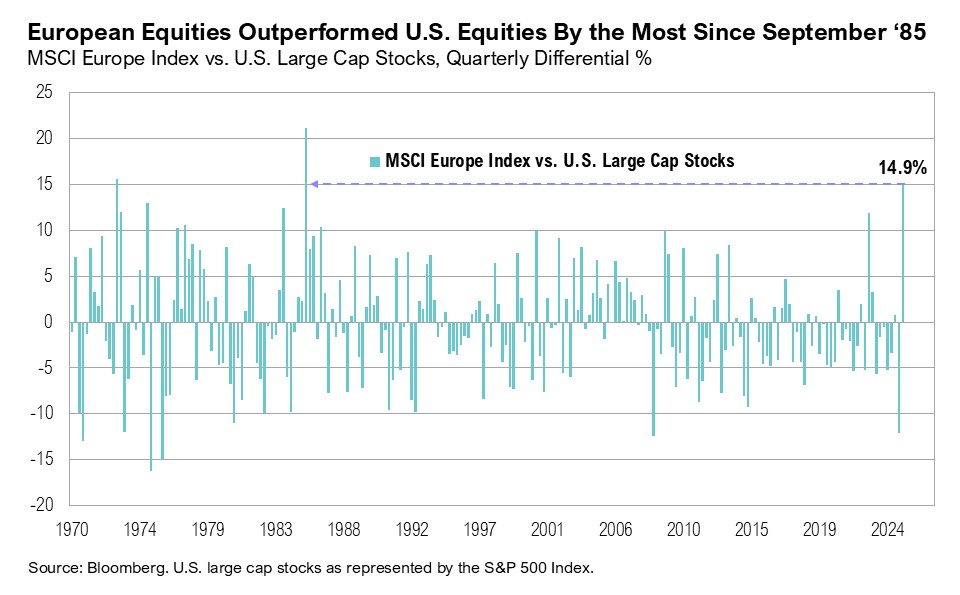
U.S. equity markets reached a stalemate in March. Large-cap stocks fell over 4% for the month, capping off their worst quarter since early 2022 and underperforming global equities by the widest margin since 2009. In fact, European equities had their strongest quarter relative to the S&P 500 since September 1985, outperforming U.S. large-cap stocks by 15% when the Plaza Accord was signed with the goal of weakening the dollar to reduce the U.S. trade deficit.32 U.S. small-cap stocks ended the quarter down nearly 10%, their worst quarterly performance since the second quarter of 2022 when the Russell 2000 declined by 18%.
The Magnificent Seven—Apple, Microsoft, Amazon, Alphabet, Nvidia, Meta, and Tesla—have been a driving force behind the S&P 500’s rally in recent years, fueled by strong fundamentals, market leadership, and exposure to transformative trends like artificial intelligence. However, together, the group ended the first quarter down 16%, driven by Tesla (-36%), Nvidia (-19%), and Alphabet (-18%). Tesla was the second-worst performing company in the S&P 500, surpassed only by Deckers Outdoor, which ended the quarter down 45%. The downturn in stock prices led to a pullback in valuations, bringing the Magnificent Seven’s valuation premium relative to the rest of the S&P 500 to its lowest level since 2017.33
International equity markets outperformed U.S. equities in the first quarter of 2025. Large-cap stocks in developed international markets outpaced their U.S. counterparts by more than 10%, with the MSCI EAFE Index gaining 7%. In Europe, investor optimism—fueled by an $860 billion defense spending package—helped push the MSCI Europe up 11% during the quarter. Of note, German stocks, proxied by the MSCI Germany Index, rallied 16%. Similarly, international developed-market small-cap stocks rose 4% over the quarter, whereas U.S. small-cap stocks fell 10%, making them the worst-performing major asset class year-to-date.
After reaching a two-year high on January 13, the U.S. dollar weakened, ending the quarter down 4%. This sharp reversal in performance brought relative valuations between U.S. and non-U.S. stocks back in line with their five-year average, although they remain above longer-term averages.34
Fixed-income markets had a strong start to the year, with U.S. intermediate-term bonds gaining 3% over the quarter. After rising to 4.8% in mid-January (the highest level since October 2023), the 10-year U.S. Treasury yield ended March below 4.2% due to rising uncertainty surrounding tariffs. The yield curve (the spread between the 10-year and 2-year Treasury yields) remained positive throughout the quarter, finishing March at 0.3%.
Gold gained 20% over the quarter, closing March at a new all-time high above $3,100. West Texas Intermediate (WTI) crude oil prices declined by $7 per barrel over the quarter to end at $71 per barrel, despite news of slowing U.S. oil production, which in January fell to the lowest level in a year.
Looking Forward
President Trump and Treasury Secretary Bessent appear to be playing the long game, hoping that consumers and markets—particularly bond markets—will look beyond a short-term period of uncertainty in exchange for the long-term benefits stemming from a reduced fiscal deficit, increased domestic manufacturing and reshoring, economic growth, and more balanced global trade practices. In many ways, their approach resembles a gambit in chess—deliberately sacrificing short-term stability in pursuit of long-term gains. The key question remains whether this is a calculated risk that will ultimately pay off or if the so-called chess game will end in checkmate for U.S. economic growth.
We expect the increased volatility in markets to continue in the coming weeks and months and remain cautious with risk assets as the current cycle plays out. While there may be further downside in the markets from here, we would look to maintain targeted risk asset exposure moving forward. We expect the yield curve to continue to normalize and the upside risk to inflation has increased. Although equity valuations generally remain at above average levels, we would view lower asset prices as an opportunity to put additional capital to work. We remain biased towards high-quality companies with strong management teams that will be able to navigate the current environment within our core stock portfolios. We have been well-positioned within core bond portfolios with a low weight toward shorter-duration corporate bonds and a higher weight toward longer-duration treasury bonds. We believe clients are best served reminding themselves of the timeless principles of patience and diversification. The key to successful investing is often remaining committed to long-term investment plans.
Citations
- BEA: https://www.bea.gov/data/gdp/gross-domestic-product
- Federal Reserve of St. Louis: https://fred.stlouisfed.org/series/PSAVERT
- Federal Reserve of St. Louis: https://fred.stlouisfed.org/series/CPILFESL
- CME FedWatch: https://www.cmegroup.com/markets/interest-rates/cme-fedwatch-tool.html
- Federal Reserve: https://www.federalreserve.gov/mediacenter/files/FOMCpresconf20250319.pdf
- FactSet: https://advantage.factset.com/hubfs/Website/Resources%20Section/Research%20Desk/Earnings%20Insight/EarningsInsight_032825.pdf
- Bloomberg: https://www.bloomberg.com/news/articles/2025-02-20/-mar-a-lago-accord-chatter-is-getting-wall-street-s-attention
- Financial Times: https://www.ft.com/content/fba87dd3-514a-41c2-b2b9-ea597ffbdfbf
- Penn Wharton Budget Model: https://budgetmodel.wharton.upenn.edu/issues/2025/2/10/eliminating-income-taxes-on-social-security-benefits
- Forbes: https://www.forbes.com/sites/shaharziv/2025/03/05/trump-speech-to-congress-renews-call-for-no-tax-on-tips/
- Department of Government Efficiency: https://www.doge.gov/savings
- AP-NORC: https://apnorc.org/projects/although-support-for-doge-is-mixed-a-majority-believe-corruption-inefficiency-and-red-tape-are-major-problems/
- Harvard-Harris Poll: https://harvardharrispoll.com/wp-content/uploads/2025/02/HHP_Feb2025_vFinal.pdf
- AP News: https://apnews.com/article/ap-norc-poll-trump-musk-doge-approval-23d49b2dcdadd0d6f625c6b4451b2c8d
- All-In Podcast: https://www.youtube.com/watch?v=lSma9suyp24
- Bloomberg: https://www.bloomberg.com/news/articles/2025-03-27/musk-says-doge-aims-to-finish-1-trillion-in-cuts-by-end-of-may
- BBC: https://www.bbc.com/news/articles/c1jxrnl9xe2o
- Wall Street Journal: https://www.wsj.com/livecoverage/trump-tariffs-trade-war-stock-market-04-02-2025
- Jeff Weniger via X: https://x.com/JeffWeniger/status/1899544455981498719/photo/2
- U.S. Customs and Border Protection: https://www.cbp.gov/newsroom/stats/drug-seizure-statistics
- Reuters: https://www.reuters.com/world/india/india-offers-us-tariff-cuts-farm-imports-eyes-trade-success-government-sources-2025-03-28/
- Bloomberg: https://www.bloomberg.com/news/newsletters/2025-03-28/eu-identifies-concessions-for-trump-in-trade-war
- Bloomberg: https://www.bloomberg.com/news/articles/2025-02-25/apple-openai-among-tech-firms-pledging-over-1-trillion-since-trump-took-office
- CNBC: https://www.cnbc.com/2025/03/24/south-korea-hyundai-us-investment.html
- AAII: https://www.aaii.com/sentimentsurvey/sent_results
- Financial Times: https://www.ft.com/content/d43b2929-74b4-4121-9c58-1eba5be321bc
- NFIB: https://www.nfib.com/wp-content/uploads/2025/03/NFIB-SBET-Report-Feb.-2025.pdf
- Wall Street Journal: https://www.wsj.com/livecoverage/stock-market-today-dow-nasdaq-sp500-03-25-2025/card/consumer-confidence-drops-further-key-measure-flags-recession-risk-JCuJNmUtCUAJgblTrwUm
- Bloomberg: https://www.bloomberg.com/news/articles/2025-03-14/us-consumer-sentiment-drops-price-expectations-soar-on-tariffs
- Michael McDonough via X: https://x.com/M_McDonough/status/1905628662528950301/photo/1
- Federal Reserve: https://www.federalreserve.gov/monetarypolicy/files/fomcprojtabl20250319.pdf
- Investopedia: https://www.investopedia.com/terms/p/plaza-accord.asp
- CNBC: https://www.cnbc.com/2025/03/14/techs-3-week-selloff-wipes-out-2point7-trillion-in-value-from-megacaps.html
- Bloomberg, SpringTide calculations based on forward price-to-earnings for Russell 1000 vs. MSCI ACWI Ex-U.S.
Index Definitions
The S&P 500 Index is widely regarded as the best single gauge of the United States equity market. It includes 500 leading companies in leading industries of the U.S. economy. The S&P 500 focuses on the large cap segment of the market and covers approximately 75% of U.S. equities.
The Bloomberg Barclays U.S. Aggregate Index represents securities that are SEC-registered, taxable, and dollar denominated. The index covers the U.S. investment grade fixed rate bond market, with index components for government and corporate securities, mortgage pass-through securities, and asset-backed securities. Duration is roughly 5 years.
The Bloomberg U.S. Corporate High Yield Bond Index measures the USD-denominated, high yield, fixed-rate corporate bond market. Securities are classified as high yield if the middle rating of Moody’s, Fitch and S&P is Ba1/BB+/BB+ or below. Bonds from issuers with an emerging markets country of risk, based on the indices’ EM country definition, are excluded.
The Russell 1000® Value Index measures the performance of the large-cap value segment of the U.S. equity universe. It includes those Russell 1000 companies with lower price-to-book ratios and lower expected and historical growth rates.
The Russell 1000® Growth Index measures the performance of the large- cap growth segment of the US equity universe. It includes those Russell 1000 companies with relatively higher price-to-book ratios, higher I/B/E/S forecast medium term (2 year) growth and higher sales per share historical growth (5 years).
The Russell 2000® Index measures the performance of the small-cap segment of the US equity universe. It includes approximately 2000 of the smallest US equity securities in the Russell 3000 Index based on a combination of market capitalization and current index membership. The Russell 2000 Index represents approximately 10% of the total market capitalization of the Russell 3000 Index. Because the Russell 2000 serves as a proxy for lower quality, small cap stocks, it provides an appropriate benchmark for RMB Special Situations.
MSCI EAFE Index*: an equity index which captures large and mid-cap representation across 21 of 23 Developed Markets countries around the world, excluding the U.S. and Canada. With 926 constituents, the index covers approximately 85% of the free float-adjusted market capitalization in each country.
The MSCI Emerging Markets Index* measures equity market performance in the global emerging markets universe. It covers over 2,700 securities in 21 markets that are currently classified as EM countries. The MSCI EM Index universe spans large, mid and small cap securities and can be segmented across all styles and sectors.
The U.S. Dollar Index is used to measure the value of the dollar against a basket of six foreign currencies: the euro, Swiss franc, Japanese yen, Canadian dollar, British pound, and Swedish krona.
The Deutsche Bank EM FX Equally Weighted Spot Index, an equal-weighted basket of 21 emerging market currencies.
MSCI U.S. REIT Index is a free float-adjusted market capitalization weighted index that is comprised of equity Real Estate Investment Trusts (REITs). The index is based on the MSCI USA Investable Market Index (IMI), its parent index, which captures the large, mid and small cap segments of the USA market. With 150 constituents, it represents about 99% of the US REIT universe and securities are classified under the Equity REITs Industry (under the Real Estate Sector) according to the Global Industry Classification Standard (GICS®), have core real estate exposure (i.e., only selected Specialized REITs are eligible) and carry REIT tax status.
MSCI China NR Index: designed to measure the performance of the large and mid cap segments of the Chilean market. With 12 constituents, the index covers approximately 85% of the Chile equity universe.
MSCI South Africa NR Index: designed to measure the performance of the large and mid cap segments of the South African market. With 37 constituents, the index covers approximately 85% of the free float-adjusted market capitalization in South Africa.
*Source: MSCI.MSCI makes no express or implied warranties or representations and shall have no liability whatsoever with respect to any MSCI data contained herein. The MSCI data may not be further redistributed or used as a basis for other indexes or any securities or financial products. This report is not approved, endorsed, reviewed or produced by MSCI. None of the MSCI data is intended to constitute investment advice or a recommendation to make (or refrain from making) any kind of investment decision and may not be relied on as such.
Performance Disclosures
All market pricing and performance data from Bloomberg, unless otherwise cited. Asset class and sector performance are gross of fees unless otherwise indicated.
The opinions and analyses expressed in this newsletter are based on Curi RMB Capital, LLC’s (“Curi RMB Capital”) research and professional experience are expressed as of the date of our mailing of this newsletter. Certain information expressed represents an assessment at a specific point in time and is not intended to be a forecast or guarantee of future results, nor is it intended to speak to any future time periods. Curi RMB Capital makes no warranty or representation, express or implied, nor does Curi RMB Capital accept any liability, with respect to the information and data set forth herein, and Curi RMB Capital specifically disclaims any duty to update any of the information and data contained in this newsletter. The information and data in this newsletter does not constitute legal, tax, accounting, investment or other professional advice. Returns are presented net of fees. An investment cannot be made directly in an index. The index data assumes reinvestment of all income and does not bear fees, taxes, or transaction costs. The investment strategy and types of securities held by the comparison index may be substantially different from the investment strategy and types of securities held by your account. RMB Asset Management is a division of Curi RMB Capital.