
Overview
Just as COVID-19 seemingly receded to the point that we could emerge in a new normal, Russian forces invaded Ukraine on February 24. Equities, which were already negative for the year, initially moved even lower while commodities added to their gains, fueled by concerns over supply chain issues and access to critical raw materials. Fears that inflation, already at uncomfortable levels, could surge even higher kept investors from seeking safety in fixed income securities and drove bond yields up significantly.
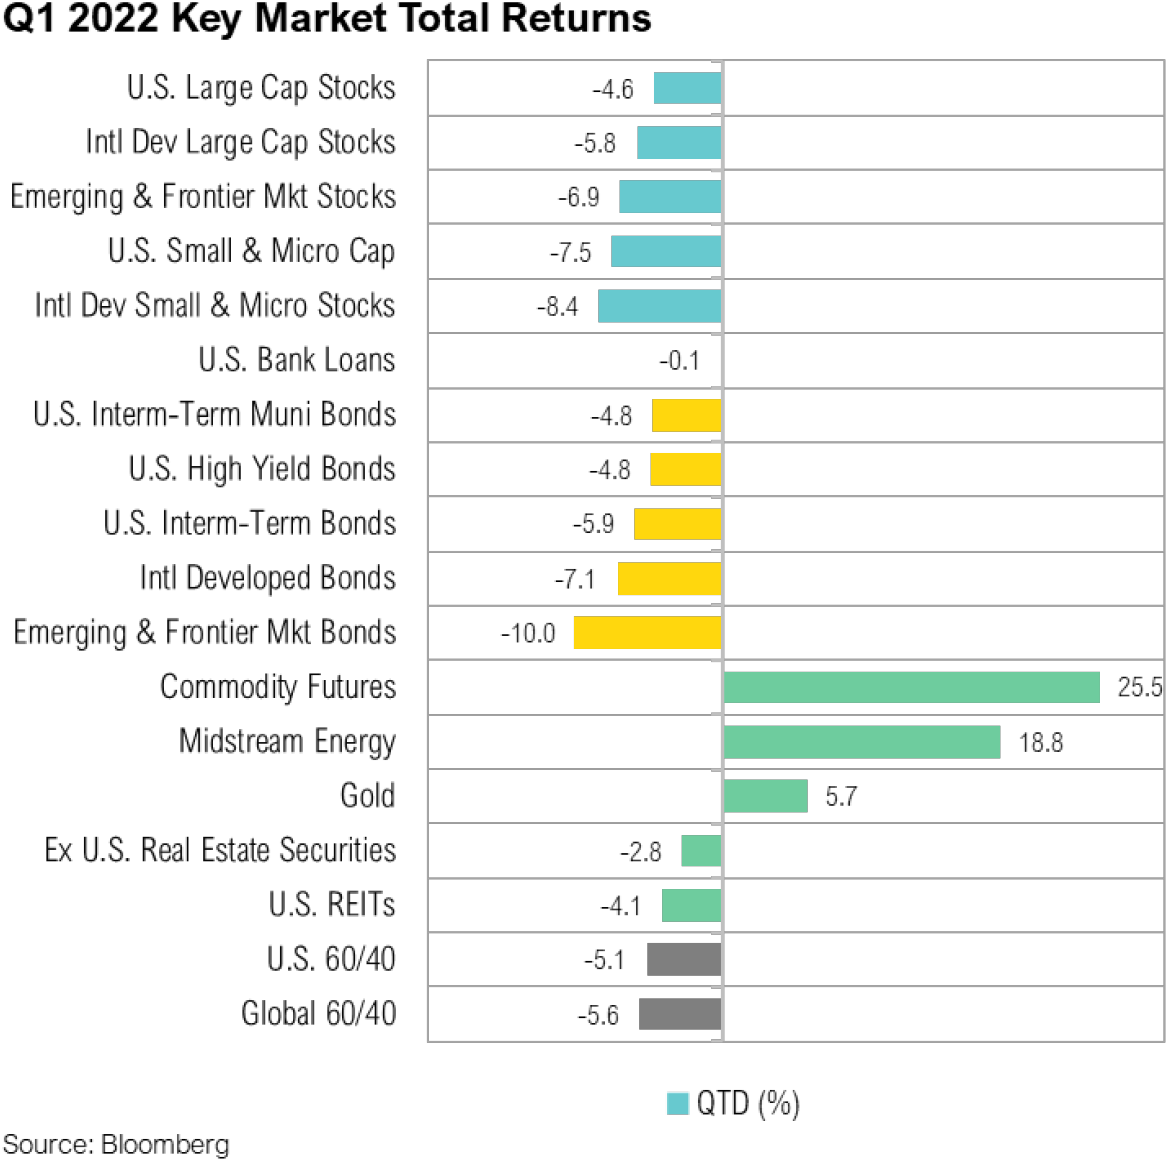
Following the invasion, equities rallied throughout most of March, which mitigated losses for the quarter. The S&P 500 ended the quarter down 4.6% while a global measure of stocks, the MSCI All Country World Index, dropped by 5.4%. Bonds have typically provided investors with a ballast against equity drawdowns, but not this quarter. The Bloomberg U.S. Aggregate Bond Index dropped 5.9%. For the first time since the first quarter of 2018 and just the second occurrence since the global financial crisis, both the S&P 500 and the Bloomberg U.S. Aggregate indexes finished the quarter in negative territory. The U.S. 10-year Treasury yield rose 87 basis points over the quarter from 1.51% to 2.38%, its highest level since May 2019.
Commodities were the big winners in the quarter, returning 25.5% as measured by the Bloomberg Commodity Index. Idiosyncratic supply chain issues, exacerbated by the strategic role both Russia and Ukraine play in global resource markets, drove many individual commodities up substantially – nickel (+55%), natural gas (+51%), WTI crude oil (+33%), wheat (+30%), and corn (+26%) each jumped more than 25%. Food and energy commodities, items that significantly affect the lives and pocketbooks of global consumers, are at the heart of this conflict. Russia provides 17% of the world’s natural gas and 12% of its oil, 1 and Russia and Ukraine generate roughly 34% of global wheat traded. 2 With Russia only committing to exporting to friendly nations and Ukraine trying to execute planting season amidst a war, the price of wheat jumped by 30%. Input costs, such as fertilizer, have also risen dramatically and now sit at levels not seen since 2008 when oil prices were over $150 per barrel. 3 The war has caused other countries to turn inward and limit their exports. In mid-March, for example, Indonesia, the world’s largest producer and exporter of palm oil, more than doubled its maximum levy on palm oil exports so that it could subsidize domestic prices and distribute more than 200 million liters of the commodity across the country each month. 4
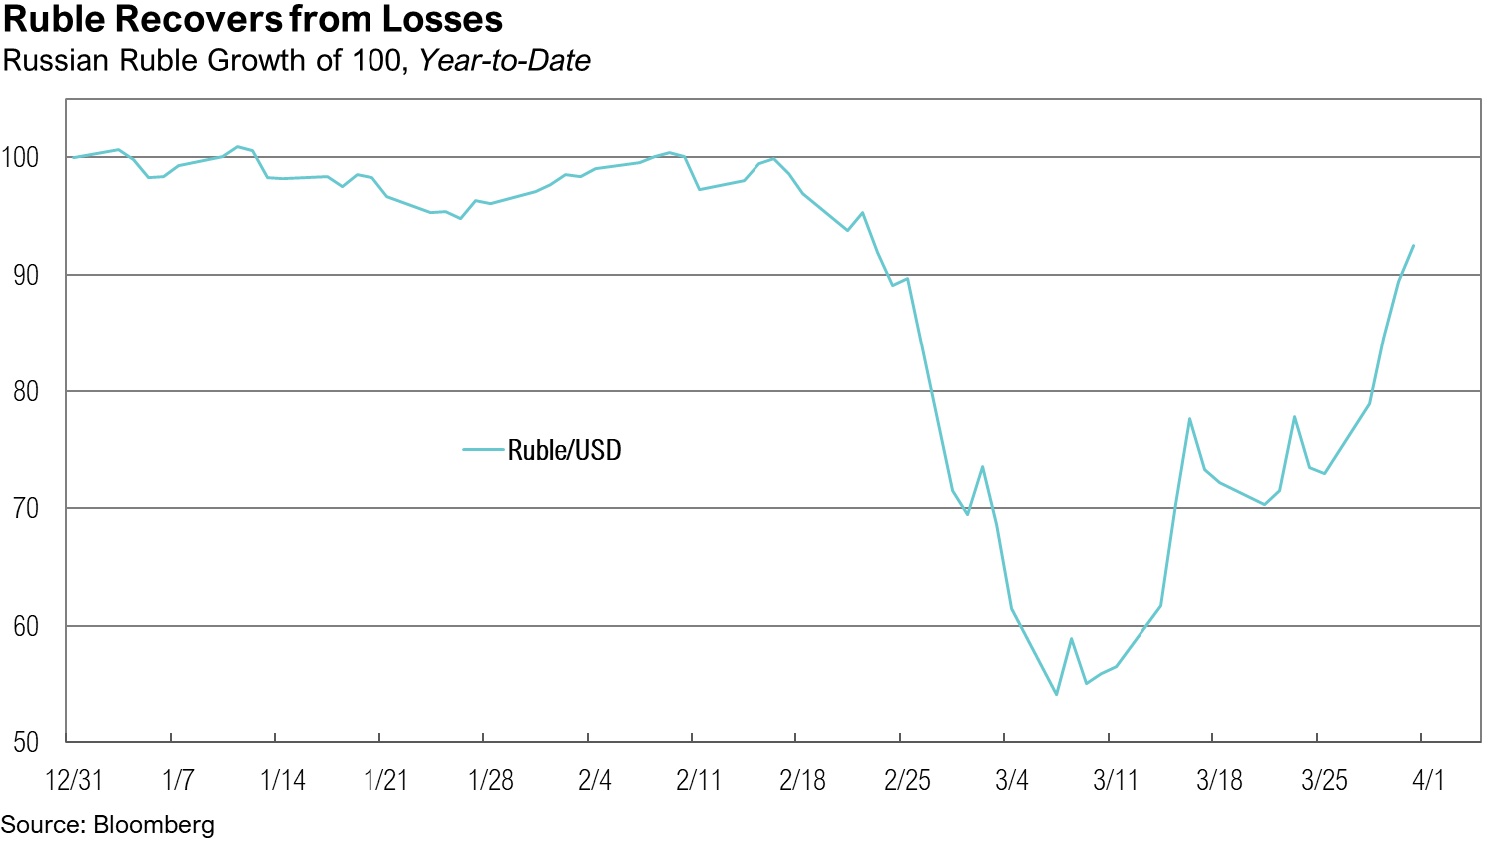
Western countries responded to Russia’s military aggression with economic warfare – several rounds of financial sanctions that were increasingly severe and focused on undercutting Russia’s economy. As a result, Russia’s currency, the ruble, imploded in value. At the time, President Joe Biden correctly cited this as an example of the economic hardship Russia would face as a result of the invasion. 5 Russia might have taken comfort in its $600 billion war chest of foreign exchange reserves, but in an unprecedented move, countries around the world confiscated these assets. 6 Even Switzerland, traditionally a neutral haven in times of war, froze Russian financial assets, including those of Vladimir Putin, Prime Minister Mikhail Mishustin, and Foreign Minister Sergey Lavrov.6 Notably, Russia had already sold the majority of its U.S. Treasury holdings in 2018 and retained only approximately $5 billion in total exposure. 7,8
The initial decline in the ruble was severe: -48% from where it started the year. In response, Russia raised domestic interest rates from 9.5% to 20%. 9 Russian authorities also capped the amount of dollars that residents could withdraw from foreign-currency bank accounts and barred banks from selling foreign exchange to customers for six months. 10 Western sanctions exempted Russian energy, which European countries depend on, and those transactions continued to occur in foreign currencies. 11 Putin then announced that foreign nations that aligned themselves with Ukraine must buy Russian gas with rubles, gold, or bitcoin rather than dollars and euros, thereby forcing sanctioning nations to support the Russian currency. 12 The ruble rallied 71% from its March 7 low, and by the end of the month, it had shockingly increased by 3.8% since the February 24 invasion.
Russia’s invasion also added insult to injury in terms of inflation concerns. In February, the Consumer Price Index was up 7.9% on a year-over-year basis, reaching an almost 40-year high, and this reading did not yet include the effects of the Russian invasion. The March reading, which did incorporate the effects of the invasion, hit 8.5%, its highest since 1981. Before the war in Ukraine, markets were anticipating six interest rate hikes from the Federal Reserve in 2022. By the end of March, markets were anticipating ten hikes, signaling an expectation that inflation would persist.
The Federal Reserve, which was already falling far behind the tightening curve before Russia’s invasion, found itself in an uncomfortable predicament. Minneapolis Federal Reserve President, Neil Kashkari, summed up the environment well in a recent piece:
“We do know that the wealth effect is a real phenomenon, and both the stock market and house prices are up roughly 30% relative to pre-pandemic levels, even households who don’t own stocks or homes have on average stronger balance sheets than before the pandemic. Perhaps this is leading people to be more confident and simply spend more. Either way, the FOMC must act to bring the economy back into balance.” 13
Because it can do little to improve the supply-side side constraints on commodity markets and global supply chains, the Federal Reserve seems focused instead on reducing demand by engineering an economic slowdown, a move that is justified by more than just inflation metrics. The most recent jobs report showed an unemployment rate of 3.6%, an unambiguously strong number and a dramatic improvement from the depths of the COVID-19 crisis two years ago. However, real GDP growth is already expected to slow substantially. The Atlanta Fed’s GDPNow model is estimating first quarter GDP growth to be 1%. 14
Markets
Within equities, small caps underperformed larger companies, falling 7.5% as measured by the Russell 2000 Index. From a style perspective, value stocks, measured by the Russell 1000 Value Index, outperformed the Russell 1000 Growth Index -0.7% to -9.0%. Growth stocks tend to have longer duration cash flows, leading to poor performance when interest rates rise. Value’s dominance was even more pronounced within small-cap stocks, as the Russell 2000 Value Index fell just 2.4% compared to a decline of 12.6% for the Russell 2000 Growth Index. From a sector perspective, energy was one of the only bright spots, returning an outstanding 39%. Oil prices served as a major tailwind, as WTI crude oil prices rose from $75 to $100/barrel throughout the quarter. Other positives were defensive areas of the market such as utilities, up 4.8%, and consumer staples, down just 1.3%. All other sectors had negative returns. Among the worst were growth-oriented sectors, including technology (-8.5%), consumer discretionary (-9.4%), and communication services (-11.3%).
Stocks outside of the U.S. trailed their U.S. counterparts during the quarter. Foreign developed market equity returns, as measured by the MSCI EAFE Index, fell 5.8% in U.S. dollar terms. The MSCI Emerging Markets Index fared even worse, down 6.9% in U.S. dollar terms. In addition to inflation and rising interest rates, the Russia/Ukraine conflict significantly affected market returns internationally. Countries with more exposure to Russian trade underperformed due to the retaliatory sanctions. Stocks in China, which is Russia’s biggest trading partner and accounts for 18% of Russia’s gross exports 18 , fell 14.2%. Germany, which is Russia’s second-biggest trading partner and relies on Russia for 65% of its natural gas imports, saw its equities fall 12.9%.
Within fixed income securities, short-term bonds outperformed longer-term bonds as the Bloomberg U.S. Aggregate 1-3 Year Index fell 2.5%. High yield bonds also outperformed, falling only 4.8%, due to their ability to generate income in rising rate environments. Non-U.S. bonds underperformed their U.S. counterparts due to interest rate hikes and poor currency returns. International developed and emerging market bonds finished the quarter down 7.1% and 10.0%, respectively. The inflation and central bank interest rate dynamic in Europe is very similar to the U.S. The most recent inflation reading was 7.5% on a year-over-year basis while the European Central Bank is holding its benchmark interest rate at 0%. 20
Looking Forward
If we could read the minds of Vladimir Putin and Fed Chairman Jerome Powell, it would be significantly easier to allocate capital for the rest of 2022, but we cannot. Inflation remains the critical determinant for both economic growth and asset prices, and its trajectory remains uncertain. Although inflation is expected to gradually and organically decline during the year, the Federal Reserve may be able to slow it even more quickly via a demand shock, but Putin could thwart its efforts by extending the war. Further, with interest rates rising so rapidly, the risks of the Federal Reserve doing too little may outweigh the risks of it doing too much.
The outcome of the Ukraine conflict remains highly uncertain and the path forward for monetary policy and inflation is on the forefront of investor’s minds. There is an expectation that these issues will continue to put pressure on the markets as well as energy and commodity prices in the near term. We feel that strong fundamentals and continuation of the economic recovery that started before the invasion should help markets over the longer term. To help weather the short-term volatility we are likely to experience in the coming months, we continue to recommend that clients stick to their long-term investment allocation targets and use the market volatility to their benefit, by taking advantage of rebalancing opportunities to selectively make changes within portfolios. As profoundly uncertain as the future is, such turmoil can provide opportunities, and we remain focused on analyzing incoming data to find avenues to deploy capital more efficiently and productively, while remaining cognizant of the ever-changing market dynamics.
2. IFPRI: https://www.ifpri.org/blog/how-will-russias-invasion-ukraine-affect-global-food-security
3. FRED: https://fred.stlouisfed.org/series/PCU3253132531
5. POTUS Twitter: https://twitter.com/POTUS/status/1501261304874549253
6. NY Times: https://www.nytimes.com/2022/02/28/us/politics/us-sanctions-russia-central-bank.html
7. CNN: https://money.cnn.com/2018/07/30/investing/russia-us-debt-treasury/index.html
8. Statista: https://www.statista.com/statistics/1226054/value-of-united-states-treasury-securities-held-by-russia/
13. Minneapolis Fed: https://www.minneapolisfed.org/article/2022/update-on-inflation-and-monetary-policy
14. Atlanta Fed: https://www.atlantafed.org/cqer/research/gdpnow
16. Bloomberg: https://www.bloomberg.com/news/articles/2022-03-24/nickel-reignites-blistering-rally-as-prices-spike-by-15-limit
20. Trading Economics: https://tradingeconomics.com/euro-area/interest-rate
Disclaimers
All market pricing and performance data from Bloomberg, unless otherwise cited. Asset class and sector performance are gross of fees unless otherwise indicated.
The opinions and analyses expressed in this newsletter are based on RMB Capital Management, LLC’s (“RMB Capital”) research and professional experience, and are expressed as of the date of our mailing of this newsletter. Certain information expressed represents an assessment at a specific point in time and is not intended to be a forecast or guarantee of future results, nor is it intended to speak to any future time periods. RMB Capital makes no warranty or representation, express or implied, nor does RMB Capital accept any liability, with respect to the information and data set forth herein, and RMB Capital specifically disclaims any duty to update any of the information and data contained in this newsletter. The information and data in this newsletter does not constitute legal, tax, accounting, investment or other professional advice. Returns are presented net of fees. An investment cannot be made directly in an index. The index data assumes reinvestment of all income and does not bear fees, taxes, or transaction costs. The investment strategy and types of securities held by the comparison index may be substantially different from the investment strategy and types of securities held by your account. The S&P 500 Index is widely regarded as the best single gauge of the U.S equity market. It includes 500 leading companies in leading industries of the U.S economy. The S&P 500 focuses on the large cap segment of the market and covers 75% of U.S. equities. The Bloomberg Barclays U.S. Aggregate Bond Index is a broad based benchmark that measures the investment grade. The Consumer Price Index (CPI) is a measure of the average change over time in the prices paid by urban consumers for a market basket of consumer goods and services. Indexes are available for the U.S. and various geographic areas. Average price data for select utility, automotive fuel, and food items are also available. The MSCI All Country World Index (ACWI) is a stock index designed to track broad global equity-market performance. Maintained by Morgan Stanley Capital International (MSCI), the index comprises the stocks of nearly 3,000 companies from 23 developed countries and 25 emerging markets.