


Key Takeaways
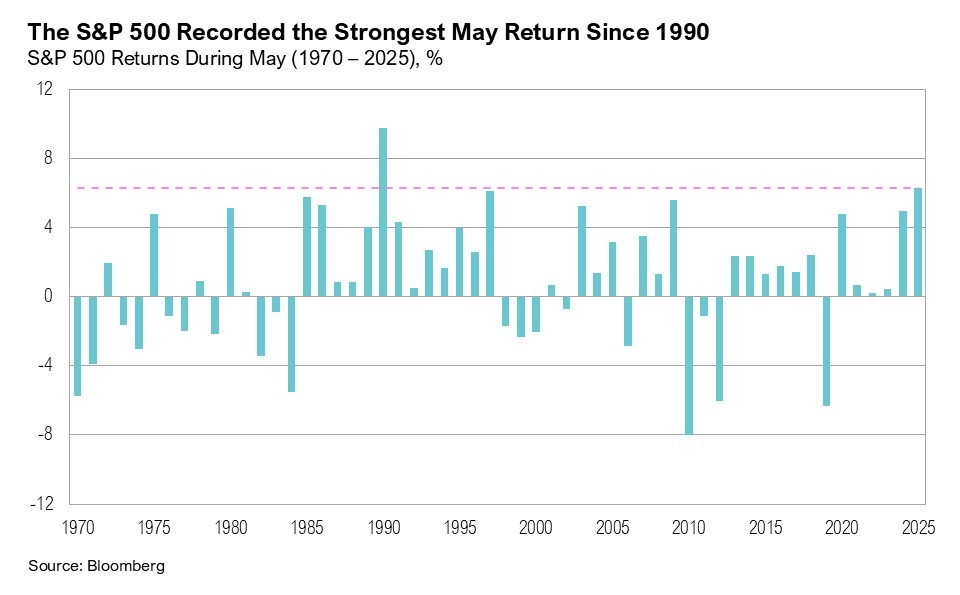
- U.S. large-cap stocks, as measured by the S&P 500, gained 6.3%—the strongest May return since 1990. U.S. small-cap stocks ended the month up 5.3%.
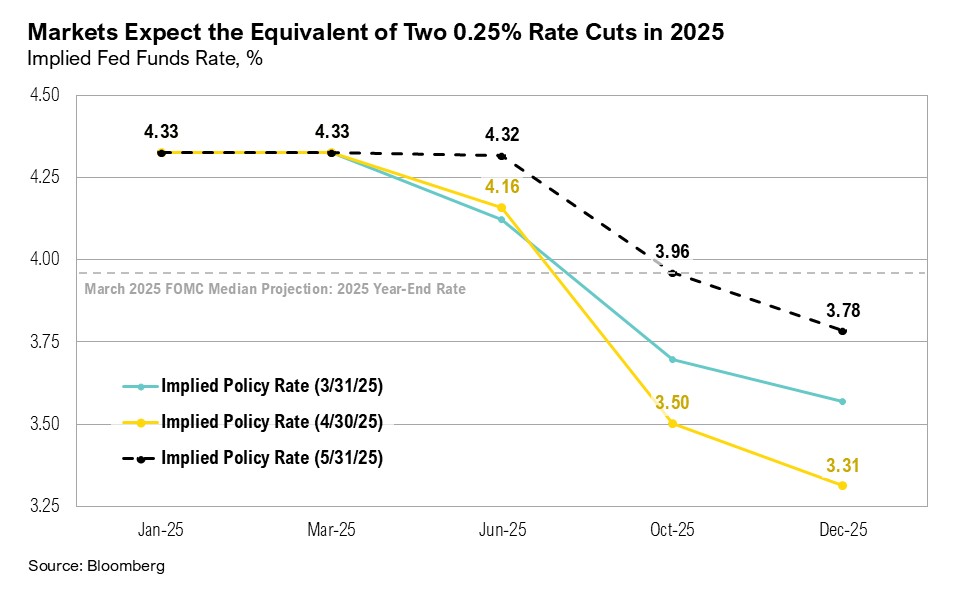
- The May jobs report showed steady job growth and unemployment, supporting the Federal Reserve’s stance to keep interest rates unchanged, and market expectations for rate cuts this year dropped from four to two by year end.
- Despite the many headlines surrounding tariffs and Trump’s tax and spending bill, equity markets remained relatively calm. The S&P 500 ended May back in slightly positive territory for the year.
- Markets appear to be looking past near-term tariff-related disruptions, focusing instead on potential gains that could come from small business spending, domestic manufacturing, and capital investment.
Overview
U.S. large-cap stocks, as measured by the S&P 500, gained 6.3%, the strongest May return since 1990 when the index rose 9.3%. Similarly, the U.S. small-cap Russell 2000 Index ended the month up 5.3%. In contrast, U.S. intermediate-term bonds, represented by the Bloomberg U.S. Aggregate Bond Index, declined 0.7% in May.
Updated first-quarter GDP estimates show that the U.S. economy contracted at an annualized 0.2% quarter over quarter—a marginal improvement from the initial estimate of a 0.3% decline.1 The upward revision was driven by stronger business investment and inventory accumulation. However, consumer spending was revised down from 1.8% to 1.2%.1 An additional sign of a slowdown in economic growth, the ISM Services PMI fell into contractionary territory in May for the first time in 11 months, posting a reading of 49.9.2
The May jobs report showed a resilient, yet gradually moderating, labor market. The economy added 139,000 new jobs—slightly above the expected 126,000—while the unemployment rate held steady at 4.2%. However, downward revisions totaling 95,000 jobs across the previous two months tempered some of the optimism.3 Still, the slightly better-than-expected jobs report likely gave the Federal Reserve sufficient justification to keep interest rates unchanged at the next Federal Open Market Committee (FOMC) meeting. While the May 7 FOMC meeting minutes signaled the Fed’s inclination to hold rates steady, market expectations have shifted: investors now anticipate the equivalent of two 0.25% rate cuts by year end, down from four projected cuts just a month ago.4,5
Calm Amid Chaos
On April 2, President Trump invoked the International Emergency Economic Powers Act (IEEPA), declaring a national emergency to impose broad tariffs, including a 10% tariff on imports from all countries and higher rates for nations with large trade deficits. On May 28, the U.S. Court of International Trade ruled that the tariffs exceeded the president’s authority under IEEPA and blocked most of those imposed on April 2.6,7 However, the U.S. Court of Appeals for the Federal Circuit issued a temporary stay on May 29, allowing the tariffs to remain in effect while the government appeals the ruling.8,9
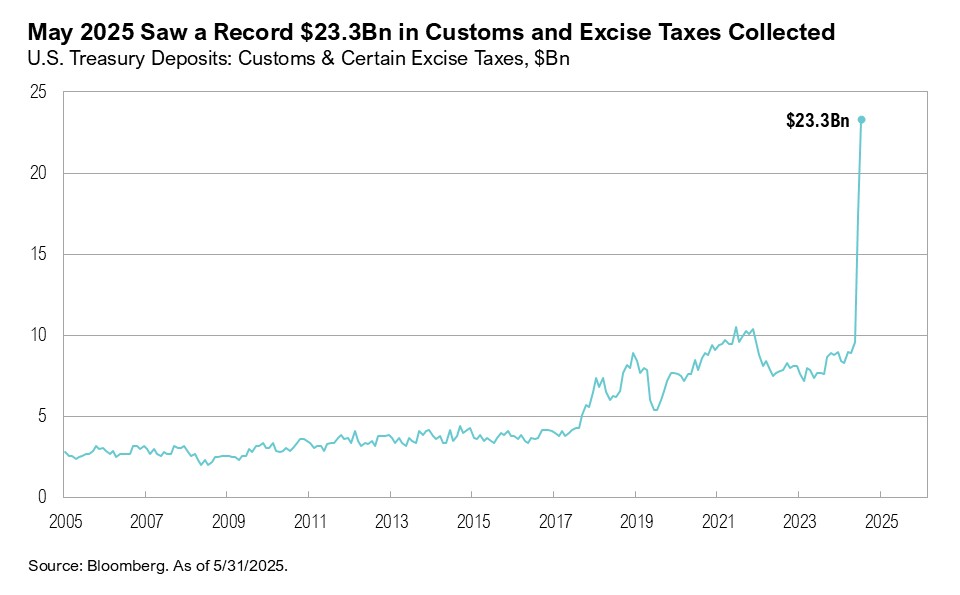
On May 22, the House of Representatives passed Trump’s spending and tax bill, the One Big Beautiful Bill Act (OBBBA).10,11 As of the end of May, the bill was under consideration in the Senate. OBBBA seeks to extend major provisions of the 2017 Tax Cuts and Jobs Act (TCJA)—currently set to expire at the end of 2025—while introducing spending cuts and new revenue measures.10,11 The Congressional Budget Office (CBO) estimates the bill would add roughly $2.4 trillion to the federal deficit over the next decade.12 However, the true fiscal impact is difficult to assess: the CBO does not account for second-order growth effects, potential recession scenarios, or the possibility that the TCJA will be extended beyond its scheduled expiration. Notably, tariff revenues were much higher this May: a record $23.3 billion in customs and excise taxes were collected despite declining import volumes. The CBO estimates that if Trump’s tariffs stay in place for a full decade, they could reduce the federal debt by $2.8 trillion—which the White House claims could potentially offset the debt that the OBBBA would add. That said, the CBO also flagged some trade-offs: higher inflation over the next two years and slower economic growth.13
By the end of May, nearly all S&P 500 companies had reported first-quarter earnings. Earnings growth for the index has nearly doubled since March 31, rising from 7% year-over-year to 13%.14 The strongest gains came from healthcare (43%), communication services (29%), and technology (16%). However, as earnings season progressed, full-year earnings growth projections declined—from 11% to 9%.14 On May 28, Nvidia reported first-quarter results, beating both revenue and earnings expectations. Revenue rose nearly 70% year-over-year to $44.1 billion, despite a $2.5 billion hit from unsold H20 chips due to U.S. export restrictions on China.15 Nvidia’s share price has climbed 50% since the April 4 market low. The strength in mega-cap tech endures, with capital expenditure guidance from Amazon, Alphabet, Microsoft, and Meta pointing to a combined $330 billion in AI investment in 2025—a 35% year-over-year increase—and a projected $1 trillion over the next three years.16, 17,18,19 Notably, computer equipment spending added a record 1% to first-quarter U.S. GDP, reinforcing the view that the AI boom continues to quietly drive economic momentum.20
U.S. large-cap stocks posted their best May since 1990. Despite headline chaos from tariffs, the OBBBA, and other market and geopolitical events, this strong May helped bring year-to-date returns for the S&P 500 to a very calm +1% and just 4% below an all-time high—achieved in spite of a nearly 20% decline between February 19 and April 8. Credit spreads, which spiked to 4.3% in mid-April amid tariff concerns, fell to 3.1% by month end, continuing to signal economic resilience despite softening macro data. Betting market odds of a recession also dropped sharply—from 66% on May 2 to 34% at month-end.21 In contrast to the relative calm in equities, fixed income markets were volatile throughout the month. The 10-year Treasury yield surged to 4.6% following news of the OBBBA’s passage in the House, before retreating to end May at 4.4%.
Markets
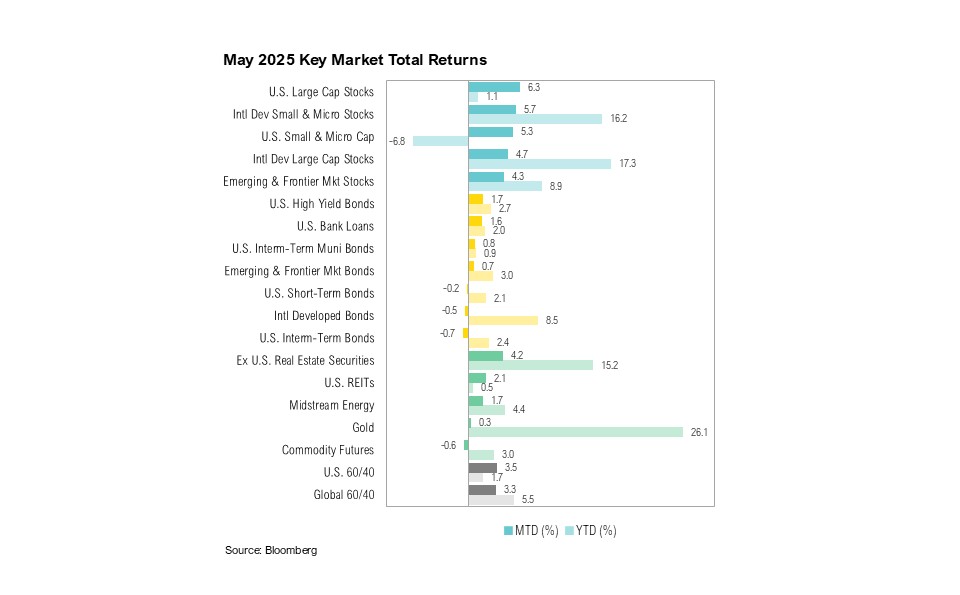
U.S. large-cap stocks ended May up 6.3%, and international developed large-cap stocks gained a still-respectable 4.7%. U.S. small-cap stocks marginally underperformed their international counterparts. The former gained 5.3%, and the latter ended the month up 5.7%. Emerging and frontier market stocks gained 4.3%. U.S. intermediate-term bonds ended May down 0.7%.
Gold, which remains a strong performer for the year to date (gaining 26% since January), ended the month up 0.3%, at $3,290 per ounce. Despite sharing many of the same qualities as gold, platinum had thus far been noticeably absent from the precious metals rally. Through the end of May, platinum prices increased by nearly 10% over the month (and gained 16% year-to-date) on tightening demand-supply dynamics and renewed investor interest.22
Looking Forward
Despite the chaotic headlines, investors seem unfazed by the uncertainty surrounding tariffs and instead appear more focused on potential long-term positives, including a resilient U.S. economy, a broadening global equity rally, and the more pro-growth aspects of this administration's policy agenda. Earnings growth estimates for the S&P 500 in 2025, while off their highs, are over 9%, credit spreads remain contained, and the AI infrastructure boom appears durable. Although notable risks remain and volatility could increase during the second half of the year, areas like small business spending, domestic manufacturing, and capital investment could deliver welcome surprises. If the positive economic factors outweigh the negative ones, the current market calm may continue. However, this calm could be disrupted if the U.S. administration renews its focus on spending cuts, inflation increases significantly, or Treasury yields rise meaningfully—just some of the key risks we are monitoring.
There is an unusually high amount of uncertainty in the market spurred by the tariff announcement in early April, the subsequent escalation and de-escalation of the “trade war” over the last 30 days, the ongoing budget reconciliation in the US and recent events in the Middle East. We expect the increased volatility in markets to continue in the coming weeks and months and remain cautious with risk assets as the current cycle plays out. To guide our views, we will be watching the outcomes of various trade negotiations and how companies respond to the new trade dynamics with business decisions. The Federal Reserve will continue to play a key role and their response to both economic conditions and stress on financial markets is another area to watch.
The range of outcomes remains very wide during this period of uncertainty. No one can predict the future and this is not a time to make big bets or try to time the market. While there may be further downside in the markets from here, we would look to maintain targeted risk asset exposure moving forward. Liquidity is extremely valuable in this environment. Although equity valuations generally remain at above average levels, we would view lower asset prices as a potential opportunity to put additional capital to work. We remain biased towards high-quality companies with strong management teams that will be able to navigate the current environment within our core stock portfolios. We have been well-positioned within core bond portfolios with a low weight toward shorter-duration corporate bonds and a higher weight toward longer-duration treasury bonds. We continue to tactically rebalance within asset classes and make changes within individual portfolios. These portfolio level changes are likely to have more clarity than macro views in this environment. As always, we believe clients are best served reminding themselves of the timeless principles of patience and diversification. The key to successful investing is often remaining committed to long-term investment plans.
Citations
- Bureau of Economic Analysis: https://www.bea.gov/news/2025/gross-domestic-product-second-estimate-corporate-profits-preliminary-estimate-1st-quarter
- ISM: https://www.ismworld.org/supply-management-news-and-reports/reports/ism-report-on-business/services/may/
- Bureau of Labor Statistics: https://www.bls.gov/news.release/empsit.nr0.htm
- Federal Reserve: https://www.federalreserve.gov/monetarypolicy/files/fomcminutes20250507.pdf
- CME: https://www.cmegroup.com/markets/interest-rates/cme-fedwatch-tool.html
- Reuters: https://www.reuters.com/world/us/us-court-blocks-trumps-liberation-day-tariffs-2025-05-28/
- Wall Street Journal: https://www.wsj.com/politics/policy/trade-court-strikes-down-trumps-liberation-day-tariffs-9befa448
- Reuters: https://www.reuters.com/business/us-ruling-that-trump-tariffs-are-unlawful-stirs-relief-uncertainty-2025-05-29/
- BBC: https://www.bbc.com/news/articles/c93ywvl7yy5o
- Thomson Reuters Tax & Accounting: https://tax.thomsonreuters.com/news/house-rules-committee-debates-one-big-beautiful-bill/
- Politico: https://www.politico.com/news/2025/05/22/house-republicans-pass-big-beautiful-bill-after-weeks-of-division-00364691
- Congressional Budget Office: https://www.cbo.gov/publication/61461
- Congressional Budget Office: https://www.cbo.gov/system/files/2025-06/61389-Tariff-Effects.pdf
- FactSet: https://advantage.factset.com/hubfs/Website/Resources%20Section/Research%20Desk/Earnings%20Insight/EarningsInsight_060625A.pdf
- Nvidia: https://nvidianews.nvidia.com/news/nvidia-announces-financial-results-for-first-quarter-fiscal-2026
- CNBC: https://www.cnbc.com/2025/02/06/amazon-expects-to-spend-100-billion-on-capital-expenditures-in-2025.html
- Reuters: https://www.reuters.com/technology/alphabet-ceo-reaffirms-planned-75-billion-capital-spending-2025-2025-04-09/
- CNBC: https://www.cnbc.com/2025/02/24/microsoft-reiterates-plan-to-invest-80-billion-in-ai-.html
- Reuters: https://www.reuters.com/technology/meta-invest-up-65-bln-capital-expenditure-this-year-2025-01-24/
- Bloomberg
- Polymarket: https://polymarket.com/event/us-recession-in-2025
- Mining.com: https://www.mining.com/platinum-price-surges-to-highest-since-2021-as-market-tightens/
Index Definitions
The S&P 500 Index is widely regarded as the best single gauge of the United States equity market. It includes 500 leading companies in leading industries of the U.S. economy. The S&P 500 focuses on the large cap segment of the market and covers approximately 75% of U.S. equities.
The Bloomberg Barclays U.S. Aggregate Index represents securities that are SEC-registered, taxable, and dollar denominated. The index covers the U.S. investment grade fixed rate bond market, with index components for government and corporate securities, mortgage pass-through securities, and asset-backed securities. Duration is roughly 5 years.
The Bloomberg U.S. Corporate High Yield Bond Index measures the USD-denominated, high yield, fixed-rate corporate bond market. Securities are classified as high yield if the middle rating of Moody’s, Fitch and S&P is Ba1/BB+/BB+ or below. Bonds from issuers with an emerging markets country of risk, based on the indices’ EM country definition, are excluded.
The Russell 2000® Index measures the performance of the small-cap segment of the US equity universe. It includes approximately 2000 of the smallest US equity securities in the Russell 3000 Index based on a combination of market capitalization and current index membership. The Russell 2000 Index represents approximately 10% of the total market capitalization of the Russell 3000 Index. Because the Russell 2000 serves as a proxy for lower quality, small cap stocks, it provides an appropriate benchmark for RMB Special Situations.
The U.S. Dollar Index is used to measure the value of the dollar against a basket of six foreign currencies: the euro, Swiss franc, Japanese yen, Canadian dollar, British pound, and Swedish krona.
MSCI U.S. REIT Index is a free float-adjusted market capitalization weighted index that is comprised of equity Real Estate Investment Trusts (REITs). The index is based on the MSCI USA Investable Market Index (IMI), its parent index, which captures the large, mid and small cap segments of the USA market. With 150 constituents, it represents about 99% of the US REIT universe and securities are classified under the Equity REITs Industry (under the Real Estate Sector) according to the Global Industry Classification Standard (GICS®), have core real estate exposure (i.e., only selected Specialized REITs are eligible) and carry REIT tax status.
*Source: MSCI.MSCI makes no express or implied warranties or representations and shall have no liability whatsoever with respect to any MSCI data contained herein. The MSCI data may not be further redistributed or used as a basis for other indexes or any securities or financial products. This report is not approved, endorsed, reviewed or produced by MSCI. None of the MSCI data is intended to constitute investment advice or a recommendation to make (or refrain from making) any kind of investment decision and may not be relied on as such.
Performance Disclosures
All market pricing and performance data from Bloomberg, unless otherwise cited. Asset class and sector performance are gross of fees unless otherwise indicated.
The opinions and analyses expressed in this newsletter are based on Curi RMB Capital, LLC’s (“Curi RMB Capital”) research and professional experience are expressed as of the date of our mailing of this newsletter. Certain information expressed represents an assessment at a specific point in time and is not intended to be a forecast or guarantee of future results, nor is it intended to speak to any future time periods. Curi RMB Capital makes no warranty or representation, express or implied, nor does Curi RMB Capital accept any liability, with respect to the information and data set forth herein, and Curi RMB Capital specifically disclaims any duty to update any of the information and data contained in this newsletter. The information and data in this newsletter does not constitute legal, tax, accounting, investment or other professional advice. Returns are presented net of fees. An investment cannot be made directly in an index. The index data assumes reinvestment of all income and does not bear fees, taxes, or transaction costs. The investment strategy and types of securities held by the comparison index may be substantially different from the investment strategy and types of securities held by your account. RMB Asset Management is a division of Curi RMB Capital.