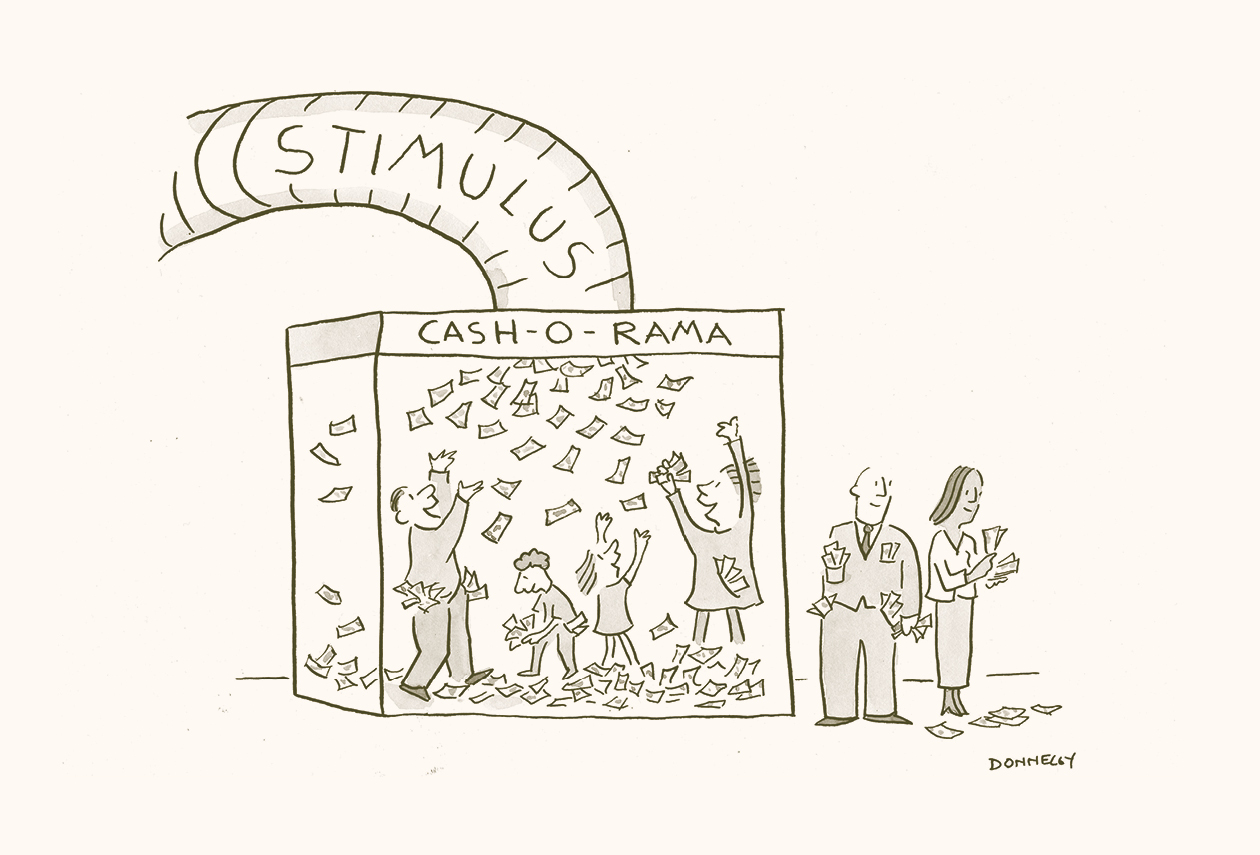
The past 15 months have brought many surprises and challenges. In response, the federal government provided exceptional financial support for the U.S. economy with trillions of dollars in aid and stimulus that was distributed to American businesses and households. While this stimulus helped many, it also has longer-term consequences for the economy as it relates to the ballooning federal debt, the potential for higher inflation, and the impact on monetary policy, including interest rates. Even in the face of these concerns, the Biden administration is pushing for additional support via the Build Back Better Plan. This plan is broken into three parts: the American Jobs Plan, the American Families Plan, and the American Rescue Plan. Here, we will summarize these plans and the related proposals for how to pay for them—and conclude with our perspective on how all of this might impact the financial markets.
The American Jobs Plan: Infrastructure Spending and Job Creation
At the end of March, President Biden announced a $2 trillion spending plan for infrastructure and U.S. employment support, known as the American Jobs Plan. Beyond its focus on creating a clean-energy workforce and generating jobs in both manufacturing and caregiving for the elderly and disabled, this plan includes projects such as repairing roads and bridges and rebuilding schools and hospitals. Should this plan pass Congress, the largest portion of it, $650 billion, will be put toward American homes, schools, and commercial buildings. Another $621 billion will be used to rebuild the transportation infrastructure. And $400 billion is earmarked to support higher-quality housing and care of the elderly and people with disabilities. The remaining $300 billion will be put toward manufacturing, including research and development.
To generate funding to pay for the proposed infrastructure spending, the president also announced the Made in America Tax Plan. The objective of the tax plan is “to fix the corporate tax code so that it incentivizes job creation and investment here in the United States, stops unfair and wasteful profit shifting to tax havens, and ensures that large corporations are paying their fair share.”1 According to the U.S. Treasury, the Made in America Tax Plan includes the following proposals:2
1. Raising the corporate income tax rate to 28%;
2. Strengthening the global minimum tax for U.S. multinational corporations;
3. Reducing incentives for foreign jurisdictions to maintain ultra-low corporate tax rates by encouraging global adoption of robust minimum taxes;
4. Enacting a 15% minimum tax on book income of large companies that report high profits but have little taxable income;
5. Replacing flawed incentives that reward excess profits from intangible assets with more generous incentives for new research and development;
6. Replacing fossil fuel subsidies with incentives for clean-energy production; and
7. Ramping up enforcement to address corporate tax avoidance.
The American Families Plan and The American Rescue Plan: More Aid to Families
In addition, the plan will include provisions for housing incentives by increasing resources through the Low-Income Housing Tax Credit.
The president has also introduced a $1.8 trillion spending plan, the American Families Plan, to help American families and children by investing in education, providing support to children and families, and extending tax cuts to these families. The plan is broken down into two parts: $1 trillion in investments and $800 billion in tax cuts for American families and workers.3 A hope is that this plan will also result in a long-term boost to economic growth.
While the American Jobs Plan is proposed to be funded by a hike in corporate taxes, the American Families Plan will be supported by a tax increase on high-income individuals, specifically those earning more than $400,000 a year. Additionally, the Biden administration has proposed a capital gains tax increase on the top 1% of taxpayers, those making over $1 million a year.
Biden’s American Rescue Plan was signed on March 11, 2021, and so far is the only plan that has been enacted. It is most known as the third direct-to-taxpayer stimulus (since the onset of the pandemic in March 2020) for lower- and middle-income families and workers. It aims to provide approximately 161 million payments of $1,400 per person in American households.4 It will also provide additional support for food aid, expand the Child Tax Credit, and help struggling schools and small businesses.
Market Impact of Potential Tax Hikes
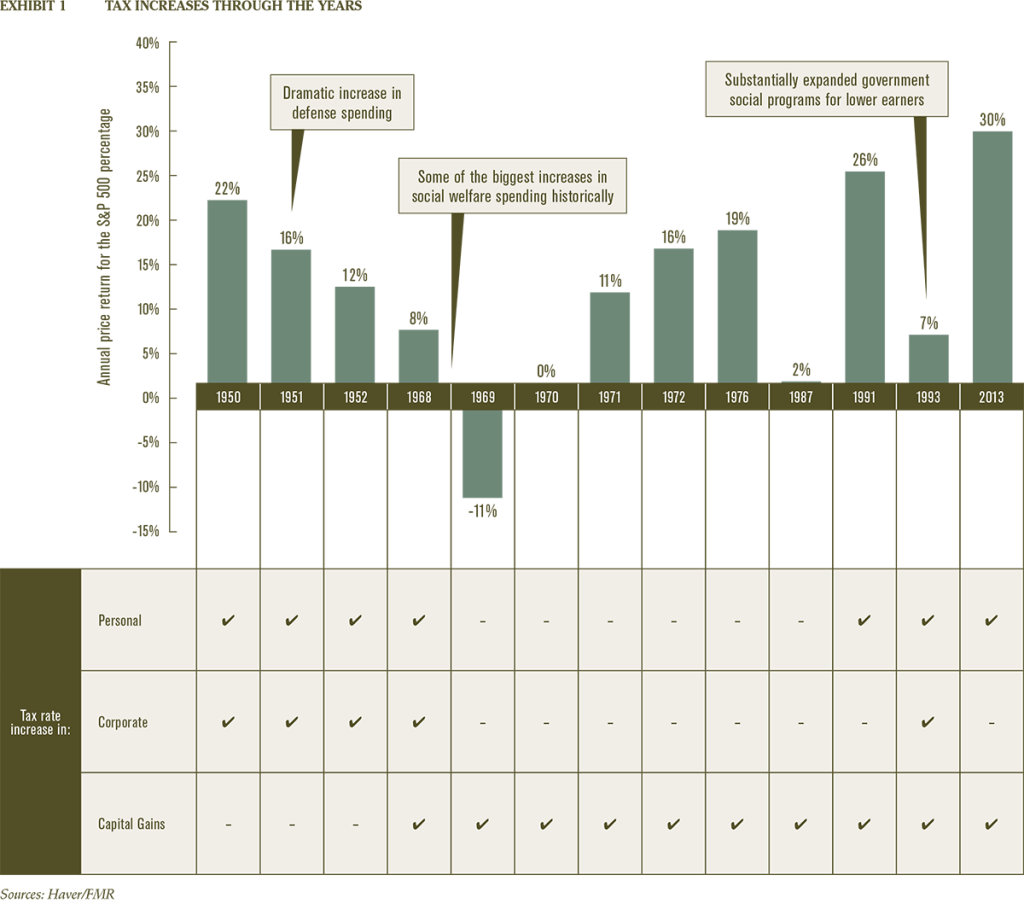
In general, expansionary fiscal policy is positive for the market, except when tax burdens are too high. With the proposed increased taxation of corporations, earnings estimates could be negatively impacted. However, market returns have not always followed in line with tax rates. Looking back on the past 70 years (Exhibit 1),4 the S&P 500 Index had higher-than-average returns in years when tax hikes were implemented. In particular, the 1950s had some of the best returns, even though the wealthiest American households were subject to a high marginal tax rate. But, when taxes were low in the 2000s, the markets experienced two of the largest collapses. This is not to say higher tax rates do not pose a threat to the markets, but the degree to which they will have an impact remains in question and is likely to be limited.
Future Implications and Planning
We do not know if Congress will pass these plans, so it is unclear what concerns may arise. However, we are optimistic that the Build Back Better Plan could be helpful as long as personal taxes for the average American remain at low levels, which seems likely given that those impacted by the proposed tax hike would be investors and the significantly wealthy. It is also important to note that not all investments will be affected by the tax hikes. We suggest not making any significant decisions while these proposals are still in their early stages and have not yet been approved. One area to continue to keep an eye on, however, would be growth stocks. With corporate taxes potentially increasing through the Made in America Tax Plan, earnings could be negatively affected, leading to a continuation of headwinds on growth stocks. We continue to believe it is essential to have a well-diversified portfolio to be prepared for whatever is to come next.
- The White House, “Fact Sheet: The American Jobs Plan,” March 31, 2021, https://www.whitehouse.gov/briefing-room/statements-releases/2021/03/31/fact-sheet-the-american-jobs-plan/.
- U.S. Department of the Treasury, “The Made in America Tax Plan,” April 2021, https://home.treasury.gov/system/files/136/MadeInAmericaTaxPlan_Report.pdf.
- The White House, “Fact Sheet: The American Families Plan,” April 28, 2021, https://www.whitehouse.gov/briefing-room/statements-releases/2021/04/28/fact-sheet-the-american-families-plan/.
- Fidelity, “History lessons from past tax hikes,” April 13, 2021, https://www.fidelity.com/learning-center/trading-investing/tax-hikes-history.
The opinions and analyses expressed in this communication are based on RMB Capital’s research and professional experience and are expressed as of the mailing date of this communication. Certain information expressed represents an assessment at a specific point in time and is not intended to be a forecast or guarantee of future results, nor is it intended to speak to any future time periods. RMB Capital makes no warranty or representation, express or implied, nor does RMB Capital accept any liability, with respect to the information and data set forth herein, and RMB Capital specifically disclaims any duty to update any of the information and data contained in this communication. The information and data in this communication do not constitute legal, tax, accounting, investment, or other professional advice. An investment cannot be made directly in an index. The index data assumes reinvestment of all income and does not bear fees, taxes, or transaction costs. The investment strategy and types of securities held by the comparison index may be substantially different from the investment strategy and types of securities held by your account.
Index Descriptions
The S&P 500® is widely regarded as the best single gauge of large-cap U.S. equities. There is over USD 7.8 trillion benchmarked to the index, with index assets comprising approximately USD 2.2 trillion of this total. The index includes 500 leading companies and captures approximately 80% coverage of available market capitalization.


