Key Takeaways
- Equity markets concluded the first three months of 2024 on a strong note as the S&P 500 achieved new all-time highs. The small cap Russell 2000 ended March at its highest level since January 2022.
- With inflation persistently above its stated 2% target, the Fed’s position may be shifting, and it seems more willing to tolerate these higher levels.
- Ongoing unchecked fiscal spending is driving up the federal deficit and interest costs.
- If inflation stays higher and long-term bond yields remain under control, higher equity valuations may be sustained; but persistently high interest rates may continue to challenge the interest-rate-sensitive areas of the market.
Overview
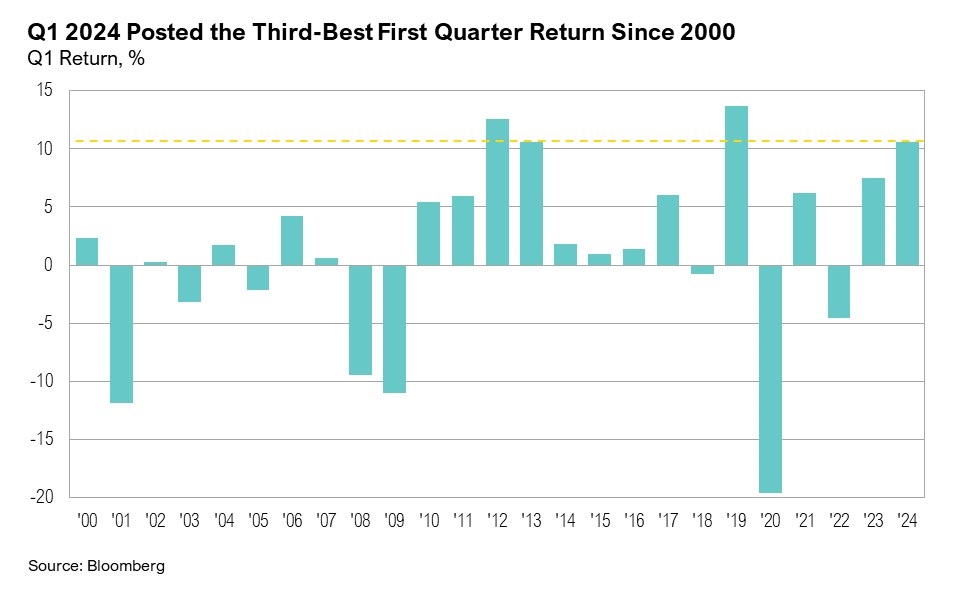
Equity markets ended the first quarter on a strong note. The S&P 500 continued to climb to new all-time highs throughout the quarter. U.S. large cap stocks ended the quarter up a noteworthy 10.6%, making it the third-best first quarter since 2000 (tied with 2013). The Russell 2000 ended March at its highest level since January 2022, and U.S. small cap stocks ended the month up 2.5% and the quarter up 5.2% in a welcome sign that the equity market rally may be broadening. The Bloomberg U.S. Aggregate Bond Index ended the first quarter down 0.8%, and interest-rate-sensitive areas of the market continued to feel the pressure of higher rates. Real estate was the only S&P 500 sector to end the quarter with negative returns, declining 0.5%.
Final gross domestic product (GDP) results, released at the end of March, confirmed that the U.S. economy remained strong throughout 2023. Fourth quarter GDP growth was revised upwards from 3.2% to an annualized 3.4%, and the personal consumption expenditure component of GDP grew from 3.0% to 3.3%.1 The federal government component of GDP grew by an annualized 2.4% in the fourth quarter.1 There were further signs of economic strength over the first quarter of 2024. Manufacturing sector activity grew for the first time since October 2022, as evidenced by the ISM Manufacturing PMI’s March reading of 50.3 (a reading above 50 signals expansion in the sector).2
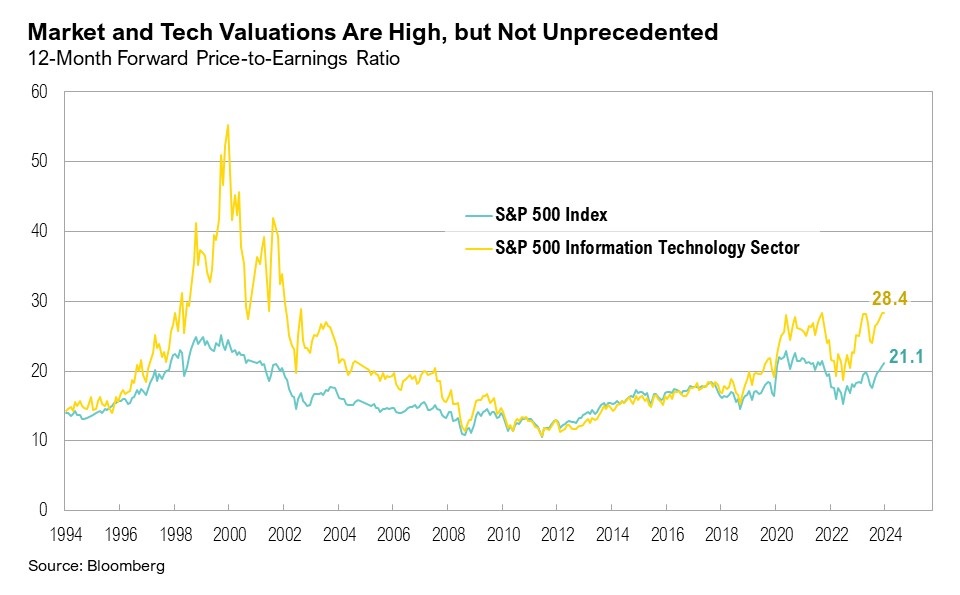
Following the conclusion of the fourth quarter 2023 earnings season, earnings growth for the period was revised upwards to 4.2% from an initial forecast of 1.5% at the end of 2023.3 This improved outlook was primarily driven by the communication services and consumer discretionary sectors. Full-year earnings growth projections for 2024 were at 11.0% at the end of March.3 Current S&P 500 valuations remain well above historical averages. The forward 12-month price-to-earnings (PE) ratio has hit 21.1, surpassing both the 5-year and 10-year averages of 19.1 and 17.9, respectively. Within the S&P 500, information technology sector valuations reached new local highs, climbing from 26.7 to 28.4, as price gains outpaced earnings growth expectations. Even though tech sector valuations are high, they remain significantly lower than what was seen during the Tech Bubble, where forward PE ratios peaked at 55.2 in March 2000. The information technology sector’s 12.7% gain over the quarter was largely dominated by AI-leader Nvidia, which ended the quarter up 82.5%. The communication services sector was the top-performing sector during the quarter, rising 15.8%. Notably, Tesla, one of the 10 largest companies in the S&P 500 by market cap, ended the quarter down 30.6%, making it the worst-performing stock of the entire S&P 500 for the year to date.
One year after the collapse of Silicon Valley Bank—an event that precipitated the failure of two additional U.S. banks—regional banks remain under close scrutiny. Regional banks have continued to grapple with an increase in delinquencies for commercial real estate loans and consumer loans, including credit cards and auto loans, and delinquency rates on these loans are approaching those last seen during the Global Financial Crisis. For example, the share price of New York Community Bank (NYCB) has fallen over 70% year to date, triggered by a report in early February that the bank’s loan loss provisions had exceeded expectations by more than tenfold.4 The bank’s challenges primarily stem from issues within its loan portfolio, notably $5 billion in multifamily loans that it acquired during the pandemic, which are starting to show signs of delinquency.4 Regional banks ended the first three months of 2024 down 6.3%.
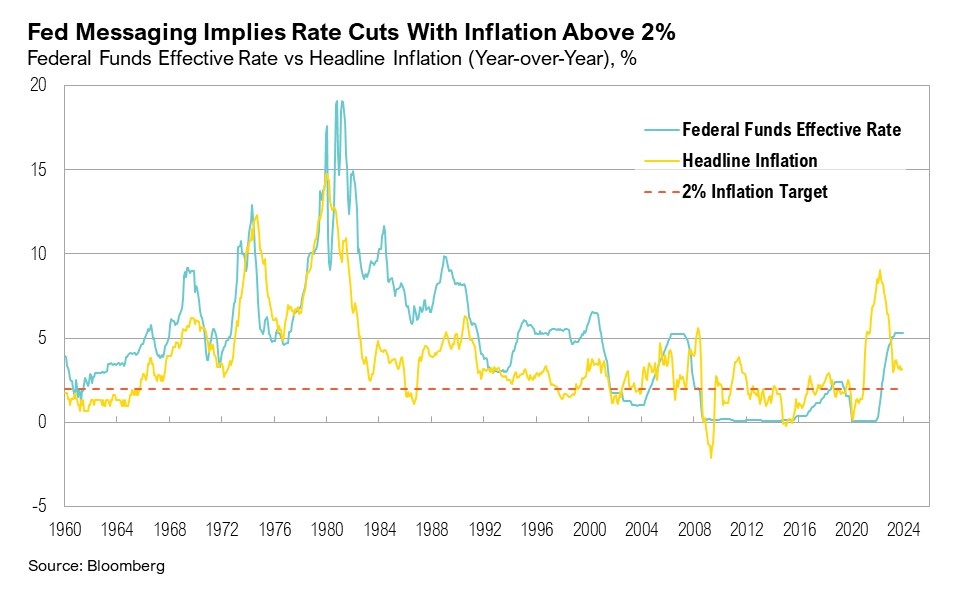
March also marked the second anniversary of the Federal Reserve’s first rate hike of the current cycle. For the past three years, inflation has remained above 3% due to the combination of a strong labor market, robust spending rates, and strong economic growth. However, the Fed’s apparent willingness to cut interest rates soon may indicate that its inflation target has shifted from 2% to a more easily reachable 3%.
The Fed’s Aim: A New Bull's Eye
Rarely does one of the world’s most influential and reputable central banks increase its forecast for inflation—from already-too-high levels—and growth, while simultaneously guiding to a dovish policy approach. However, on March 20, the U.S. Federal Reserve revised upwards its GDP growth and inflation projections while also improving its employment outlook for the year. It also communicated a readiness to accept elevated inflation for an extended period and a willingness to slow the reduction of its balance sheet.
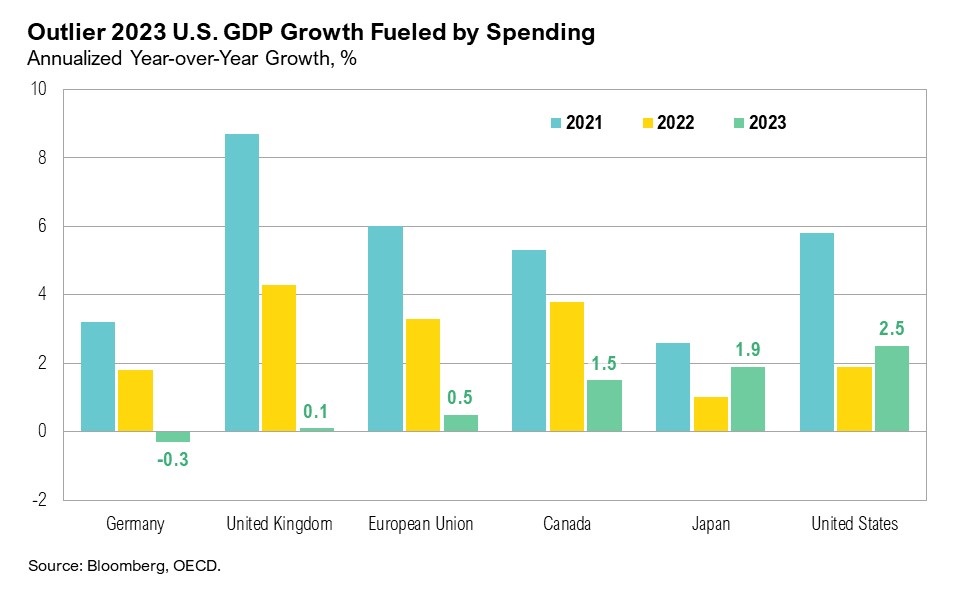
Inflation has been above the Federal Reserve’s stated target for three years. Robust spending (from both consumers and the government) has kept the U.S. economy strong throughout the Fed’s aggressive rate-hiking cycle that started in March 2022 when headline inflation was at 8.5%. In 2023, real GDP increased by an annualized 2.5%, compared to a 1.9% increase in 2022. The U.S. remains a positive outlier in global economic growth, far outpacing developed nation peers. For example, in 2023, real GDP grew by 1.9% in Japan and 0.1% in the United Kingdom and declined by 0.3% in Germany.5 The relatively strong growth in real GDP in the U.S. in 2023 was primarily reflected in consumer spending and government spending.1
Consumer spending in the U.S. remains resilient, despite elevated prices and higher interest rates. Consumers continue to rely on credit cards to support spending, as evidenced by the $14.1 billion monthly increase in consumer credit in February.6 Additionally, the personal savings rate dipped to 3.6% in February, which remains well below the 2009 to 2019 average savings rate of 6.1%.7 Contributing to consumers’ willingness to take on new debt and save in lower rates, the unemployment rate remains near four-decade lows, at 3.8%.8 Personal spending jumped by 0.8% in February, which was the largest monthly gain since January 2023.9 Consumer sentiment ticked up over the quarter, ending March at 79.4—the highest level since July 2021.10,11 Sentiment was boosted by a rising stock market and lower inflation expectations.11 Many companies continued to report strong consumer demand throughout the quarter. According to Mastercard President Linda Kirkpatrick:
“The consumer remains resilient and consumer spending remains robust. As we look to both macro factors as well as Mastercard’s own data, we see that spending is quite healthy.”12
Wells Fargo CFO Mike Santomassimo shared a similar sentiment:
“I feel that we say the same thing over and over the last number of quarters, but the consumer continues to be very resilient through a time where I think we all would have thought there would be more weakness at this point.”13
Similar to consumers, the government is also spending at an impressive clip, and fiscal spending continues unchecked. The U.S. federal budget deficit expanded over the quarter, as March marked the halfway point of the 2024 fiscal year. In the first six months of the fiscal year, the deficit rose to $1.064 trillion as interest costs on the national debt also rose.14 Net interest payments through March climbed to $429 billion—roughly equal to the $433 billion that the U.S. spent on defense over the past six months.14,15
While economic evidence suggests neither the economy nor inflation is slowing down meaningfully, guidance from the Fed suggests an increasing likelihood that it could start cutting interest rates and dialing back quantitative easing into a major structural fiscal deficit and with inflation above their 2% target. At a conference on March 29, Powell indicated their revised approach to inflation:
“We’ve said we would not wait for inflation to get down to 2% because, if you wait for that, monetary policy works with long and variable lags. So, we’ve said for some years that we would start restoring the Federal funds rate to a more normal, almost neutral level. We’re far from neutral now. And, we do plan, assuming the economy moves along the lines we expect, to start the process of dialing back restrictions.”16
Consumer price index (CPI) reports in 2024 have exceeded expectations so far. The January CPI print surpassed the expected 2.9% level, reaching 3.1% year-over-year. The February CPI print rose to 3.2% year-over-year, and the March print climbed even higher, to 3.5%.17 After these higher-than-expected CPI reports, market expectations for interest rate cuts in 2024 shifted significantly over the quarter. In early January, markets expected six to seven rate cuts; however, this fell to three anticipated cuts by the end of March, which aligns more closely with the Fed’s predictions.18 Even though inflation has recently risen, the Fed’s latest economic projections, released at the March Federal Open Market Committee (FOMC) meeting, indicate that the Fed expects faster economic growth, lower unemployment, and, notably, an increase in core personal consumption expenditures (PCE) inflation to 2.6% in 2024, up from the 2.4% projection in December.19 Although Fed Chair Powell has consistently signaled the possibility of imminent rate cuts, market expectations for the timing of the first rate cut shifted throughout the quarter, moving from March to July. In his post-FOMC press conference, Powell made several remarks that suggested the Fed’s openness to reduce rates even with inflation above the 2% target:
“We believe our policy rate is likely at its peak for this tightening cycle… The January CPI numbers were quite high; the February number was high. But I take the two of them together and I think they haven’t really changed the overall story.”20
Earlier in the month, on March 1, Fed Governor Waller, in a speech at the 2024 U.S. Monetary Policy Forum, hinted that, due to declining excess reserves, the Fed may be forced to start tapering quantitative tightening—which was confirmed at the Fed’s March 20 FOMC meeting.20 Powell stated in the post-FOMC press conference that the Fed will start to slow the pace of the balance sheet runoff “fairly soon,” but gave no further details.21 Quantitative tightening serves as a critical complement to rate hikes and has thus far removed a significant amount of liquidity from U.S. markets. Further, the reverse repurchase facility (an unusual source of liquidity during the current rate hiking cycle) was depleted by $424.1 billion over the quarter, to $594.4 billion. At this rate, it is on track to empty out by June, which may be the Fed’s new justification, rather than inflation, to end quantitative tightening.
Markets
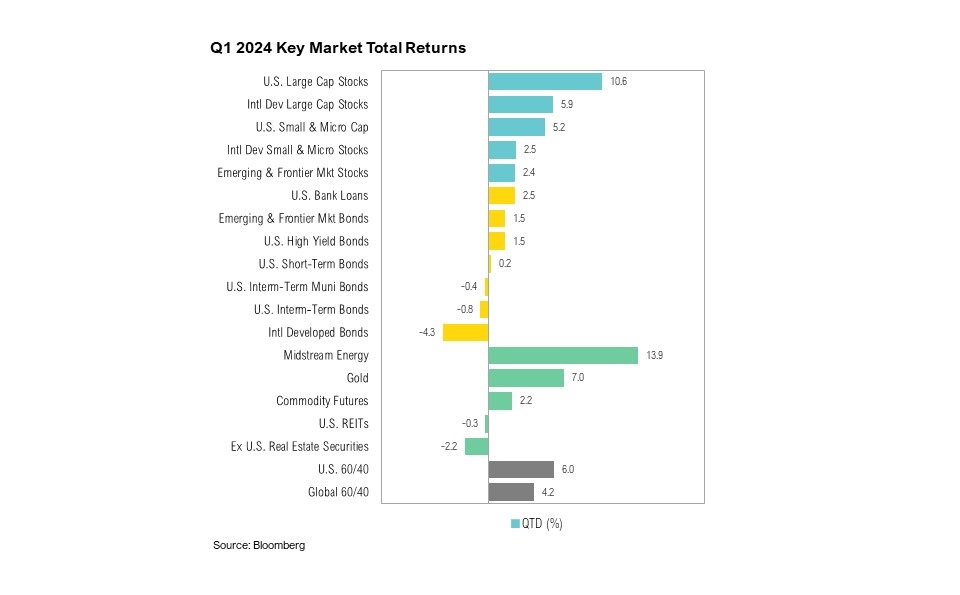
Both U.S. and international equity markets ended the quarter on a strong note, though U.S. markets outperformed their international counterparts. The S&P 500 ended the quarter up a very respectable 10.6%, while the MSCI EAFE ended the quarter up 5.9%. U.S. small cap stocks fared well, gaining 5.2% over the quarter. It was a slow start to the year for fixed income markets, as investors continued to wait for potential interest rate cuts. The Bloomberg U.S. Aggregate Bond Index closed the quarter down 0.8%. International developed market bonds fared worse, ending the quarter down 4.3%.
There was a notable performance divergence within S&P 500 sectors over the quarter. Real estate, which is particularly sensitive to interest rates, fared worst (down 0.5%), while the second-worst performing sector, utilities, gained a solid 4.6%. Communication services was the top-performing S&P 500 sector over the first quarter of 2024, gaining 15.8%.
Gold, which ended the quarter up 7%, hit a new all-time high on March 3 and ended the month at another new all-time high, reaching $2,200 per ounce for the first time due to persistent central bank buying and gradually improving investor sentiment.22 West Texas Intermediate (WTI) crude prices also climbed higher over the quarter on ongoing geopolitical tensions, breaking $80 per barrel for the first time since November. This has led to rising gasoline prices. The national average per gallon by the end of March was $3.53, its highest price in more than a year.23 Midstream energy enjoyed a stellar opening to the year, ending the quarter up nearly 13.9%. Bitcoin also reached new all-time highs in March, hitting a record $73,135 on March 13. More than $35 billion has gone into bitcoin spot ETFs since their launch in January. Bitcoin ended the quarter up 61.3%.
Looking Forward
The Fed has maintained that it will likely cut interest rates three times this year, meaning it has acquiesced to a higher inflation target. If policymakers can contain longer-term bond yields while tolerating higher inflation, the economic backdrop could continue to support above-average equity valuations. Additional productivity gains from artificial intelligence (AI) could further fuel this support.
Although the Fed wants to cut short-term rates, longer-term rates may stay higher for longer if inflation remains elevated. Historically, tightening cycles such as this one have constrained bank lending; however, in the current climate, the relatively new and growing private credit asset class—holding nearly $2 trillion in assets—is filling the lending void left by banks. Rampant fiscal spending, which shows no signs of abating, has also become a key driver of economic growth.
Finally, the Fed may be motivated to avoid a liquidity crisis in an election year, and so it could taper bond sales and become more accommodative due to issues unrelated to economics, much like what occurred in 2018. Higher longer-term rates would continue to pressure areas such as commercial real estate, regional banks, and highly indebted smaller companies. If longer-term rates move much higher, then those headwinds could creep into other areas of the market, too. Thus, policymakers' aim and accuracy remain critical as we move toward the second half of 2024.
We continue to believe that there will be volatility in equity and fixed income markets in the coming year. The Federal Reserve remains focused on their dual mandate of ensuring lower levels of inflation while also targeting full employment. Investors are focused on when the Fed will begin cutting rates and with inflation remaining sticky, expectations for the first cut have been pushed to early summer. We continue to pay special attention to trends in earnings, as we feel earnings will be a key driver of equity returns for this year. The upcoming U.S. election and its potential effects on future fiscal policy will also be a key focus for markets in the coming months as the campaigning picks up steam.
We continue to favor both high-quality stocks and bonds, rather than being overly aggressive with opportunities in lower quality assets. Investors should be prepared for changes to the yield curve over the next 12 months. We believe that a high-quality diversified asset allocation remains the best approach to navigate uncertainty in the coming year. During uncertain times, the key to successful investing is often remaining committed to long-term investment plans.
Citations
1. BEA: https://www.bea.gov/data/gdp/gross-domestic-product
2. ISM: https://www.ismworld.org/supply-management-news-and-reports/reports/ism-report-on-business/pmi/march/
3. FactSet: https://advantage.factset.com/hubfs/Website/Resources%20Section/Research%20Desk/Earnings%20Insight/EarningsInsight_032824.pdf
4. Bloomberg: https://www.bloomberg.com/news/articles/2024-03-15/nycb-new-york-community-bank-s-stock-plunge-rescue-deal-explained
5. OECD: https://www.oecd.org/sdd/na/gdp-growth-fourth-quarter-2023-oecd.htm
6. Federal Reserve: https://www.federalreserve.gov/releases/g19/current/
7. FRED: https://fred.stlouisfed.org/series/PSAVERT
8. BLS: https://www.bls.gov/news.release/empsit.nr0.htm
9. Reuters: https://www.reuters.com/markets/us/us-inflation-increases-moderately-february-consumer-spending-surges-2024-03-29/
10. Reuters: https://www.reuters.com/markets/us/us-consumer-sentiment-tops-estimates-march-hit-nearly-3-yr-high-umich-says-2024-03-28/
11. University of Michigan: https://news.umich.edu/sentiment-holds-steady-amid-confidence-in-slowing-inflation/
12. The Transcript via SubStack: https://thetranscript.substack.com/p/03-04-2024-in-good-shape-free
13. BloombergTV: https://youtube.com/watch?v=DRDqzG8jwzc
14. U.S. Treasury: https://www.fiscal.treasury.gov/files/reports-statements/mts/mts0324.pdf
15. MarketWatch: https://www.marketwatch.com/story/u-s-budget-deficit-tops-1-trillion-halfway-through-fiscal-year-ea33ae6f
16. CNBCTV: https://www.youtube.com/watch?v=8N2wKUHaB28
17. BLS: https://www.bls.gov/cpi/
18. CMEFedWatch: https://www.cmegroup.com/markets/interest-rates/cme-fedwatch-tool.html
19. Federal Reserve: https://www.federalreserve.gov/monetarypolicy/files/fomcprojtabl20240320.pdf
20. Federal Reserve: https://www.federalreserve.gov/newsevents/speech/waller20240301a.htm
21. Federal Reserve: https://www.federalreserve.gov/mediacenter/files/FOMCpresconf20240320.pdf
22. Wall Street Journal: https://www.wsj.com/economy/central-banking/gold-hits-fresh-highs-as-central-banks-ramp-up-purchases-7149ae68
23. AAA: https://gasprices.aaa.com/
Index Definitions
The S&P 500 Index is widely regarded as the best single gauge of the United States equity market. It includes 500 leading companies in leading industries of the U.S. economy. The S&P 500 focuses on the large cap segment of the market and covers approximately 75% of U.S. equities.
The Bloomberg Barclays U.S. Aggregate Index represents securities that are SEC-registered, taxable, and dollar denominated. The index covers the U.S. investment grade fixed rate bond market, with index components for government and corporate securities, mortgage pass-through securities, and asset-backed securities. Duration is roughly 5 years.
The Bloomberg U.S. Corporate High Yield Bond Index measures the USD-denominated, high yield, fixed-rate corporate bond market. Securities are classified as high yield if the middle rating of Moody’s, Fitch and S&P is Ba1/BB+/BB+ or below. Bonds from issuers with an emerging markets country of risk, based on the indices’ EM country definition, are excluded.
The Russell 1000® Value Index measures the performance of the large-cap value segment of the U.S. equity universe. It includes those Russell 1000 companies with lower price-to-book ratios and lower expected and historical growth rates.
The Russell 1000® Growth Index measures the performance of the large- cap growth segment of the US equity universe. It includes those Russell 1000 companies with relatively higher price-to-book ratios, higher I/B/E/S forecast medium term (2 year) growth and higher sales per share historical growth (5 years).
The Russell 2000® Index measures the performance of the small-cap segment of the US equity universe. It includes approximately 2000 of the smallest US equity securities in the Russell 3000 Index based on a combination of market capitalization and current index membership. The Russell 2000 Index represents approximately 10% of the total market capitalization of the Russell 3000 Index. Because the Russell 2000 serves as a proxy for lower quality, small cap stocks, it provides an appropriate benchmark for RMB Special Situations.
MSCI EAFE Index*: an equity index which captures large and mid-cap representation across 21 of 23 Developed Markets countries around the world, excluding the U.S. and Canada. With 926 constituents, the index covers approximately 85% of the free float-adjusted market capitalization in each country.
The MSCI Emerging Markets Index* measures equity market performance in the global emerging markets universe. It covers over 2,700 securities in 21 markets that are currently classified as EM countries. The MSCI EM Index universe spans large, mid and small cap securities and can be segmented across all styles and sectors.
The U.S. Dollar Index is used to measure the value of the dollar against a basket of six foreign currencies: the euro, Swiss franc, Japanese yen, Canadian dollar, British pound, and Swedish krona.
The Deutsche Bank EM FX Equally Weighted Spot Index, an equal-weighted basket of 21 emerging market currencies.
MSCI U.S. REIT Index is a free float-adjusted market capitalization weighted index that is comprised of equity Real Estate Investment Trusts (REITs). The index is based on the MSCI USA Investable Market Index (IMI), its parent index, which captures the large, mid and small cap segments of the USA market. With 150 constituents, it represents about 99% of the US REIT universe and securities are classified under the Equity REITs Industry (under the Real Estate Sector) according to the Global Industry Classification Standard (GICS®), have core real estate exposure (i.e., only selected Specialized REITs are eligible) and carry REIT tax status.
*Source: MSCI.MSCI makes no express or implied warranties or representations and shall have no liability whatsoever with respect to any MSCI data contained herein. The MSCI data may not be further redistributed or used as a basis for other indexes or any securities or financial products. This report is not approved, endorsed, reviewed or produced by MSCI. None of the MSCI data is intended to constitute investment advice or a recommendation to make (or refrain from making) any kind of investment decision and may not be relied on as such.
Performance Disclosures
All market pricing and performance data from Bloomberg, unless otherwise cited. Asset class and sector performance are gross of fees unless otherwise indicated.
The opinions and analyses expressed in this newsletter are based on Curi RMB Capital, LLC’s (“Curi RMB”) research and professional experience are expressed as of the date of our mailing of this newsletter. Certain information expressed represents an assessment at a specific point in time and is not intended to be a forecast or guarantee of future results, nor is it intended to speak to any future time periods. Curi RMB makes no warranty or representation, express or implied, nor does Curi RMB accept any liability, with respect to the information and data set forth herein, and Curi RMB specifically disclaims any duty to update any of the information and data contained in this newsletter. The information and data in this newsletter does not constitute legal, tax, accounting, investment or other professional advice. Returns are presented net of fees. An investment cannot be made directly in an index. The index data assumes reinvestment of all income and does not bear fees, taxes, or transaction costs. The investment strategy and types of securities held by the comparison index may be substantially different from the investment strategy and types of securities held by your account. RMB Asset Management is a division of Curi RMB Capital.