
Summary
- As a result of increased government spending and lower tax revenues, the U.S. is currently seeing a staggering increase in its national debt, leading to a massive jump in bond issuance.
- On July 31, Treasury announced that it had boosted its third-quarter borrowing estimate to just over $1 trillion, up from a previous estimate of $733 billion. This is the second largest quarterly borrowing on record, outdone only by the $3 trillion borrowed in Q2 2020 in the midst of the pandemic.
- The next day, on August 1, ratings agency Fitch downgraded the U.S. from AAA to AA+, citing concerns of fiscal governance and a growing government debt burden.
- While higher debt levels negatively impact long-term growth, the investment implications of headline-grabbing situations like these are often counterintuitive as bond market pricing generally already reflects all the bad news.
- The recent rise in yields and negative sentiment in bonds suggests it is time to normalize or extend duration, but the coming surge in supply may limit the impact of a cyclical rally in rates.
- Notwithstanding all the fiscal hurdles, the cyclical nature of interest rates should not be ignored – there are often short-term cycles within long-term cycles. Most important in the context of the near-term is Federal Reserve policy.
- We believe it is prudent to start positioning for a normalization (i.e. steepening) of the Treasury yield curve.
Prologue: Debt Matters
The U.S. consistently spends more money than its tax revenue can cover, a gap that has been progressively widening. This trend has resulted in a notable surge in the nation’s debt in relation to its Gross Domestic Product (GDP), leading to a parallel increase in the cost of managing this debt. Channeling capital into debt servicing diverts it from potentially productive purposes towards an indubitably unproductive one, hurting economic growth in the future. This fiscal logic holds true for a household, a small enterprise, a global corporation, a city, a state, and, contrary to some recent media reports, a sovereign nation.
World Bank data suggests that any increase of 1% in a country’s public debt-to-GDP ratio beyond a threshold of 77% results in a dip in real growth by 0.02%. 1 For the U.S., this suggests an anticipated GDP growth handicap of roughly -0.9% annually. This correlation between current debt and future growth is further supported by studies conducted by Reinhard and Rogoff (2010), Kumar and Jaejoon (2010), Cecchetti, Mohanty and Zampolli (2011), among others. 2,3,4 These studies collectively suggest that once a country’s debt-to-GDP ratio hits a certain high, growth prospects are compromised (the precise threshold varies per study, but typically falls between 75% and 100% of GDP).
Crucially, once these threshold levels are breached, the negative effects on growth are non-linear—they are disproportionately exacerbated as debt levels rise. In the U.S. context, a 0.9% growth impediment amounts to nearly 30% of the average growth rate since 1947 and almost half (45%) of the trend growth rate since 2000. 5
However, it is important to note that while debt plays a significant role in shaping long-term economic growth, its impact is considerably less pronounced in the short term, where other factors hold more sway. Therefore, while the issue of debt is indeed important, its immediate effects may not be as palpable. Moreover, while this note addresses some of the obvious problems inherent in the U.S. fiscal landscape, the investment implications stemming from headline-grabbing situations like these are often paradoxical.
Markets are forward looking, and as such, the fiscal challenges we are currently discussing may be fully accounted for in existing bond prices (and inversely, their yields). This, coupled with the observation that prevailing market sentiment towards bonds seem broadly bearish as well as other cyclical factors, suggests we may be nearing a point where it is appropriate to normalize or even extend bond duration.
Ceilings and Borrowings and Downgrades, Oh My!
The U.S. has been grappling with fiscal challenges for years, but the situation has deteriorated noticeably over the last several quarters. Recall, the U.S. reached its debt ceiling on January 26, with expenses consistently outpacing revenues. The debt ceiling was recently suspended until 2025 after prolonged negotiations between President Biden and House Speaker McCarthy, paving the way for more deficit spending. The deficit now stands at around $1.4 trillion, a whopping 170% increase from last year. 6 Due to the prolonged debt ceiling debate, Treasury is now in the midst of a game of ‘catch up’, with a staggering $1.85 trillion of issuance expected in the second half of the year. Since the debt ceiling resolution, Treasury has issued approximately $800 billion in mostly short-term bills that mature in less than a year (at what will likely be substantially higher costs). It is not clear why Treasury has opted to focus issuance on short-term bills given the shape of the yield curve, but regardless of the reasoning, they will need to start issuing longer-term securities to maintain the balance between long and short securities.
The jump in borrowing estimates is attributed to anticipated lower revenues and increased outlays. Treasury’s Fiscal Year 2023 Q3 Report highlights some challenges. Tax receipts in the April-May period were 40% lower than last year’s record level, declining by $282 billion. 7 A contributing factor for this is deferred tax payments for California, due to storms and flooding earlier this year. California accounts for nearly 15% of all U.S. personal taxes paid, and even more for corporate taxes.
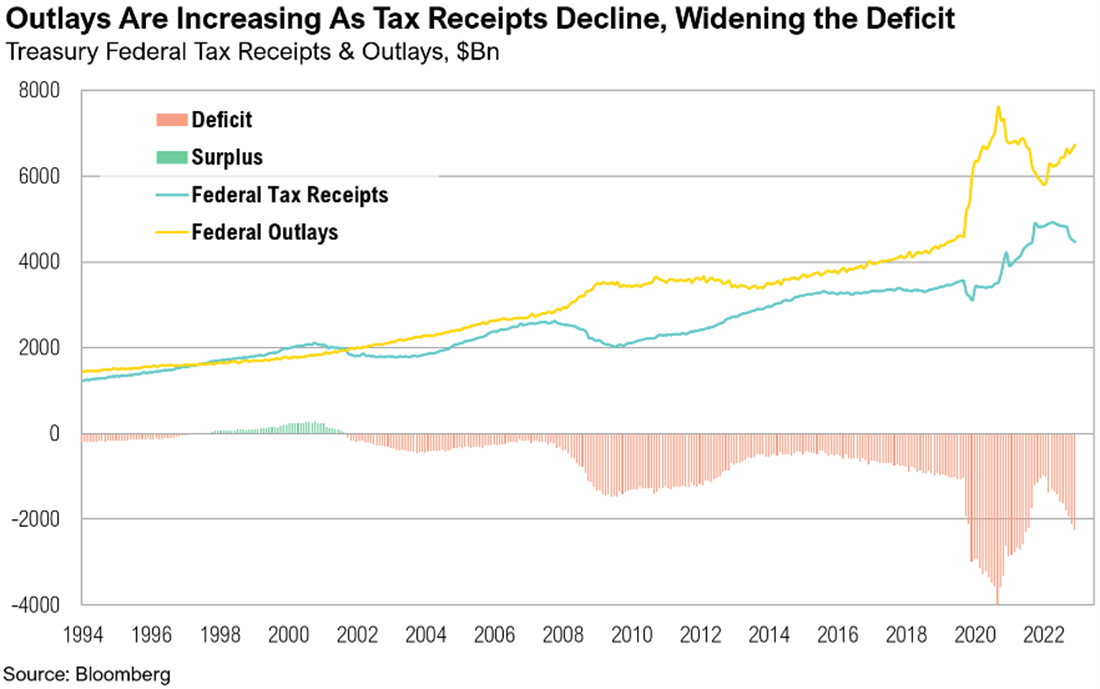
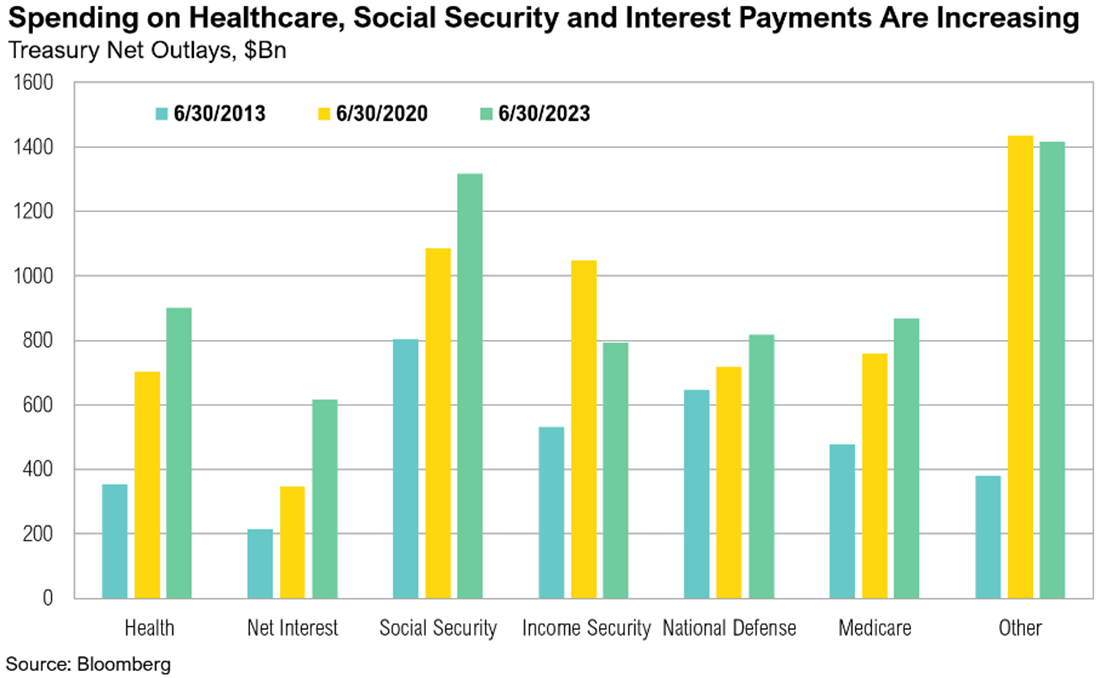
Furthermore, this year’s 8.7% Social Security cost of living adjustment (compared to 5.7% in 2022), an increasing number of social security beneficiaries, and higher Medicare costs are attributed as the largest outlays, together accounting for $181 billion in additional spending compared to a year ago.7 Interest on public debt is $131 billion (25%) higher, and FDIC outlays are $52 billion higher compared to a year ago. 7
Excluding the $4 trillion borrowed in 2020 for the pandemic response, 2023’s expected $2.7 trillion issuance will set a record.
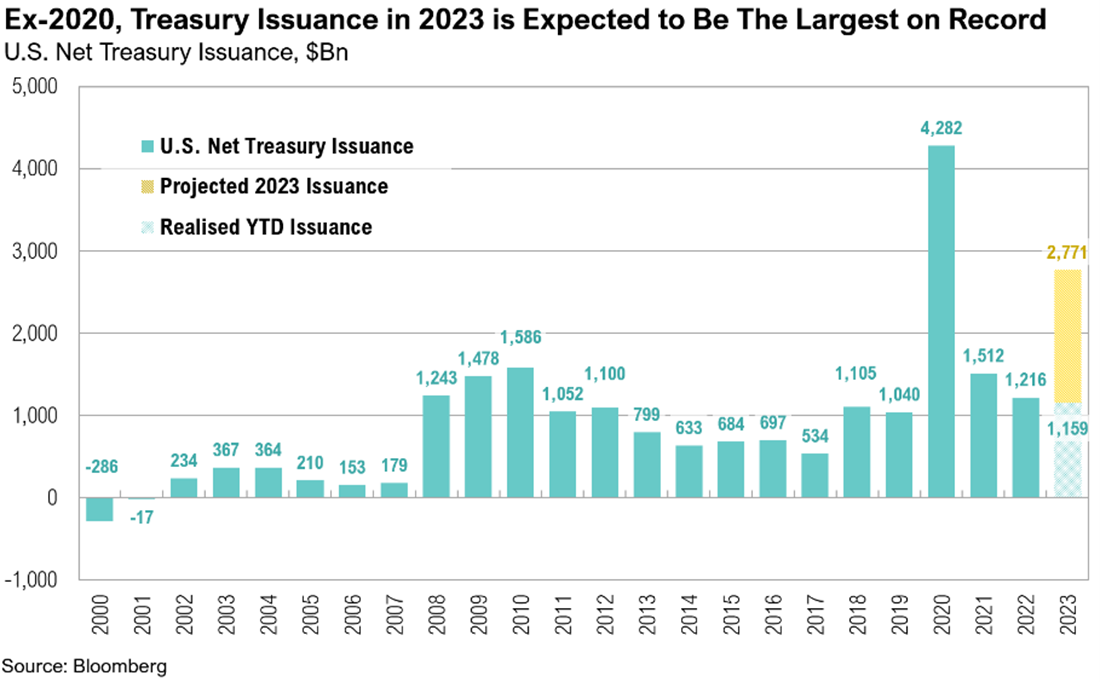
On 31 July, Treasury announced that it had boosted its third-quarter borrowing estimate to slightly over $1 trillion, up from a previous estimate of $733 billion. 8 The next day, on August 1, ratings agency Fitch downgraded the U.S.’s credit status from AAA to AA+ due to escalating concerns about the nation’s debt and fiscal health. 9 This marks the second downgrade of the U.S.’s credit rating by a major ratings agency.
Previously, in 2011, Standard & Poor’s (S&P) reduced the U.S. rating from AAA to AA+ in the aftermath of a debt ceiling standoff that was very similar to the one just resolved. 10 Currently, Moody’s remains the sole major ratings agency upholding a AAA rating for the U.S.
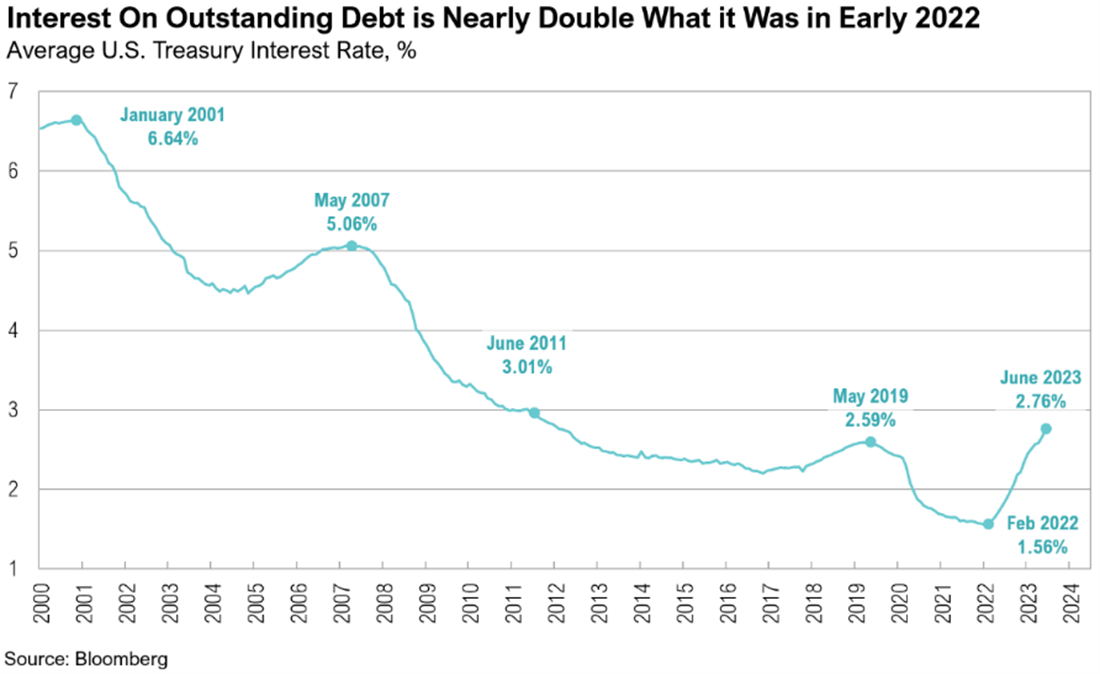
Rising interest rates are exacerbating the deficit. Short-term (three-month) Treasury yields have risen from nearly 0% in January 2022 to approximately 5.3% as of August 4. Five-year Treasury yields are up to around 4.1%, compared to 1.4% last January. The current average cost of the national debt has jumped to 2.8% from 1.6% a year ago.
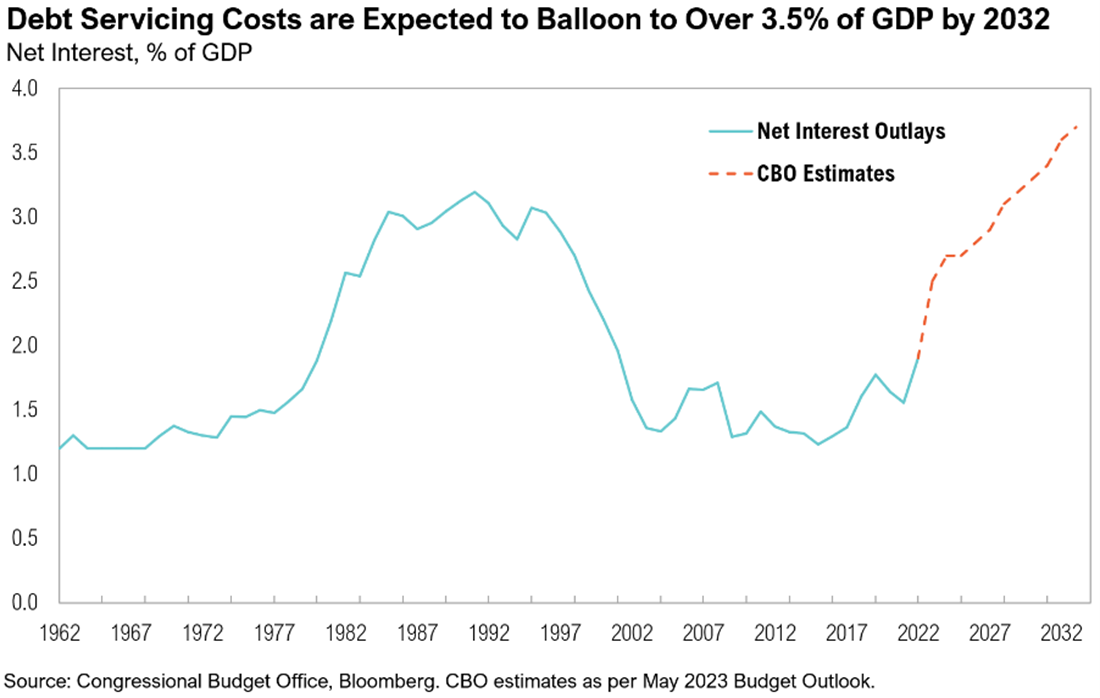
With the cost of servicing debt increasing, the U.S. government’s debt payments soared to $850 billion in June, a 42% rise year-on-year. If bond yields persist, these costs will escalate further. In the CBO’s latest budget outlook, net interest outlays have been revised higher, with debt servicing costs expected to balloon to over 3.5% of GDP within the next 10 years. 11
In 2020, U.S. pandemic-related spending surged, leading to a debt-to-GDP ratio peak of 134.8% by June of that year. 11 This ratio has since decreased but remains high at around 123% (as of June 30). 12
Under President Biden, major programs such as the American Families Plan (2021), the Inflation Reduction Act (IRA) and the CHIPS and Science Act of 2022 have been rolled out, with proposed collective outlays of over $1 trillion, $400 billion, and $300 billion, respectively. 13,14 Further, those numbers may understate the final cost of these programs. According to the Penn Wharton Budget Model, due to the way instructions were written, the cost of the IRA is running three times greater than the amount appropriated by Congress. 15
The U.S. economy grew by 2.4% in the second quarter, with government spending attributed as one of the key drivers. It is unclear precisely how much of the pledged funds for these programs still need to be spent. It is also not clear that continued deficit spending will be accretive to real economic growth. In fact, estimates from studies on the topic suggest that fiscal multipliers for highly-indebted developed economies are initially positive (for the first four to six quarters), but then turn negative after three years, potentially sharply. 13,14 While we will likely have positive initial benefits from recent programs, the lagged negative multiplier of the colossal pandemic-related deficits may start to offset some, or all, of this benefit. The bottom line is we simply do not know what the net impact will be, especially in the short term.
Market Reaction
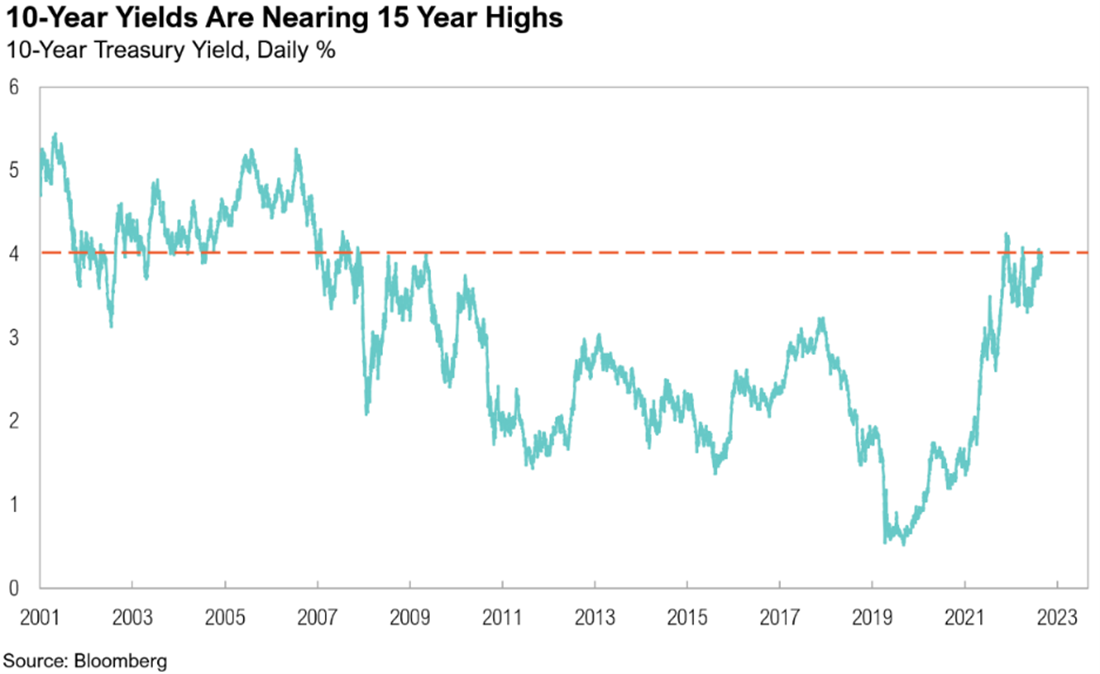
Following the S&P downgrade in 2011, and perhaps counterintuitively, Treasury yields dropped (bond prices rallied) as anxious markets turned to U.S. bonds as a safe haven. However, post the Fitch announcement, we’ve seen a stark rise in yields. We believe this is more due to Treasury’s borrowing guidance announcement than the Fitch announcement per se, but the two are related. Notably, 10-year Treasury yields have climbed above 4%, a level not seen since last November. 10-year Treasury yields have not consistently stayed above the 4% mark since 2007.
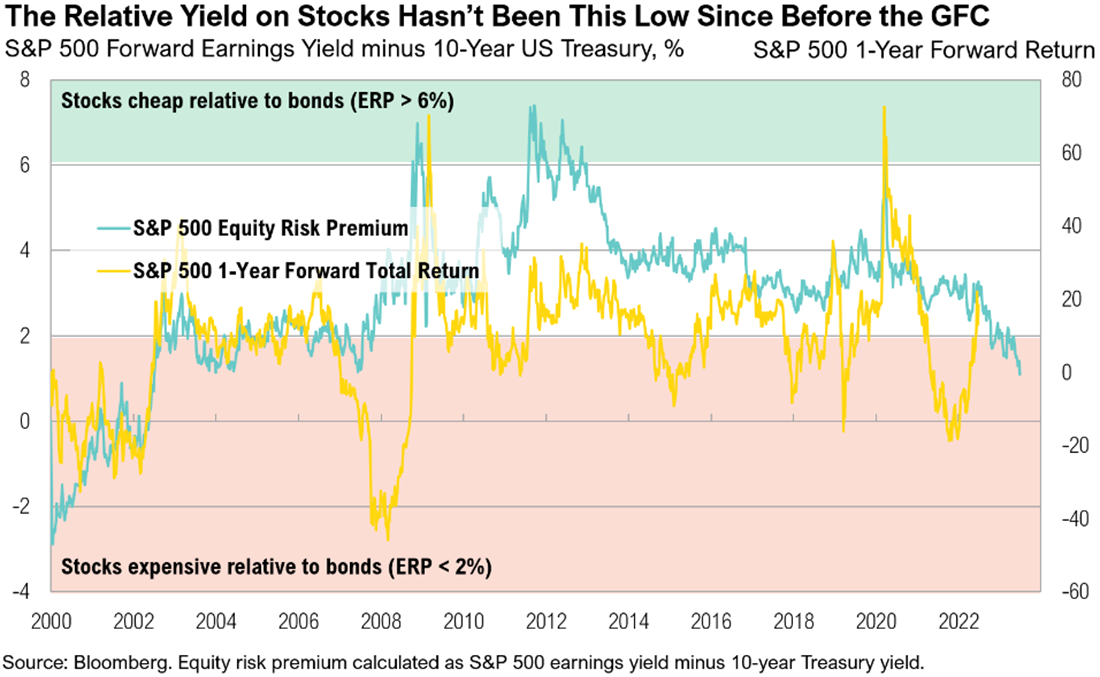
The jump in yields has implications for the servicing costs of the government debt, which were already climbing. Further, the increase in interest rates creates competition for other asset classes, all else equal. Forward earnings yields, which are the inverse of price-to-earnings multiples, are around 20% higher than they were last November. The chart below shows the relationship between Treasury yields and S&P 500 earnings yields for the last two decades and shows the dramatic improvement in the relative attractiveness of bonds this year.
Cyclicality Matters
Notwithstanding all the fiscal hurdles, the cyclical nature of interest rates should not be ignored. The challenges mentioned herein are significant and will weigh on the cost of debt longer-term; however, nothing moves in a straight line. As such, there are short-term cycles within long-term cycles. Most important in the context of the near-term is Federal Reserve policy.
The U.S. Treasury yield cycle is reasonably correlated to the Target Fed Funds rate cycle. Historically, the yield curve ebbs and flows in conjunction with Fed policy. Below are historical 3-month, 5-year and 10-year U.S. Treasury yields relative to Target Fed Funds. The positive correlation is obvious. In addition, eight of the last ten tightening cycles have ultimately led to a recession and subsequent Federal Funds rate decreases. Moreover, after every tightening cycle, yields declined overall. As we may be in the last stages of a Fed Policy tightening cycle, this cyclical behavior must be considered.
Long Term Rates
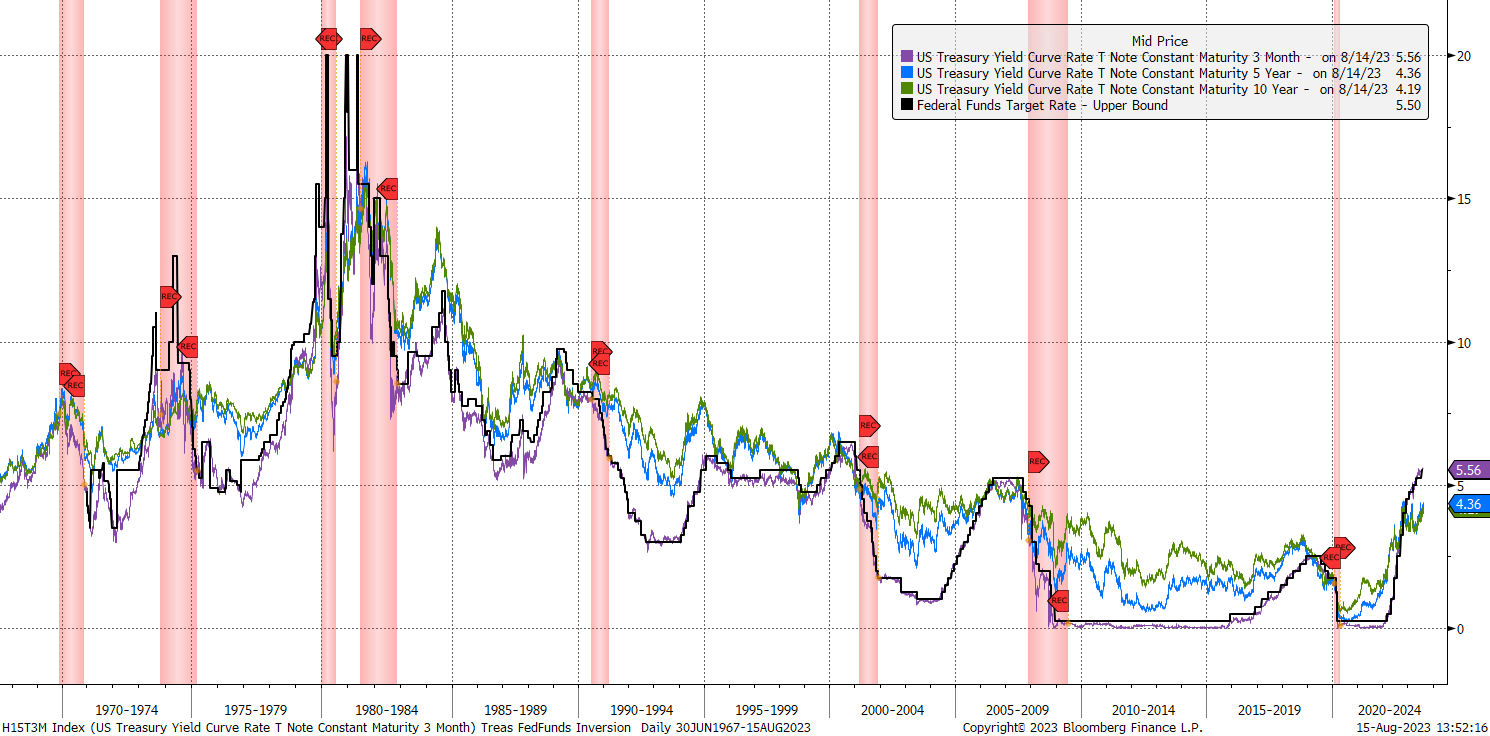
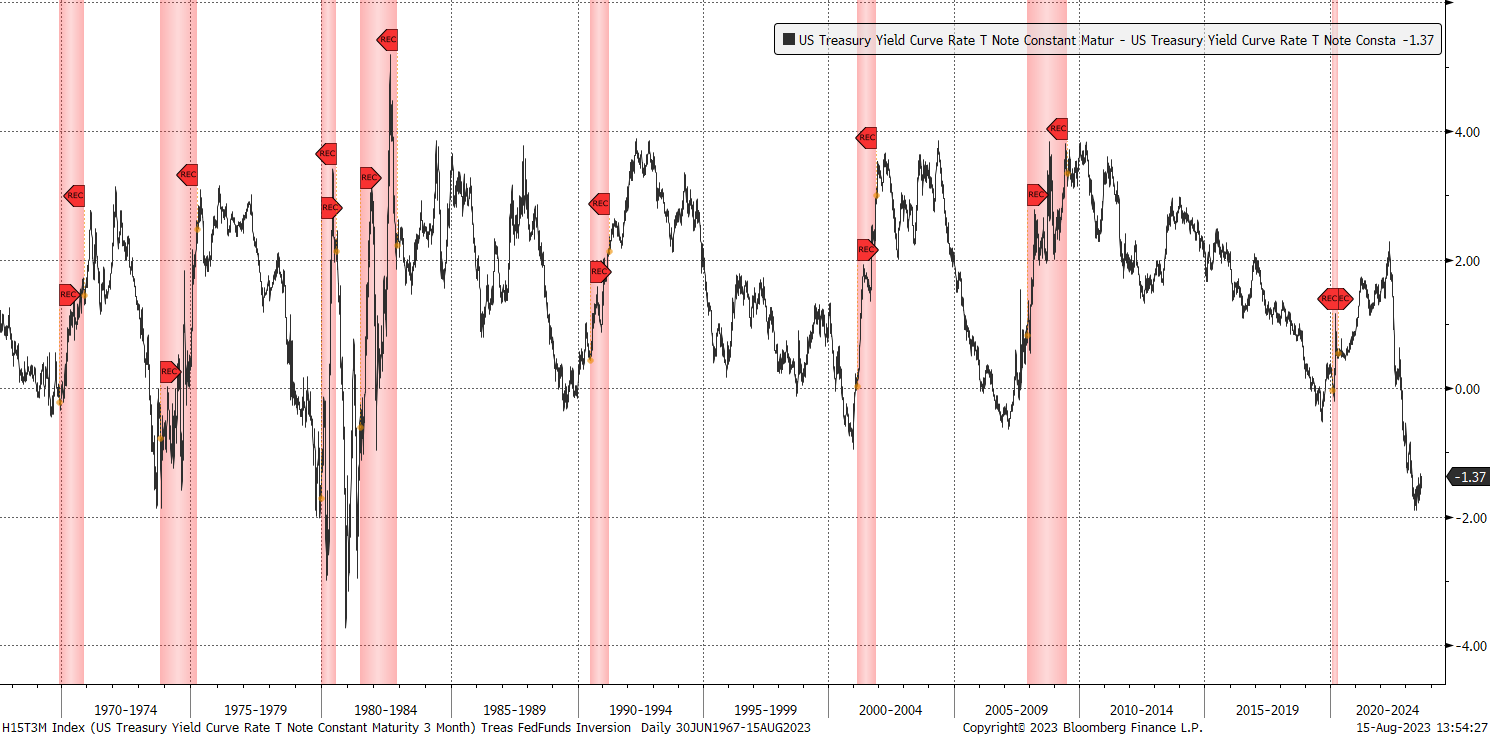
To add further, in each of the eight recessions shown, an inversion of the yield curve (10-year minus 3-month yield) occurred. Fed policy reversed not long after the inversion bottomed out. Presently, the yield curve is significantly inverted and may have just bottomed out. The odds of eventual corrective action by the Federal Reserve and yields subsequently declining are increasing.
Historical Yield Curve Inversions
Recommendation
Sentiment being overly negative and a contrary indicator plus the cyclical factors mentioned, suggest normalizing duration exposure and possibly extending exposure are warranted. However, the coming surge in supply in the next few months remains concerning, as does the rising debt liability. While slowing economic growth, inflation, and stock market fluctuations can easily boost demand for bonds, if these factors don’t come into play, we may continue to see higher yields longer-term. Regardless of the growth trajectory, we believe it’s prudent to begin positioning for a change in slope of yield curve based on sentiment and the current phase of the interest rate cycle.
- World Bank: https://documents1.worldbank.org/curated/en/509771468337915456/pdf/WPS5391.pdf
- Reinhart and Rogoff: https://scholar.harvard.edu/files/rogoff/files/growth_in_time_debt_aer.pdf
- Kumar and Woo: https://www.imf.org/external/pubs/ft/wp/2010/wp10174.pdf
- Cecchetti, Mohanty and Zampolli: https://www.bis.org/publ/work352.pdf
- Trading Economics: https://tradingeconomics.com/united-states/gdp-growth
- Bloomberg: https://www.bloomberg.com/news/articles/2023-07-13/us-racks-up-652-billion-in-interest-costs-as-higher-rates-bite#xj4y7vzkg
- Treasury: https://home.treasury.gov/system/files/221/TreasuryPresentationToTBACQ32023.pdf
- Treasury: https://home.treasury.gov/news/press-releases/jy1662
- Fitch: https://www.fitchratings.com/research/sovereigns/fitch-downgrades-united-states-long-term-ratings-to-aa-from-aaa-outlook-stable-01-08-2023
- Financial Times: https://www.ft.com/content/d8a02284-fedb-4146-af87-176650982358
- CBO: https://www.cbo.gov/publication/59159
- CEIC: https://www.ceicdata.com/en/indicator/united-states/government-debt–of-nominal-gdp
- New York Times: https://www.nytimes.com/2021/04/28/us/politics/biden-american-families-plan.html
- McKinsey: https://www.mckinsey.com/industries/public-sector/our-insights/the-chips-and-science-act-heres-whats-in-it
- Penn Wharton: https://budgetmodel.wharton.upenn.edu/estimates/2023/4/27/update-cost-climate-and-energy-inflation-reduction-act
Index Definitions
The S&P 500 Index is widely regarded as the best single gauge of the United States equity market. It includes 500 leading companies in leading industries of the U.S. economy. The S&P 500 focuses on the large cap segment of the market and covers approximately 75% of U.S. equities.
FDTR Index: Federal Funds Target Rate – Upper Bound, data is the short-term interest rate targeted by the Federal Reserve’s Federal Open Market Committee (FOMC) as part of its monetary policy.
H15T3M Index: U.S. Treasury Yield Curve Rate Treasury Note Constant Maturity 3 Month
H15T5Y Index: U.S. Treasury Yield Curve Rate Treasury Note Constant Maturity 5 Year
H15T10Y Index: U.S. Treasury Yield Curve Rate Treasury Note Constant Maturity 10 Year
Disclaimers
Performance Disclosures
All market pricing and performance data from Bloomberg, unless otherwise cited. Asset class and sector performance are gross of fees unless otherwise indicated.
The opinions and analyses expressed in this newsletter are based on RMB Capital Management, LLC’s (“RMB Capital”) research and professional experience are expressed as of the date of our mailing of this newsletter. Certain information expressed represents an assessment at a specific point in time and is not intended to be a forecast or guarantee of future results, nor is it intended to speak to any future time periods. RMB Capital makes no warranty or representation, express or implied, nor does RMB Capital accept any liability, with respect to the information and data set forth herein, and RMB Capital specifically disclaims any duty to update any of the information and data contained in this newsletter. The information and data in this newsletter does not constitute legal, tax, accounting, investment or other professional advice. Returns are presented net of fees. An investment cannot be made directly in an index. The index data assumes reinvestment of all income and does not bear fees, taxes, or transaction costs. The investment strategy and types of securities held by the comparison index may be substantially different from the investment strategy and types of securities held by your account. RMB Asset Management is a division of RMB Capital Management.