Key Takeaways
-
First quarter of 2023 started off with a bang. As we have stated in previous commentaries, we believe there will be continued volatility in both equity and fixed income markets throughout 2023, as the Federal Reserve continues to focus on managing two crucial mandates simultaneously — price stability and financial stability.
-
In the face of continued historic inflation and negative wage growth, U.S. consumers may feel increased pressures on their spending – a potential threat to the country’s consumer-driven economy.
-
Could a recession be in the near future? Two historical indicators, an inverted Treasury yield curve and the Leading Economic Index (LEI), suggest yes.
-
At RMB, we continue to believe that strong fundamentals should help markets over the longer term and that the income component of our client’s investment portfolios – the interest paid from owning bonds and stock dividends – will be a more important factor of investment returns going forward. While we think that the longer-term outlook will continue to improve as yields rise and stocks get cheaper, we would caution that 2023 could be another challenging year for investors. We recommend sticking to long-term investment allocation targets through a diversified portfolio of assets that emphasizes quality and cash flow and taking advantage of rebalancing opportunities as they emerge amongst the volatility.
Overview
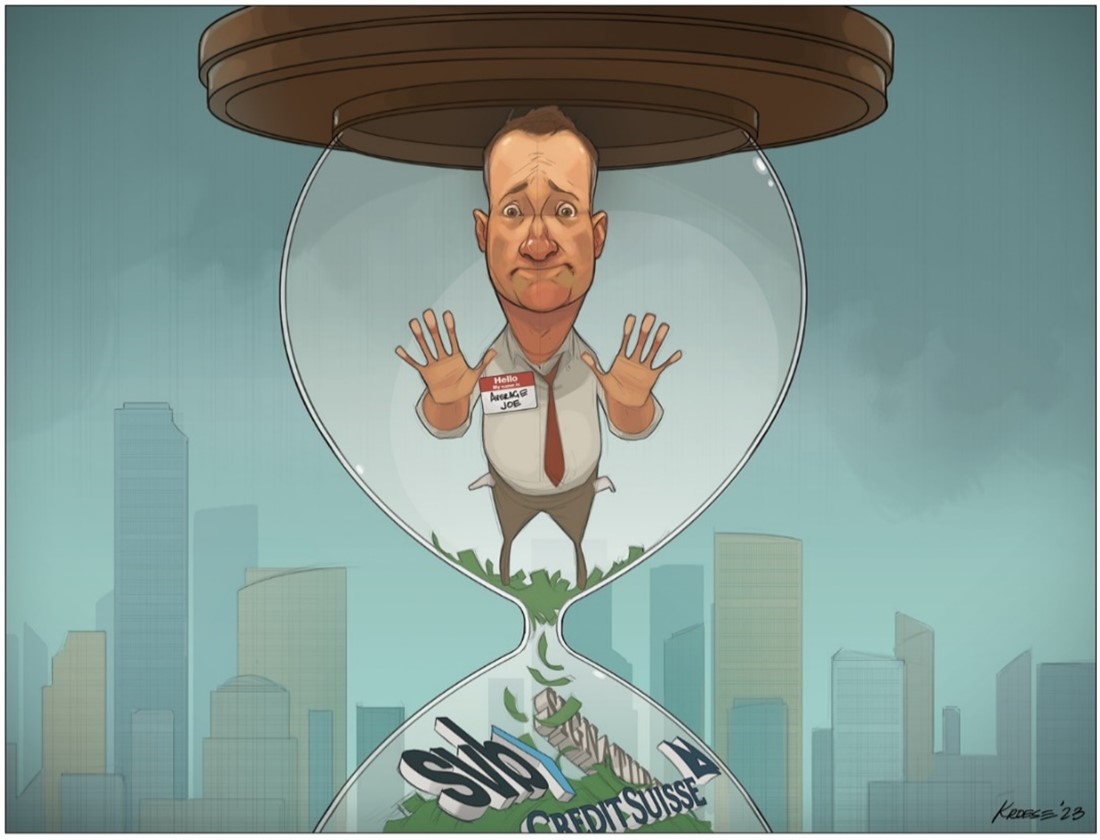
It certainly hasn’t been a quiet start to the year. Markets started 2023 on a strong note. Both stocks and bonds ended January with decidedly positive returns. However, since then, things have taken a turn for the interesting. In February, most of the gains that stocks and bonds had made since the start of the year were wiped out. In fact, February was the fifth-worst monthly decline for bonds since 1993. Onto the third month of the quarter—March madness indeed. On March 10, Silicon Valley Bank (SVB), the 16th-largest bank in the U.S., collapsed, marking the second-largest bank failure in U.S. history. Two days later, Signature Bank, the 29th-largest U.S. bank, shuttered, as customers rushed to withdraw deposits.1 The speed at which these banks collapsed was unprecedented—a point captured well in a comment from Morgan Stanley CEO James Gorman:
“… with the click of an iPhone, $42 billion left one bank in one day. To give you a sense of the order of magnitude, in the financial crisis of ’08, one bank lost $17 billion in a week, so the rate of withdrawal was 20 times what it was then.”2
These sentiments were echoed by Federal Reserve Chairman Jerome Powell: “The question we were all asking ourselves over that first weekend was, ‘How did this happen?’”3
It happened partly because banks were not offering competitive deposit rates relative to short-term U.S. Treasury rates. As a result, depositors started shifting their money out of bank deposits and into Treasuries while the value of many banks’ assets were declining (also due to higher interest rates). Large banks typically have enough reserves to withstand these shifts, but smaller and more specialized banks struggled to cope with such large drops in their deposit levels, especially at a time when their investments were simultaneously sputtering. Even with these industry-wide headwinds, the largest culprit—at least in the case of SVB—was poor risk management.4
In response to the collapse of SVB and the subsequent closure of Signature Bank, the Federal Reserve eased access to its discount window, and banks were able to borrow more than $152 billion from the Fed between March 11 and March 15. The last time banks made extensive use of the discount window was during the Global Financial Crisis, when approximately $111 billion was borrowed at its peak. Following the recent instability in the U.S. financial system, the Fed created a new emergency loan facility, called the Bank Term Funding Program (BTFP). BTFP enables banks to take out loans for up to a year, secured by government bonds, with any collateral valued at par value rather than market prices.5 This program is designed to provide banks with the necessary liquidity to accommodate deposit withdrawals, which have occurred at an epic pace due to the significant yield differential between what banks are offering as deposit rates and what can be earned by investing in U.S. Treasury Bills.5 Notably, the average interest earned on a savings account is 0.24%, while a three-month T-bill is at 4.77%.6,7 Throughout March, deposit withdrawals from commercial domestic banks totaled almost $400 billion while a similar $367 billion flowed into Treasury money markets.8
March 17 marked the one-year anniversary of the Fed’s first rate hike of the current hiking cycle. Although it is slowly easing, inflation remains well above the Fed’s 2% target. Throughout the past quarter, a strong labor market and robust spending rates continued to thwart the Fed’s efforts to slow the economy enough to get inflation under control. To date, there are few signs that the labor market is easing. The unemployment rate has remained steady at 3.5%.9 Until recently, it was relatively easy for the Fed to react quickly to stresses in the economy or banking system since inflation had been historically low for decades. For instance, by the time that Bear Stearns collapsed in March 2008, the Fed had already lowered interest rates from 5.25% in August 2007 to 3.0% in March 2008.10 But times have changed. Just days after the recent bank collapses, on March 22, the Federal Reserve once again hiked interest rates (this time by 25 basis points to 5.0%) while it maintained its pace of quantitative tightening. This most recent rate hike, which happened despite signs that higher interest rates were starting to destabilize key parts of the economy, highlights the policy predicament that the Fed has put itself in. By waiting too long to address inflation, which started spiking in early 2022, the Fed must now manage two crucial mandates simultaneously — price stability and financial stability.
Tick Tock
Another threat that is emerging more slowly, yet inexorably and potentially more significantly, is the U.S. consumer may be running out of spending dollars. This is significant because the U.S. is a consumer-driven economy. In fact, consumer spending accounts for more than 67% of U.S. economic activity.11 During the height of the pandemic, government stimulus checks helped U.S. consumers amass more than $2 trillion in excess savings. As the pandemic lifted, consumers began burning through those savings and demand skyrocketed, lifting the economy out of recession. Buoyed by stimulus checks and cheap credit, consumers continued to spend, even as inflation hit 40-year highs in June 2022. Today, the easy money that bolstered consumer spending over the past two years is dwindling, yet inflation remains stubbornly high. This combination of higher interest rates, reduced fiscal stimulus, and a nascent economic slowdown is slowly but surely depleting pandemic-era savings.
This trend is evident in changes in the U.S. savings rate. In June 2022, when inflation reached a four-decade high of 9.1%, the personal saving rate dropped to 2.7%—the lowest level since 2007. As inflation has slowly moderated, the savings rate has crept upwards to 4.6%. While a notable improvement, it still remains well below the average savings rate of 8.9% since 1959.12 Wages have also been unable to keep pace with inflation, as real wage growth has been negative since March 2021. This is the longest period of negative wage growth on record; the second-longest period was from April 2011 to June 2012. Even before the financial market turmoil caused by the collapse of SVB and Signature Bank, a key gauge for consumer sentiment in the U.S. fell for the first time in four months. The University of Michigan’s Consumer Sentiment Index for March dropped from 67 to 63.13 Data from the same survey reveals that consumers are increasingly anticipating a recession and a sharp weakening in one-year business conditions.13 Yet for now, consumers are continuing to spend. Revolving consumer credit reached an all-time high of $1.2 trillion in February, an increase of 15% year-over-year.14 Credit card delinquencies have also started to tick upwards since June 2022, and given that average credit card rates now surpass 20%, it seems likely that these delinquencies will continue.15
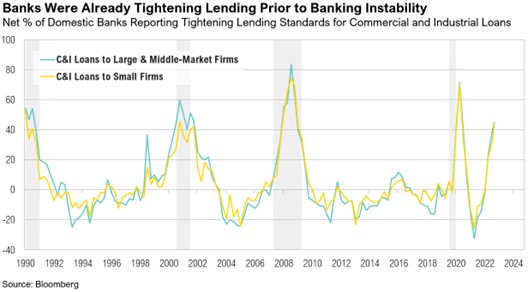
The rapid increase in credit card debt speaks to the precarious situation of the U.S. consumer. With the Fed still hiking rates and the consumer continuing to get squeezed by the higher cost of living, it seems like only a matter of time before the money will run out. Tighter lending standards may also mean that businesses will also have less access to credit. Throughout the first quarter of the year, approximately 44% of domestic banks in the U.S. tightened their lending standards for commercial and industrial loans to firms.16 The chart below shows that loan standards were tightening even before the collapse of SVB and Signature Bank. Since SVB’s collapse, loan growth has been further curtailed.17 Over the past two weeks ending March 31, commercial real estate loans from U.S. banks declined by a record $40 billion, and loans and leases declined by a record $100 billion.17 These are the largest two-week changes since 1975.
Although no one can accurately predict if and when a recession will start, leading economic indicators can offer useful insights. Over the first quarter of 2023, the Treasury yield curve—proxied by the difference in yield between the 2-year and 10-year Treasury notes—remained inverted. On average, it takes about 14 months from the initial point of inversion until a recession hits. Since 1956, an inverted yield curve has correctly predicted a recession within 14 months 90% of the time, with the only exception being in 1998, when the yield curve briefly inverted before correcting itself. At the end of March 2022, almost exactly one year ago, the yield curve inverted. We are now entering the 13th month from the initial point of inversion. If we are headed for recession, the clock is ticking.
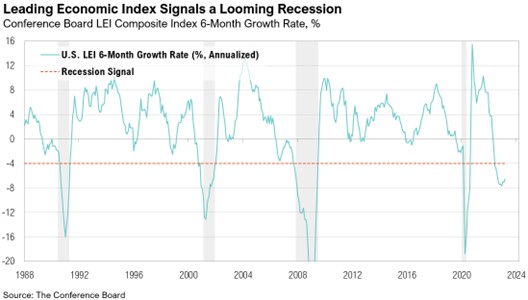
Similarly, the Conference Board’s Leading Economic Index (LEI), which is used to forecast future economic activity, has been signaling a looming recession since July 2022. A quote from Conference Board Senior Manager highlights the quandary for the U.S. economy:
“While the rate of month-over-month declines in the LEI have moderated in recent months, the leading economic index still points to risk of recession in the US economy. The most recent financial turmoil in the US banking sector is not reflected in the LEI data but could have a negative impact on the outlook if it persists. Overall, The Conference Board forecasts rising interest rates paired with declining consumer spending will most likely push the US economy into recession in the near term.”18
Since 1988, the LEI has dropped below zero over a six-month period on 10 occasions. On five of those occasions, the LEI has dropped below -4%—signaling a recession every time. In May 2021, the LEI’s six-month change dropped below zero, triggering a recession warning. On June 30, 2022, the index dropped below -4%.
To add even more intrigue, on January 26, the U.S. Treasury Department officially hit its statutory borrowing limit, otherwise known as the debt ceiling. So, far the Treasury Department has been able to improve liquidity by activating extraordinary accounting measures, but estimates indicate that it could run out of funds by July.19 Treasury issuance for the first quarter of 2023 was expected to be $932 billion.20 However, due to the debt ceiling, net issuance was only $436 billion. As a result, the Treasury’s cash balance has been worked down to $177 billion, substantially lower than the $500 billion in cash the Treasury had wanted to have on hand at the end of March.20,21 While the U.S. certainly has the resources to raise the debt ceiling, it’s unclear by how much it will be raised or what political tradeoffs will be required to reach such an agreement. Notably, the MOVE Index (which measures implied volatility in the U.S. Treasury market) also remains elevated to levels of volatility not seen since the Global Financial Crisis in 2009.22 The U.S. Treasury market will likely remain in this unusual state of elevated volatility as supply—especially longer-term debt—will be substantially increased once the debt ceiling is resolved.
Markets
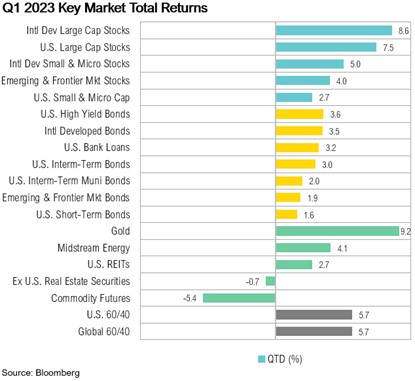
Both U.S. and international equity markets rallied in the last few days of March to end the month (and the quarter) in positive territory. The MSCI EAFE Index ended the quarter up 8.6%, and the S&P 500 posted a respectable 7.5% gain. As longer-term interest rates stabilized, fixed income markets recovered most of the losses made throughout February and ended the quarter at January levels. The Bloomberg U.S. Aggregate Bond Index closed the quarter up 3.0%, while international developed market bonds ended the quarter up 3.5%.
Looking Forward
Due to persistently high inflation, the Fed has continued to hike interest rates, which has stressed the banking system and slowed the economy. To make matters worse, the Fed Funds futures markets currently projects a 70% chance that the Fed will raise interest rates an additional 25 basis points (to 5.25%) at the May 3 FOMC meeting.23 Beyond that, predictions begin to shift, and markets anticipate a Fed pause, followed by rate cuts before the end of 2023.
At RMB, we believe there will be continued volatility in both equity and fixed income markets, as the Federal Reserve continues with their plan to increase interest rates in order to mitigate above average inflation. This environment of decades-high inflation and rising interest rates is putting pressure on global growth. The labor market has thus far remained resilient, and inflation will probably continue to be sticky for longer than the Fed would like. The trajectory of inflation from here appears to be downward, but the pace at which the declines occur remains a key component to Federal Reserve policy going forward.
Incoming economic data and the policy developments they help shape are fluid and highly uncertain. While we wait for clarity on these topics, for the first time in more than 15 years, we can earn 4% to 5% on short-term government bonds. We continue to believe that strong fundamentals should help markets over the longer term and that the income component of our client’s investment portfolios – the interest paid from owning bonds and stock dividends – will be a more important factor of investment returns going forward. While we think that the longer-term outlook will continue to improve as yields rise and stocks get cheaper, we would caution that 2023 could be another challenging year for investors. We recommend sticking to long-term investment allocation targets through a diversified portfolio of assets that emphasizes quality and cash flow and taking advantage of rebalancing opportunities as they emerge amongst the volatility. We remain optimistic that the strategies we have in place for our clients will drive long-term success despite the volatility we are currently experiencing.
Citations
- WSJ: https://www.wsj.com/articles/bank-collapse-crisis-timeline-724f6458
- MarketWatch: https://www.marketwatch.com/story/morgan-stanley-ceo-calls-for-small-sandboxes-to-contain-financial-storms-a2a9751b
- Federal Reserve: https://www.federalreserve.gov/mediacenter/files/FOMCpresconf20230322.pdf
- GARP: https://www.garp.org/risk-intelligence/market/silicon-valley-bank-031423
- Federal Reserve: https://www.federalreserve.gov/monetarypolicy/bank-term-funding-program.htm
- Bankrate: https://www.bankrate.com/banking/savings/average-savings-interest-rates/
- WSJ: https://www.wsj.com/market-data/quotes/bond/BX/TMUBMUSD03M
- Bloomberg: https://www.bloomberg.com/news/articles/2023-03-31/us-bank-deposits-decline-sharply-for-a-second-straight-week#xj4y7vzkg
- BLS: https://www.bls.gov/charts/employment-situation/civilian-unemployment-rate.htm
- NY Fed: https://www.newyorkfed.org/medialibrary/media/research/global_economy/Crisis_Timeline.pdf
- FRED: https://fred.stlouisfed.org/series/DPCERE1Q156NBEA
- FRED: https://fred.stlouisfed.org/series/PSAVERT
- University of Michigan: http://www.sca.isr.umich.edu/
- FRED: https://fred.stlouisfed.org/series/REVOLSL
- Bankrate: https://www.bankrate.com/finance/credit-cards/current-interest-rates/
- FRED: https://fred.stlouisfed.org/series/DRTSCILM#0
- Federal Reserve: https://www.federalreserve.gov/releases/h8/20230331/
- Conference Board: https://www.conference-board.org/topics/us-leading-indicators
- Forbes: https://www.forbes.com/sites/jonathanponciano/2023/01/13/us-stands-to-run-out-of-cash-by-early-june-if-debt-limit-isnt-raised-yellen-warns/?sh=504541a9706e
- Treasury: https://home.treasury.gov/news/press-releases/jy1231
- Treasury: https://fsapps.fiscal.treasury.gov/dts/issues/2023/2?sortOrder=desc#FY2023Q2
- CNBC: https://www.cnbc.com/quotes/.MOVE
- CME FedWatch: https://www.cmegroup.com/markets/interest-rates/cme-fedwatch-tool.html
Performance Disclosures
All market pricing and performance data from Bloomberg, unless otherwise cited. Asset class and sector performance are gross of fees unless otherwise indicated.


