


Key Takeaways
- Despite early declines, U.S. large cap stocks recovered to end August up 2.4%, but U.S. small cap stocks finished down 1.5%. U.S. intermediate-term bonds rose 1.4%.
- The Federal Reserve signaled a likely rate cut in September. Markets are expecting 1% in cuts by year end, implying one 0.5% cut, a move typically only seen in crises.
- The broader market rally since August 5 was led by interest-rate-sensitive utilities and real estate sectors.
- As we head into the year-end, markets will be focused on potential interest rate cuts, inflation trends, and the upcoming election.
Overview
Much like the famous Nat King Cole song, the markets in August were reminiscent of the “lazy, hazy, crazy days of summer.” Despite U.S. large cap stocks declining 6.0% early in the month, the S&P 500 ended August up 2.4%. U.S. small cap stocks fared less well, as the Russell 2000 small cap index ended August down 1.5%. As proxied by the Bloomberg U.S. Aggregate Bond Index, intermediate-term bonds rallied 1.4%, closing the month at a 52-week high. Intermediate-term bonds are up 7.8% over the past year.
The July inflation report, released on August 14, showed headline inflation easing to 2.9% year over year—falling below 3.0% for the first time since March 2021. Core inflation also ticked slightly lower, dropping from 3.3% to 3.2%.1 The Federal Open Market Committee (FOMC) minutes from the July 31 meeting revealed a growing inclination to begin cutting interest rates, as labor market concerns increasingly overshadowed inflation worries. Several committee members expressed support for a 25-basis-point rate cut at the July meeting, and consensus increasingly formed around easing policy at the next meeting on September 17-18.2
In addition to inflation cooling, the labor market also showed continued signs of softening in August. Even though the unemployment rate ticked marginally lower, to 4.2% from 4.3%, the August jobs report showed the U.S. economy adding 142,000 new jobs over the past month, below the expected 165,000.3 There were also notable downward revisions to new jobs added over June and July.3,4 On August 21, the Bureau of Labor Statistics released payroll revisions for the 12-month period through March 2024. The report showed that payrolls during that period had been revised downward by 818,000 jobs.5 This equates to an average monthly downward revision of 68,000 jobs, resulting in an updated estimate of 174,000 new jobs added each month, down from the original 242,000. Notably, the majority of the revisions were concentrated in higher wage sectors, such as information and professional and business services.5 Overall, these payroll revisions adjust the labor market characterization from ‘very strong’ to ‘strong’ during the revised period. The new estimates are still well above the 10-year average of 164,000. Any revisions to the current labor market will only be reported in February 2025.
Bolstered by these in-line inflation reports, signs of continued cooling in the labor market, and Fed Chair Jerome Powell’s comments at the annual Jackson Hole symposium that “the time has come for policy to adjust,” investors by the end of August were anticipating the equivalent of 100 basis points in interest rate cuts before year end.6,7 With only three FOMC meetings left in 2024, this implies that markets are expecting at least one 50 basis-point rate cut—something that has only occurred during recessions or times of crisis.
Those Lazy-Hazy-Crazy Days of Summer
The 'Summer Slowdown' is a seasonal phenomenon in which the stock market typically sees lower trading volumes and reduced price volatility during the summer months. However, while investors may have been hoping for more of these “lazy” days in August, the first week of the month turned out to be quite the opposite. Stock prices dropped rapidly while volatility spiked. A weaker-than-expected U.S. July jobs report and a slowdown in U.S. manufacturing activity triggered the rout. As a result, the S&P 500 declined by 6.0% between July 30 and August 5. At the intraday lows, the S&P 500 had dropped 9.7% from its all-time high on July 16. During the same period, U.S. small cap stocks experienced their largest three-day decline since the 2020 COVID-19 shock, falling nearly 10% and wiping out most of the gains made in July.
However, since August 5, an unusually rapid rally lifted broader markets, resulting in positive returns by the end of the month. The S&P 500 surged nearly 9.0% after August 5, closing the month just 0.3% away from a new record high. Notably, this recent rally improved market breadth, and the equal-weight S&P 500 reached a new record high. The number of S&P 500 members outperforming the index over the past month rose from 41% at the end of July to 62% by the end of August.
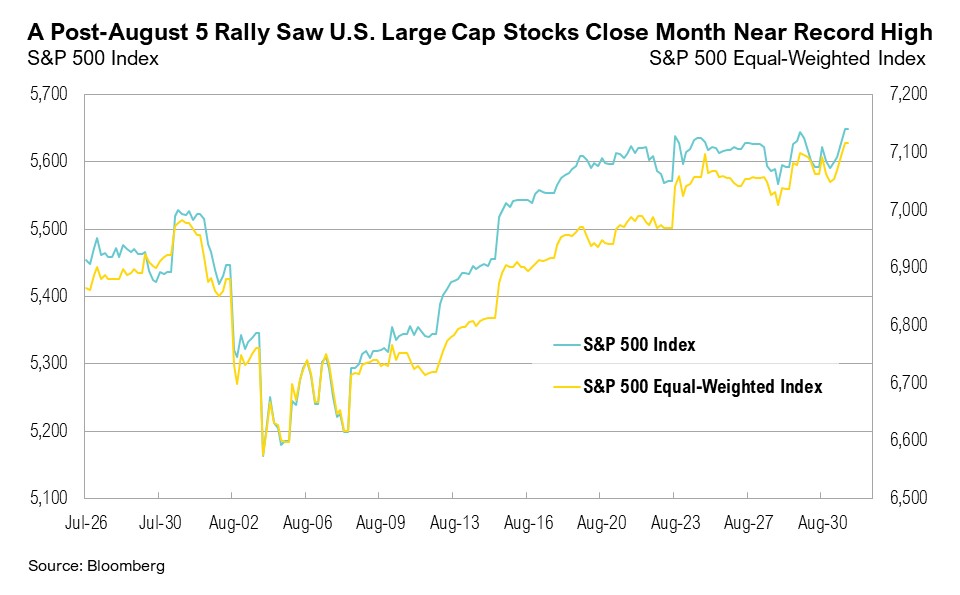
Although the early August selloff was widespread, some areas of the market rebounded more strongly than others. The utilities sector, which gained over 5% since August 5 and is up more than 18% year-to-date, benefited from the outcome of the annual power market auction by PJM Interconnection, the largest U.S. electrical grid operator. The auction cleared at a record high of $269.9 per megawatt-day, a more than 800% increase compared to $28.9 per megawatt-day a year earlier.8,9 This price surge reflects supply and demand imbalances, driven largely by increased electricity demand from artificial intelligence (AI) data centers and a slow pace of new-generation construction.9
The near certainty of a rate cut in September helped lift the real estate sector, which gained 7.3% after August 5, finishing the month up more than 5%. Thirty-year fixed mortgage rates dropped back below 7% for the first time in over a year.10 The potential for even lower mortgage rates boosted homebuilder stocks, and a record 58% of U.S. homebuilders traded at all-time highs.
In contrast, U.S. small cap stocks fared less well than their large cap counterparts in the post-August 5 recovery and experienced more volatile returns throughout the month. Despite rallying more than 8.5% between August 5 and August 30, the Russell 2000 Index finished the month down 1.5%, which appears less disappointing in light of the 10.2% gains in July.
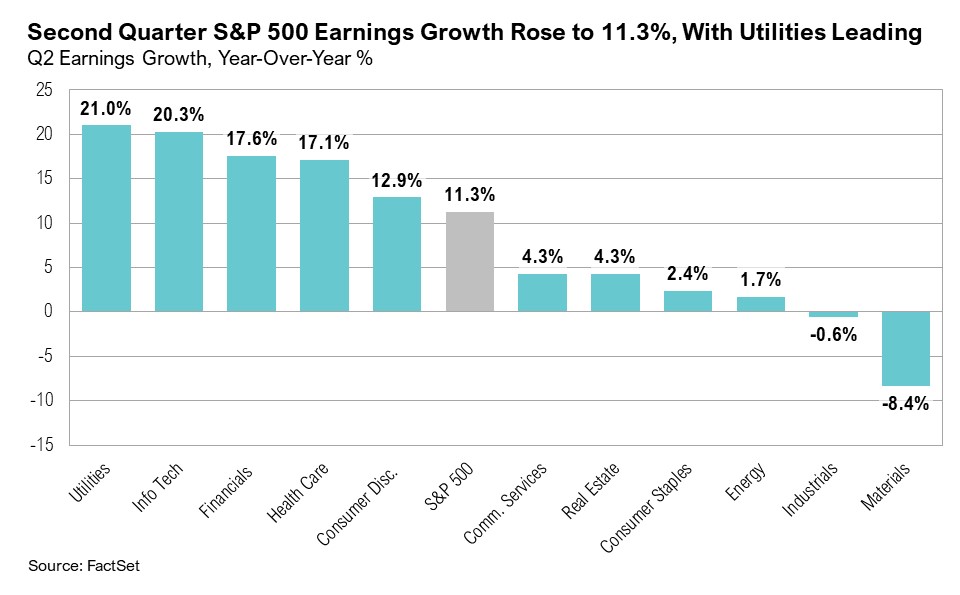
By the end of August, all S&P 500 companies had reported second-quarter earnings. Earnings growth for the index improved from 8.9% at the start of the third quarter to 11.3% by the end of August.11 The utilities sector led the way, generating the highest year-over-year earnings growth rate of 21.0%, followed by the information technology sector, which posted 20.3% growth. However, excluding Nvidia, the tech sector’s growth rate drops to just 9.5%, less than half that of utilities.12 Financials also performed well; earnings growth estimates for that sector rose from 4.3% to 17.6% during the quarter.11
Small cap earnings for the second quarter revealed challenges. Only one sector—consumer staples—posted positive earnings growth (up 0.1%).13 However, small caps’ full-year earnings growth is expected to exceed large cap stocks’ full-year earnings growth, coming in at 13.4% versus 11.3%, respectively.11,13 This shift could help small cap stocks shed the “value trap” label, which refers to stocks that appear cheap but continue to underperform.
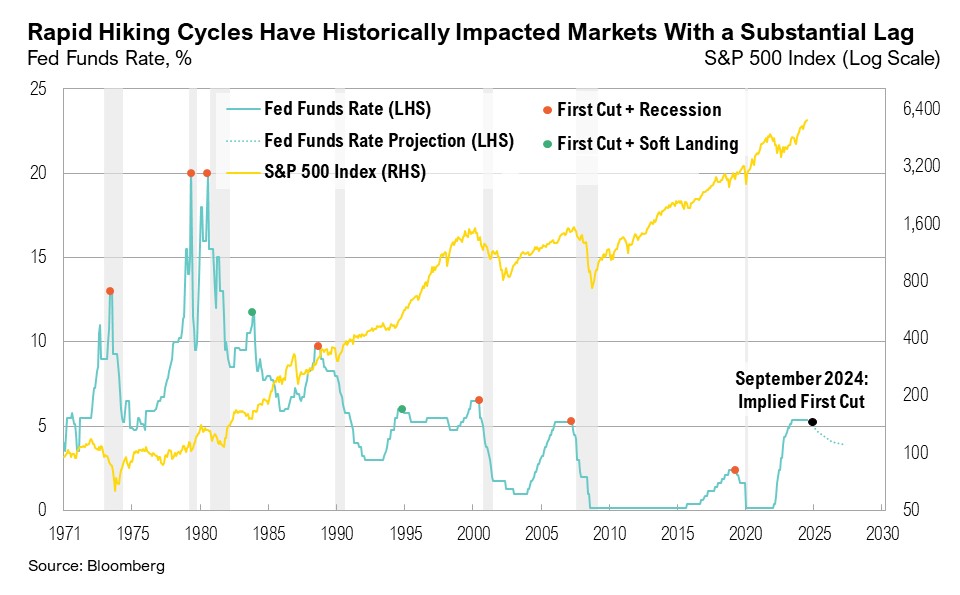
With the typically “lazy” days of the historical “Summer Slowdown” trend disrupted by the early August selloff and subsequent recovery, investors also faced some uncertain, hazy days. As of the end of August, markets were pricing in a near-certain interest rate cut at the September 17-18 FOMC meeting, with a 67% probability of a 25-basis-point cut and a 33% probability of a 50-basis-point cut.7 According to Bank of America's August credit investor survey, a record 76% of U.S. investors now expect a soft landing.14
However, history reminds us that the Fed cutting rates doesn’t immediately stop the lingering effects of prior hikes, given their long and variable lags. In fact, much of the stock market weakness often occurs after the final rate hike. For instance, in January 2001, after the Fed announced the first rate cut of the cycle, the S&P 500 fell by more than 40% over the next two years. Similarly, in September 2007, when the Fed began cutting rates before the Global Financial Crisis, the S&P 500 declined by over 50%. Stocks only began to recover in March 2009. Whether the Fed can achieve a soft landing this time remains uncertain, particularly since inflation is still above the official 2% target.
While equity markets shifted from chaos to calm over the past month, bond markets held steady as yields remained contained. Treasury yields dropped early in August and stayed at those lower levels for the remainder of the month. The 10-year Treasury yield ended August at 3.9%, a level last seen in early January. Notably, the 10-year minus 2-year Treasury yield, a common indicator of economic growth and general representation of the Treasury yield curve, after briefly dis-inverting on August 28 and rising to 0.01%, ended the month flat, at 0.0%. This marked the end of the longest period of inversion on record—784 consecutive days.15
Markets
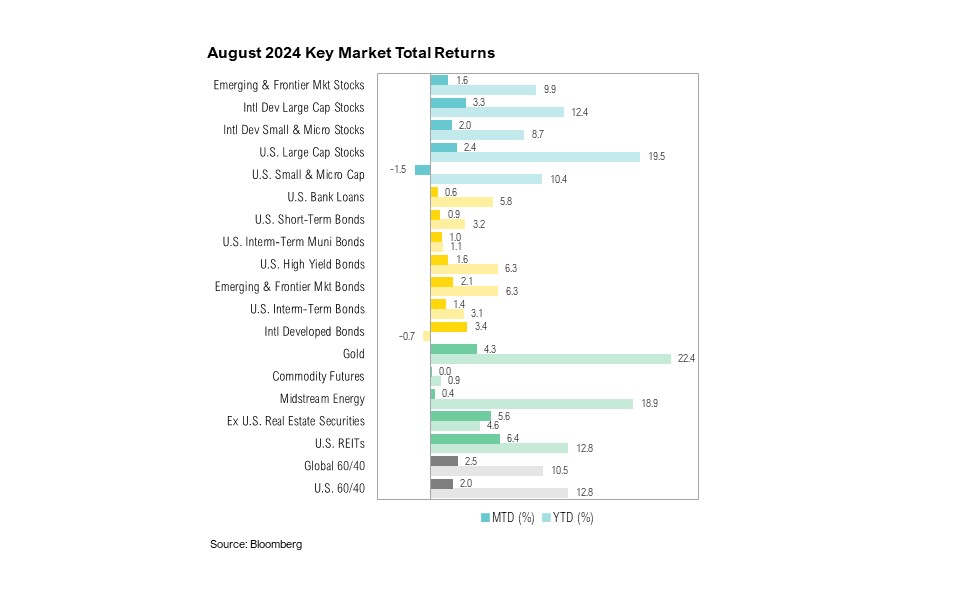
U.S. small cap stocks were the only major asset class to finish August with negative returns. In contrast, international equity markets outperformed their U.S. counterparts, led by gains in European markets. While U.S. large cap stocks ended the month up 2.4%, international developed market large cap stocks rose 3.3%, and international developed market small-cap stocks gained 2.0%, outperforming U.S. small caps by 3.5%.
Boosted by the near-certain prospect of an interest rate cut at the September FOMC meeting, U.S. intermediate-term bonds ended the month up 1.4%, while U.S. REITs surged 6.4%, making them the top performers for August. Gold also performed well, rising 4.3% and reaching a new high of $2,511 per ounce on August 27. Year-to-date, gold is up 22.4%, making it the best-performing asset class so far this year.
Looking Forward
As we head into year-end, markets will focus on potential interest rate cuts, inflation trends, and the upcoming election. The effects of interest rate cuts are still unknown, particularly as the Fed appears poised to cut rates amid above-target inflation and near full employment. Whether inflation continues to ease and when (or if) it will return to the 2% target remains to be seen. The upcoming election brings significant uncertainty not only regarding the outcome, but also concerning the policies that will be implemented by the winner.
Given all the uncertainty and increased volatility in markets, we continue to be cautious with risk assets as the current cycle plays out in the coming weeks and months. Although lower asset prices would be a welcome development and an opportunity to put additional capital to work, typical election year seasonals—coupled with still-high equity valuations—suggest that there is no rush. We remain biased towards high-quality companies within our core stock portfolios. We have been well-positioned within core bond portfolios with a low weight toward shorter duration corporate bonds and a higher weight toward longer-duration treasury bonds. We believe clients are best served reminding themselves of the timeless principles of patience and diversification. The key to successful investing is often remaining committed to long-term investment plans.
Citations
1. BLS: https://www.bls.gov/cpi/
2. Federal Reserve: https://www.federalreserve.gov/monetarypolicy/files/fomcminutes20240731.pdf
3. BLS: https://www.bls.gov/news.release/empsit.nr0.htm
4. CNBC: https://www.cnbc.com/2024/09/06/jobs-report-august-2024.html
5. BLS: https://www.bls.gov/ces/notices/2024/2024-preliminary-benchmark-revision.htm
6. Federal Reserve: https://www.federalreserve.gov/newsevents/speech/powell20240823a.htm
7. CME FedWatch: https://www.cmegroup.com/markets/interest-rates/cme-fedwatch-tool.html
8. Reuters: https://www.reuters.com/business/energy/pjm-power-auction-results-yield-sharply-higher-prices-2024-07-31/
9. S&P Global: https://www.spglobal.com/commodityinsights/en/market-insights/latest-news/electric-power/073024-pjm-power-capacity-auction-clears-at-record-high-price-of-26992mw-day-for-most-of-footprint
10. Bankrate: https://www.bankrate.com/mortgages/analysis/
11. FactSet: https://advantage.factset.com/hubfs/Website/Resources%20Section/Research%20Desk/Earnings%20Insight/EarningsInsight_090624A.pdf
12. FactSet: https://advantage.factset.com/hubfs/Website/Resources%20Section/Research%20Desk/Earnings%20Insight/EarningsInsight_081624.pdf
13. Franklin Templeton: https://www.ftinstitutional.com/articles/2024/royce-investment-partners/us-small-cap-why-earnings-could-fuel-a-rebound
14. Bloomberg: https://www.bloomberg.com/news/articles/2024-08-13/bofa-survey-shows-optimism-on-big-tech-soft-landing-is-unbroken
15. FRED: https://fred.stlouisfed.org/series/T10Y2Y
Index Definitions
The S&P 500 Index is widely regarded as the best single gauge of the United States equity market. It includes 500 leading companies in leading industries of the U.S. economy. The S&P 500 focuses on the large cap segment of the market and covers approximately 75% of U.S. equities.
The Bloomberg Barclays U.S. Aggregate Index represents securities that are SEC-registered, taxable, and dollar denominated. The index covers the U.S. investment grade fixed rate bond market, with index components for government and corporate securities, mortgage pass-through securities, and asset-backed securities. Duration is roughly 5 years.
The Bloomberg U.S. Corporate High Yield Bond Index measures the USD-denominated, high yield, fixed-rate corporate bond market. Securities are classified as high yield if the middle rating of Moody’s, Fitch and S&P is Ba1/BB+/BB+ or below. Bonds from issuers with an emerging markets country of risk, based on the indices’ EM country definition, are excluded.
The Russell 1000® Value Index measures the performance of the large-cap value segment of the U.S. equity universe. It includes those Russell 1000 companies with lower price-to-book ratios and lower expected and historical growth rates.
The Russell 1000® Growth Index measures the performance of the large- cap growth segment of the US equity universe. It includes those Russell 1000 companies with relatively higher price-to-book ratios, higher I/B/E/S forecast medium term (2 year) growth and higher sales per share historical growth (5 years).
The Russell 2000® Index measures the performance of the small-cap segment of the US equity universe. It includes approximately 2000 of the smallest US equity securities in the Russell 3000 Index based on a combination of market capitalization and current index membership. The Russell 2000 Index represents approximately 10% of the total market capitalization of the Russell 3000 Index. Because the Russell 2000 serves as a proxy for lower quality, small cap stocks, it provides an appropriate benchmark for RMB Special Situations.
MSCI EAFE Index*: an equity index which captures large and mid-cap representation across 21 of 23 Developed Markets countries around the world, excluding the U.S. and Canada. With 926 constituents, the index covers approximately 85% of the free float-adjusted market capitalization in each country.
The MSCI Emerging Markets Index* measures equity market performance in the global emerging markets universe. It covers over 2,700 securities in 21 markets that are currently classified as EM countries. The MSCI EM Index universe spans large, mid and small cap securities and can be segmented across all styles and sectors.
The U.S. Dollar Index is used to measure the value of the dollar against a basket of six foreign currencies: the euro, Swiss franc, Japanese yen, Canadian dollar, British pound, and Swedish krona.
The Deutsche Bank EM FX Equally Weighted Spot Index, an equal-weighted basket of 21 emerging market currencies.
MSCI U.S. REIT Index is a free float-adjusted market capitalization weighted index that is comprised of equity Real Estate Investment Trusts (REITs). The index is based on the MSCI USA Investable Market Index (IMI), its parent index, which captures the large, mid and small cap segments of the USA market. With 150 constituents, it represents about 99% of the US REIT universe and securities are classified under the Equity REITs Industry (under the Real Estate Sector) according to the Global Industry Classification Standard (GICS®), have core real estate exposure (i.e., only selected Specialized REITs are eligible) and carry REIT tax status.
*Source: MSCI.MSCI makes no express or implied warranties or representations and shall have no liability whatsoever with respect to any MSCI data contained herein. The MSCI data may not be further redistributed or used as a basis for other indexes or any securities or financial products. This report is not approved, endorsed, reviewed or produced by MSCI. None of the MSCI data is intended to constitute investment advice or a recommendation to make (or refrain from making) any kind of investment decision and may not be relied on as such.
Performance Disclosures
All market pricing and performance data from Bloomberg, unless otherwise cited. Asset class and sector performance are gross of fees unless otherwise indicated.
The opinions and analyses expressed in this newsletter are based on Curi RMB Capital, LLC’s (“Curi RMB Capital”) research and professional experience are expressed as of the date of our mailing of this newsletter. Certain information expressed represents an assessment at a specific point in time and is not intended to be a forecast or guarantee of future results, nor is it intended to speak to any future time periods. Curi RMB Capital makes no warranty or representation, express or implied, nor does Curi RMB Capital accept any liability, with respect to the information and data set forth herein, and Curi RMB Capital specifically disclaims any duty to update any of the information and data contained in this newsletter. The information and data in this newsletter does not constitute legal, tax, accounting, investment or other professional advice. Returns are presented net of fees. An investment cannot be made directly in an index. The index data assumes reinvestment of all income and does not bear fees, taxes, or transaction costs. The investment strategy and types of securities held by the comparison index may be substantially different from the investment strategy and types of securities held by your account. RMB Asset Management is a division of Curi RMB Capital.