
Key Takeaways
- U.S. markets delivered mixed results in the second quarter. Large cap stocks climbed 4.3%, while small cap stocks declined by 3.3%. Bonds ended the quarter up 0.1%.
- Despite market and Fed expectations for at least one interest rate cut this year, U.S. inflation remains above the Federal Reserve’s 2% target.
- A handful of mega-cap technology stocks have contributed to most of the S&P 500’s year-to-date gains, as market breadth remains narrow and tech sector valuations are at the high end of historical ranges.
- The fiscal situation remains precarious, as evidenced by a notable absence of discussion on fiscal responsibility in the recent presidential debate, which suggests a persistent lack of budgeting restraint.
- Despite these concerns, slowing growth and inflation appear enough to keep the bond market content, and yields remain relatively contained—at least for now.
Overview
Equity markets delivered mixed results in the second quarter. U.S. large cap stocks climbed 4.3% over the quarter, bringing the S&P 500’s year-to-date return up to 15.3%. In contrast, U.S. small cap stocks ended the quarter down 3.3%, and the Russell 2000 has gained only a modest 1.7% year-to-date. This is only the 10 th time since 1990 that the quarterly spread between U.S. large caps and U.S. small caps has exceeded 7.0%, and most of those occurred in the lead-up to the tech bubble. The Bloomberg U.S. Aggregate Bond Index ended the quarter up 0.1% and finished the first six months of the year down 0.7%.
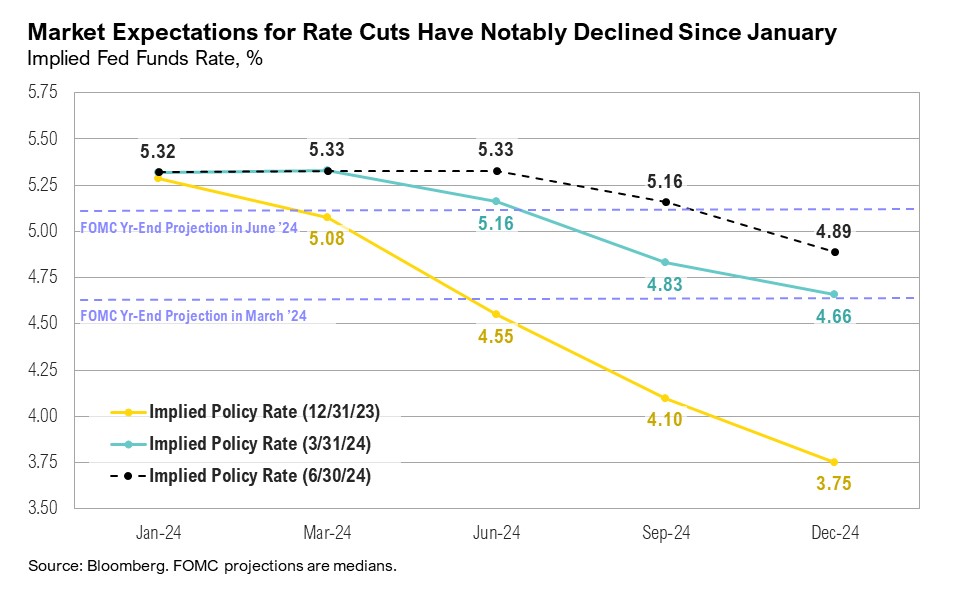
June marked the two-year anniversary since year-over-year U.S. inflation hit a four-decade high of 9.1%. Since then, inflation has been on a rocky road back down to the Fed’s 2% target, which it has yet to reach. In recent months, inflation has been above consensus expectations, but, notably, the inflation number for June 2024 showed a below consensus reading of 3.0%. 1 At the June Federal Open Market Committee (FOMC) meeting, the Federal Reserve opted to keep interest rates unchanged for the seventh consecutive meeting, and Fed chair Jerome Powell reiterated that the central bank did not yet have the necessary confidence to start cutting interest rates. 2 Market expectations for interest rate cuts dramatically shifted over the first half of 2024. In January, markets expected the equivalent of seven rate cuts in 2024, but by June, markets were expecting one to two cuts for this year. 3
First-quarter earnings results showed that the S&P 500 companies fared better than analysts expected. Year-over-year earnings growth for the quarter rose from an expected 3.4% at the end of March to 5.9% at the end of June. 4 For second-quarter earnings, the entire S&P 500 is expected to report year-over-year earnings growth of 8.8%, and full-year 2024 earnings growth estimates have now hit 11%. 5 Eight of the eleven S&P 500 sectors reported year-over-year earnings growth, led by communication services at 34%, utilities at 32%, and information technology at 25%. 5 A short list of companies, particularly in these sectors, continue to drive earnings growth and dominate market returns. For example, if Meta and Alphabet are excluded from results, earnings growth in the communication services sector falls from 34% to just 1.8%. 6
Overall, the U.S. consumer remained resilient throughout the first half of 2024. Personal income data remained stable, increasing at an average month-over-month rate of 0.5% for the first five months of 2024 (the most recent data available), compared to the 0.4% average monthly increase for the first five months of 2023. 7 This, along with consumer access to credit and buy-now-pay-later (BNPL) programs, suggests that consumer spending may be able to persist despite higher interest rates. However, consumer sentiment dropped notably over the past quarter. The University of Michigan’s consumer sentiment index dropped from a two-year high of 79.4 at the end of March to 68.2 in June, in its sharpest three-month fall since April 2022. 8
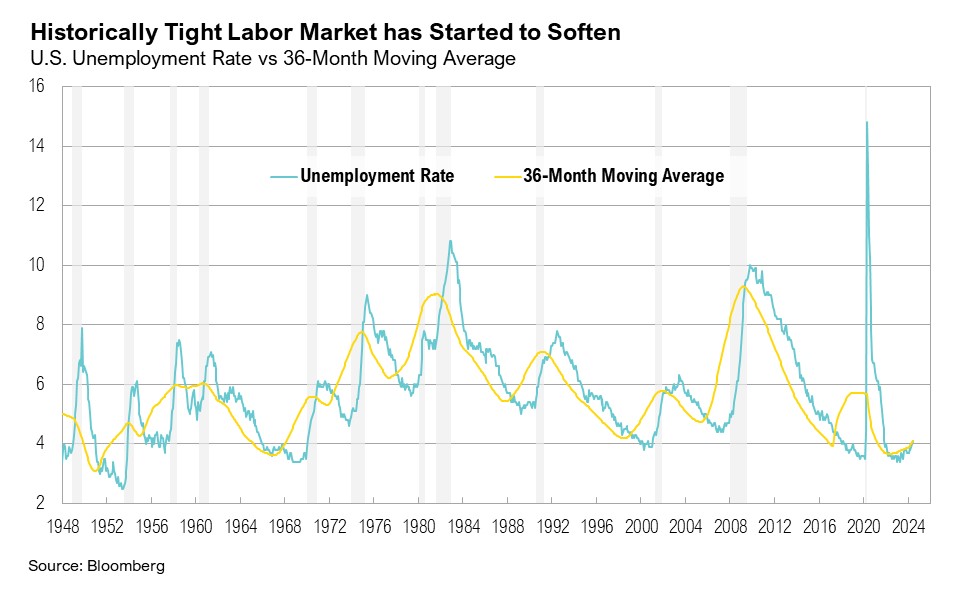
Consumers’ willingness to spend appears intact given the solid labor market. Although the U.S. unemployment rate remains low, at 4.1%, it has slowly been trending higher, crossing above its 36-month moving average of 4.0% for the first time in four years—a trend that historically has been followed by a more noticeable increase in the jobless rate. Job openings climbed higher in May, to 8.1 million, from a downwardly revised 7.9 million in April. 9 The May JOLTS report highlighted a notable development in the U.S. labor market: for every job seeker, there were still 1.22 job openings, which suggests some persistent tightness in the labor market. 9 The quits rate has also held steady at 2.2% for seven consecutive months, slightly above the 20-year average of 2.0%. 10
Additional signs of softening economic data emerged over the second quarter. Final first-quarter GDP estimates showed that quarter-over-quarter annualized growth dropped from 3.4% to 1.4%, and the consumer spending portion of GDP was revised down from 2% to 1.5%. 11 Despite ongoing consumer spending, retail sales declined by 0.2% month-over-month in April and rebounded only slightly in May, rising by 0.1%. Moreover, the ISM Services PMI unexpectedly dropped back into contractionary territory in June, falling to 48.8 (less than 50 indicates contraction) while the ISM Manufacturing PMI remained in contractionary territory in June. 12 The services PMI declined primarily due to lower business activity, fewer new orders, and persistently high prices. 13
Status Quo
Despite a notable improvement from the four-decade high of 9.1% in June 2022, U.S. inflation remains well above the Fed’s official 2% target, at 3.3%. While the Fed has maintained interest rates at 5.25% to 5.5% for nearly 12 months, other central banks worldwide have started to reduce rates. On April 3, the Swiss National Bank became the first G10 central bank to cut interest rates this cycle. 14 On June 5, the Bank of Canada lowered interest rates by 25 basis points, and on June 6, the European Central Bank followed suit, marking its first rate cut since 2019. 14,15 Over the quarter, many have appealed to the Fed to cut interest rates. Senator Elizabeth Warren sent a letter to the Fed on June 10, urging them to lower rates. Even President Biden stated in April, “Well, I do stand by my prediction that, before the year is out, there’ll be a rate cut.” 16,17
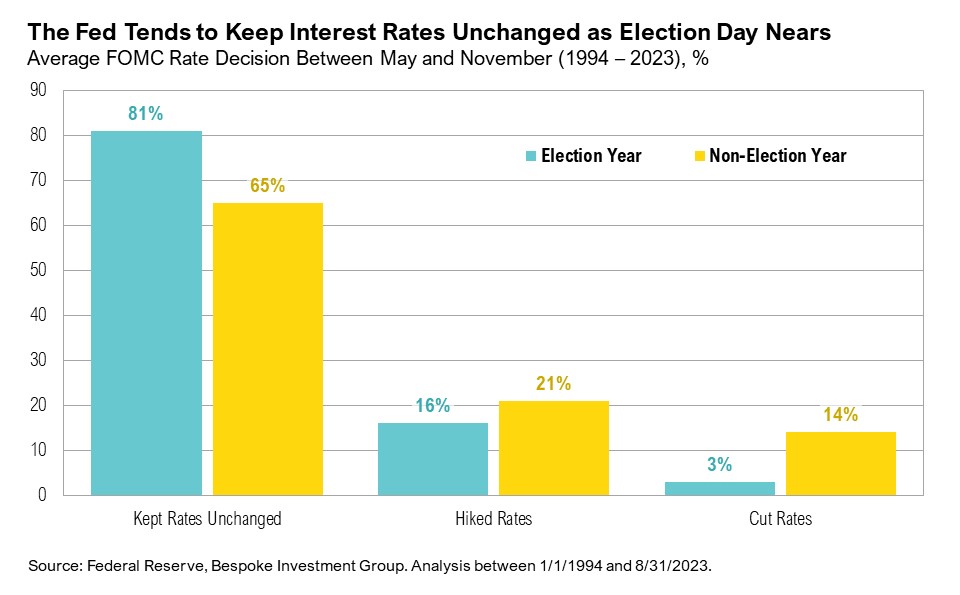
Although the Fed’s economic projections have been revised downwards from two rate cuts to one rate cut for this year (and the year-end inflation rate has been revised upwards from 2.6% to 2.8%), history shows that the Fed tends to prefer keeping rates unchanged as a presidential election draws nearer. Between 1994 and 2023, the Fed kept interest rates unchanged 81% of the time in the six months leading up to election day and cut rates only 3% of the time—all during 2008. 18 However, in September 2012, the Fed announced open-ended quantitative easing, a form of policy easing, so anything is possible. 19 Also, at its May FOMC meeting, the Fed announced that it plans to taper quantitative tightening, which implies it will purchase approximately $500 billion in Treasuries over the next 12 months. 20 So, for now, it seems that the Fed is content with the status quo of elevated interest rates and inflation above 2%.
Bolstered by mega-cap technology companies and continued enthusiasm surrounding artificial intelligence, the S&P 500 ended the second quarter up 4.3%. The technology sector fared best, gaining 14% over the quarter, followed by communication services, which gained 9%, and utilities companies, which ended the quarter up 5%. The Magnificent Seven—Apple, Microsoft, Meta, Alphabet, Amazon, Tesla, and Nvidia—have gained more than 35% year to date, compared to the 8% gain that the other 493 stocks in the S&P 500 have made. The narrowness is extreme. Only 17% of S&P 500 stocks outperformed the index in June, compared to the historical average of 49%, marking the lowest participation rate in at least a decade. 21 Further, the correlation between the S&P 500 market cap and equal-weighted indices is among the lowest in 25 years. As unusual as the narrowness is, it is hard to argue that it isn’t at least partially justified by earnings growth trends. In 2023, the Magnificent Seven enjoyed year-over-year earnings growth of 19.3% while the rest of the S&P 500 (or the S&P 493) saw earnings decline by 1.4%. The status quo divergence in earnings growth is expected to continue in 2024, as full-year earnings for the Magnificent Seven are expected to rise by 53.5% while earnings for the rest of the S&P 500 companies are expected to rise by only 4.2%.
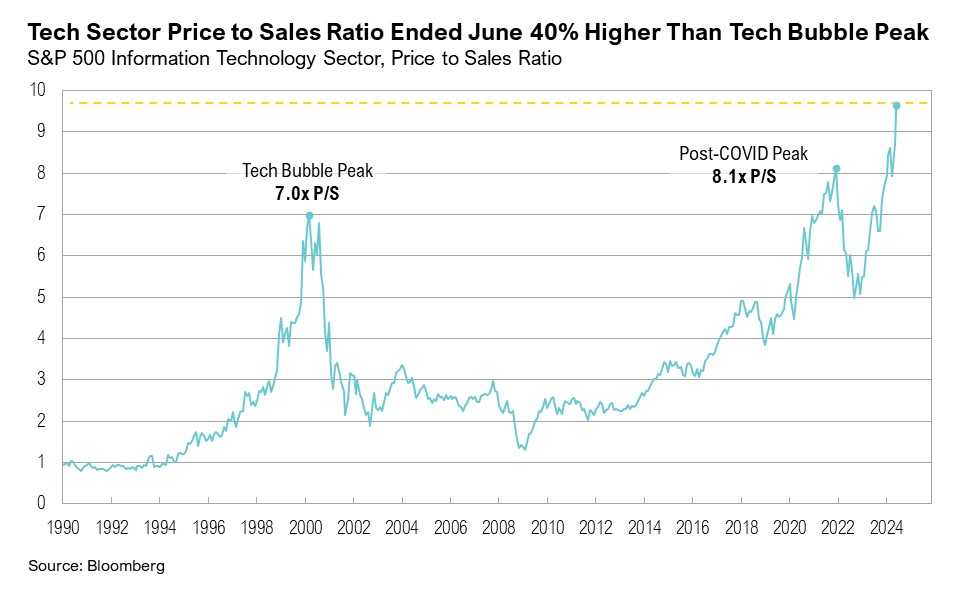
This mega-cap tech rally has been accompanied by historically low levels of volatility. The S&P 500 has now experienced its longest period since the Global Financial Crisis without a daily decline of 2% or more, and the ongoing rise in tech stocks has pushed valuations higher. 22 The S&P 500 technology sector ended June at a 9.8x price-to-sales (P/S) ratio, which was 40% higher than the tech bubble peak of 7.0x. Similarly, the median S&P 500 technology stock ended June with a 6.6x P/S compared to 5.5x at the peak of the tech bubble. This market exuberance was further captured in investor sentiment: Bank of America’s Fund Manager Survey showed its most bullish sentiment since November 2021. 23 Meanwhile, expectations for a global “hard landing” made new lows, and household stock allocations hit 70-year highs of 34.5%. 23,24
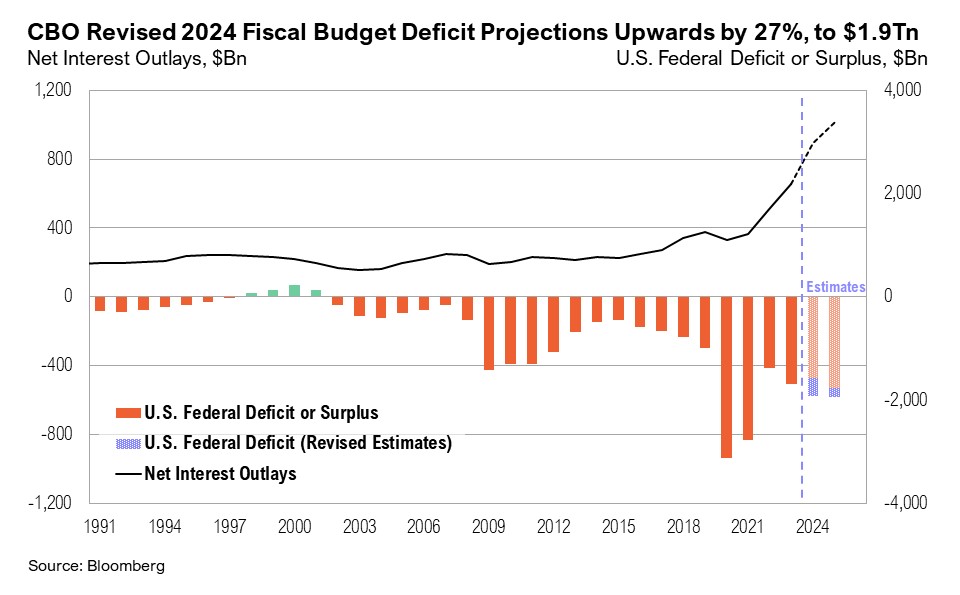
The precarious fiscal situation in the U.S. continues. The fiscal year-to-date budget deficit has reached $1.2 trillion. 25 On June 18, the Congressional Budget Office (CBO) revised the expected fiscal budget deficit upwards to $1.9 trillion (or 6.7% of GDP)—a 27% increase from its original February estimate of $1.5 trillion. 26 This level of deficit spending is more akin to an economy in recession or one dealing with a global pandemic. Net interest outlays, which are projected to increase significantly, are expected to constitute a growing share of the deficit—rising from $650 billion in 2023 to $892 billion in 2024—and they are expected to increase to $1.7 trillion by 2034. 26 Unadjusted for inflation, the U.S. is expected to add as much debt in the next decade as it did from 1789 to 2021. 26 A key takeaway from the recent presidential debate, held on June 27 between President Biden and former President Trump, was a lack of focus on fiscal responsibility. Neither candidate proposed measures for budget restraint, likely reinforcing the recent CBO projections for an escalating fiscal budget deficit.
Bond markets have remained stable despite higher inflation and continued fiscal spending. Throughout the quarter, yields were relatively contained. The yield curve shifted higher in April on hotter-than-expected inflation data, but it flattened again following a series of softer economic data prints over the last two months of the quarter, specifically when lower first-quarter GDP revisions and ISM PMIs dropped into contractionary territory. The 10-year Treasury yield ended the quarter at 4.4%, and the 2-year Treasury yield ended the quarter at 4.7%.
Treasury yields jumped higher in the closing days of the quarter, likely due to concerns over the fiscal implications of a possible Republican sweep in November. 27 History shows that budget deficits tend to expand when one party controls both Congress and the White House. 27 Increased deficits (which seem inevitable, at least in the shorter term) could lead to an increased supply of bonds and may put downward pressure on Treasury prices. Despite these concerns, slowing growth and inflation appear to be enough to keep the bond market content, and yields remain relatively contained.
Markets
In equity markets, emerging and frontier market stocks were the top performers, gaining 5.1% over the quarter. Performance in several emerging markets was largely determined by election outcomes, including notable elections in South Africa, Mexico, and India over the past three months. The MSCI South Africa Index ended the quarter up 12.3%, the MSCI Mexico Index ended the quarter down 16.1%, and the MSCI India Index ended the quarter up 10.2%. Bolstered by a handful of mega-cap tech companies, U.S. large cap stocks ended the quarter up 4.3%. U.S. small cap stocks were the worst-performing equities, ending the quarter down 3.3%. U.S. intermediate-term bonds ended the quarter up 0.1% and are down 0.7% year-to-date.
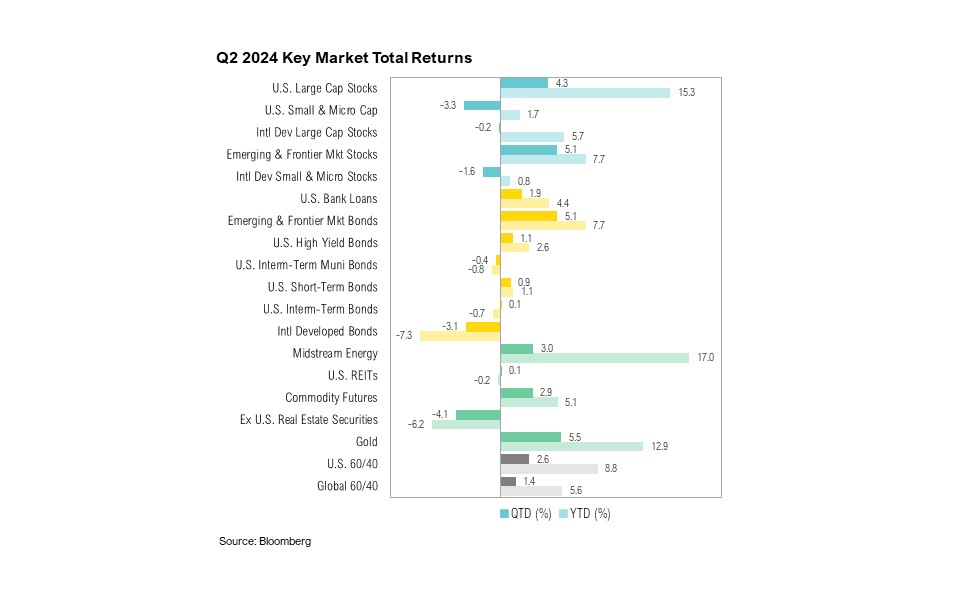
Gold ended the second quarter up 5.5%, reaching a new record high of $2,446 per ounce on May 20. After dropping to $73.2 per barrel on June 4, West Texas Intermediate (WTI) crude ended the quarter at $81.5 per barrel. Gas prices, which had been slowly declining after peaking at $3.8 per gallon on April 22, ticked higher as oil surpassed $80 per barrel, and the national average price per gallon of regular unleaded gas ended June at $3.60 per gallon. 28
The Japanese yen reached the lowest levels in nearly four decades on June 28, declining to ¥161 against the U.S. dollar. Over 60 countries will hold general elections over the course of 2024, and more than two billion people are registered to vote this year. 29 In France, the first round of snap elections, held on June 30, led to protests, and the final outcome will be determined in the first week of July. The MSCI France Index ended the quarter down 7.5%, in part due to election uncertainty.
Looking Forward
Capital markets have been in risk-on mode since the Fed’s pivot in December 2023. Since then, U.S. large cap stocks have gained 19.1%, and U.S. intermediate-term bonds have seen only a 2.1% increase, highlighting the trade-offs associated with a looser approach to inflation. Although elements of this market environment seem unsustainable, there is no reason the current unusual dynamics cannot continue as long as the underlying conditions—such as crisis-level fiscal spending, an implicitly higher inflation target, the tapering of quantitative tightening, a stable labor market, and decent economic growth—continue. As long as these factors are maintained and longer-term bond yields remain stable, the economy and markets will have sufficient liquidity to function, and investors may continue to favor mega-cap growth companies, regardless of their valuations, at the expense of other areas of the market.
With limited political will from both the Democratic and Republican parties to cut spending, looser fiscal policy could continue to impede the Fed’s efforts to bring inflation back to 2%, while also increasing the U.S. debt burden. Ultimately, the bond market may serve as the final arbiter in determining when this slow-motion crisis reaches a critical point. While a rotation to broader equity market breadth would be welcome, as there are attractive opportunities around the world, predicting the exact timing of such a rotation is impossible. For now, the status quo may continue—that is, until it doesn’t.
Our view remains that as long as higher rates persist, they will continue to accentuate the difference in prospects between faster-growing and/or highly profitable businesses relative to those that are not, creating a tailwind for active managers. While the immediate impact of any further easing by the Federal Reserve will likely be viewed as positive for all risky assets, persistent inflation could continue to frustrate efforts to manage it. The ongoing policy tug-of-war means opportunities and risks will ebb and flow, with significant implications for inflation and interest rates, which will, in turn, dictate economic activity. Ultimately, we believe the stability of the economy and markets hinges on keeping inflation and interest rates contained.
Citations
- Bureau of Labor Statistics: https://www.bls.gov/cpi/
- Federal Reserve: https://www.federalreserve.gov/monetarypolicy/fomcpresconf20240612.htm
- CME FedWatch: https://www.cmegroup.com/markets/interest-rates/cme-fedwatch-tool.html
- FactSet: https://advantage.factset.com/hubfs/Website/Resources%20Section/Research%20Desk/Earnings%20Insight/EarningsInsight_060724.pdf
- FactSet: https://advantage.factset.com/hubfs/Website/Resources%20Section/Research%20Desk/Earnings%20Insight/EarningsInsight_070324.pdf
- FactSet: https://advantage.factset.com/hubfs/Website/Resources%20Section/Research%20Desk/Earnings%20Insight/EarningsInsight_053124.pdf
- FRED: https://fred.stlouisfed.org/series/PI#0
- University of Michigan: https://news.umich.edu/sentiment-holds-steady-as-consumers-expect-inflation-to-slow/
- Bureau of Labor Statistics: https://data.bls.gov/timeseries/JTS000000000000000JOL
- FRED: https://fred.stlouisfed.org/series/JTSQUR
- Bureau of Economic Analysis: https://www.bea.gov/data/gdp/gross-domestic-product
- ISM: https://www.ismworld.org/supply-management-news-and-reports/reports/ism-report-on-business/pmi/june/
- ISM: https://www.ismworld.org/supply-management-news-and-reports/reports/ism-report-on-business/services/june/
- Reuters: https://www.reuters.com/markets/switzerland-leads-big-central-banks-rate-cuts-us-fed-lags-2024-06-20/
- Bank of Canada: https://www.bankofcanada.ca/2024/06/fad-press-release-2024-06-05/
- Elizabeth Warren: https://www.warren.senate.gov/newsroom/press-releases/warren-rosen-hickenlooper-push-federal-reserve-to-lower-interest-rates
- Bloomberg: https://www.bloomberg.com/news/articles/2024-04-10/biden-s-battle-against-inflation-gets-tougher-with-latest-data
- Bespoke Investment Group via Connecticut Wealth Management: https://ctwealthmgmt.com/wp-content/uploads/2024/04/Investing-and-Politics.pdf
- Federal Reserve: https://www.federalreserve.gov/newsevents/pressreleases/monetary20120913a.htm
- Federal Reserve: https://www.federalreserve.gov/releases/h41/current/h41.htm
- The Irrelevant Investor (Michael Batnick): https://www.theirrelevantinvestor.com/p/always-hard-beat-market
- CNBC: https://www.cnbc.com/2024/06/21/stocks-are-in-their-longest-stretch-without-a-2percent-sell-off-since-the-financial-crisis.html
- Barron’s: https://www.barrons.com/articles/stock-market-fund-managers-cash-bdadb3b6
- FRED: https://fred.stlouisfed.org/series/BOGZ1FL153064486Q
- U.S. Treasury: https://www.fiscal.treasury.gov/reports-statements/mts/current.html
- Congressional Budget Office: https://www.cbo.gov/publication/60039
- Wall Street Journal: https://www.wsj.com/livecoverage/stock-market-today-dow-sp500-nasdaq-live-07-01-2024/card/bets-on-republican-sweep-drive-treasury-yields-higher-JBN8MQ4fWeTVo2ISHgEJ
- AAA: https://gasprices.aaa.com/
- Visual Capitalist: https://www.visualcapitalist.com/2024-global-elections-by-country/
Index Definitions
The S&P 500 Index is widely regarded as the best single gauge of the United States equity market. It includes 500 leading companies in leading industries of the U.S. economy. The S&P 500 focuses on the large cap segment of the market and covers approximately 75% of U.S. equities.
The Bloomberg Barclays U.S. Aggregate Index represents securities that are SEC-registered, taxable, and dollar denominated. The index covers the U.S. investment grade fixed rate bond market, with index components for government and corporate securities, mortgage pass-through securities, and asset-backed securities. Duration is roughly 5 years.
The Bloomberg U.S. Corporate High Yield Bond Index measures the USD-denominated, high yield, fixed-rate corporate bond market. Securities are classified as high yield if the middle rating of Moody’s, Fitch and S&P is Ba1/BB+/BB+ or below. Bonds from issuers with an emerging markets country of risk, based on the indices’ EM country definition, are excluded.
The Russell 1000® Value Index measures the performance of the large-cap value segment of the U.S. equity universe. It includes those Russell 1000 companies with lower price-to-book ratios and lower expected and historical growth rates.
The Russell 1000® Growth Index measures the performance of the large- cap growth segment of the US equity universe. It includes those Russell 1000 companies with relatively higher price-to-book ratios, higher I/B/E/S forecast medium term (2 year) growth and higher sales per share historical growth (5 years).
The Russell 2000® Index measures the performance of the small-cap segment of the US equity universe. It includes approximately 2000 of the smallest US equity securities in the Russell 3000 Index based on a combination of market capitalization and current index membership. The Russell 2000 Index represents approximately 10% of the total market capitalization of the Russell 3000 Index. Because the Russell 2000 serves as a proxy for lower quality, small cap stocks, it provides an appropriate benchmark for RMB Special Situations.
MSCI EAFE Index*: an equity index which captures large and mid-cap representation across 21 of 23 Developed Markets countries around the world, excluding the U.S. and Canada. With 926 constituents, the index covers approximately 85% of the free float-adjusted market capitalization in each country.
The MSCI Emerging Markets Index* measures equity market performance in the global emerging markets universe. It covers over 2,700 securities in 21 markets that are currently classified as EM countries. The MSCI EM Index universe spans large, mid and small cap securities and can be segmented across all styles and sectors.
The U.S. Dollar Index is used to measure the value of the dollar against a basket of six foreign currencies: the euro, Swiss franc, Japanese yen, Canadian dollar, British pound, and Swedish krona.
The Deutsche Bank EM FX Equally Weighted Spot Index, an equal-weighted basket of 21 emerging market currencies.
MSCI U.S. REIT Index is a free float-adjusted market capitalization weighted index that is comprised of equity Real Estate Investment Trusts (REITs). The index is based on the MSCI USA Investable Market Index (IMI), its parent index, which captures the large, mid and small cap segments of the USA market. With 150 constituents, it represents about 99% of the US REIT universe and securities are classified under the Equity REITs Industry (under the Real Estate Sector) according to the Global Industry Classification Standard (GICS®), have core real estate exposure (i.e., only selected Specialized REITs are eligible) and carry REIT tax status.
Disclaimers
Performance Disclosures
All market pricing and performance data from Bloomberg, unless otherwise cited. Asset class and sector performance are gross of fees unless otherwise indicated.
The opinions and analyses expressed in this newsletter are based on Curi RMB Capital, LLC’s (“Curi RMB”) research and professional experience are expressed as of the date of our mailing of this newsletter. Certain information expressed represents an assessment at a specific point in time and is not intended to be a forecast or guarantee of future results, nor is it intended to speak to any future time periods. Curi RMB makes no warranty or representation, express or implied, nor does Curi RMB accept any liability, with respect to the information and data set forth herein, and Curi RMB specifically disclaims any duty to update any of the information and data contained in this newsletter. The information and data in this newsletter does not constitute legal, tax, accounting, investment or other professional advice. Returns are presented net of fees. An investment cannot be made directly in an index. The index data assumes reinvestment of all income and does not bear fees, taxes, or transaction costs. The investment strategy and types of securities held by the comparison index may be substantially different from the investment strategy and types of securities held by your account. RMB Asset Management is a division of Curi RMB Capital.