


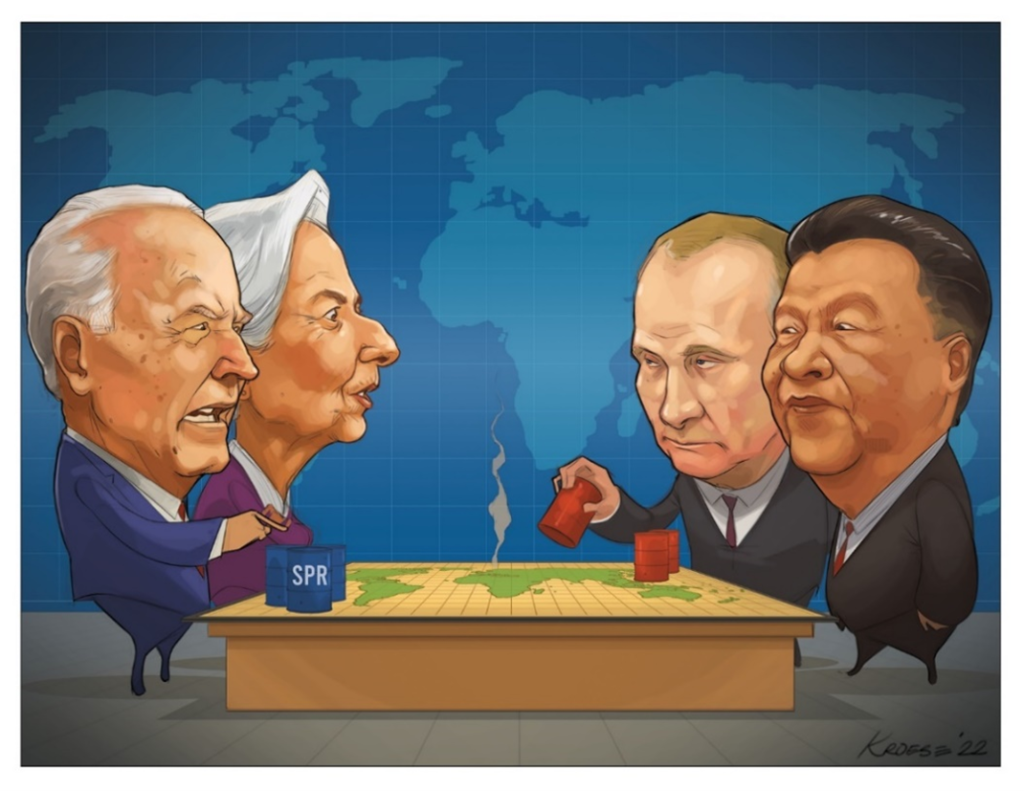
Global Chess
For years, pundits and historians have compared war to a game of chess, comparing the intense strategy and sometimes inscrutable moves that characterized each theater.
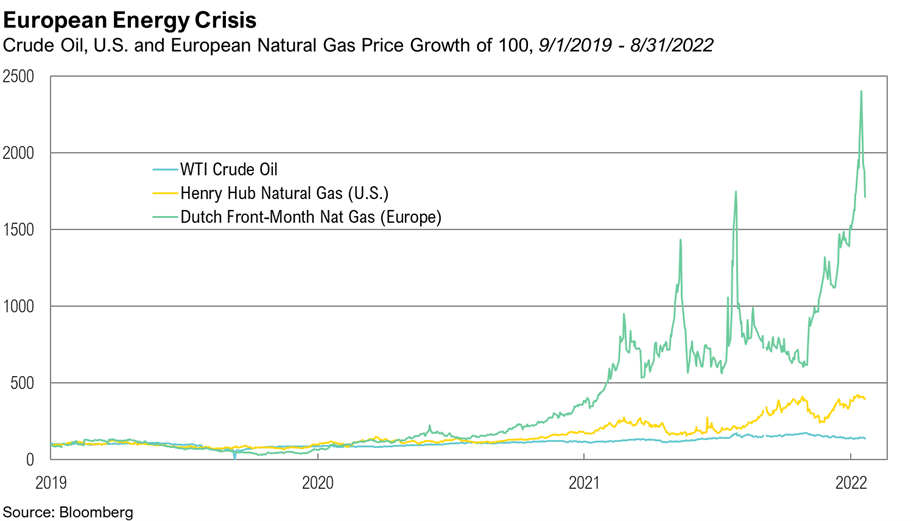
This year has seen a terrible real-world game of chess played by global superpowers with untold human cost, accompanied by plenty of alleged conspiracies and back-door dealing. Although the consequences of this conflict are global, the epicenter is Europe. Ukraine is resolutely defending itself from an attack from Russia, Russia is dealing with severe sanctions, and western Europe is bracing for a winter cut off from Russian gas and fuel. Economies have been strained to breaking points, and unexpected alliances have been forged as global powers seek to align themselves with trading partners and secure access to the fossil fuels needed to heat homes, power their heavy industries, and maintain economic growth.
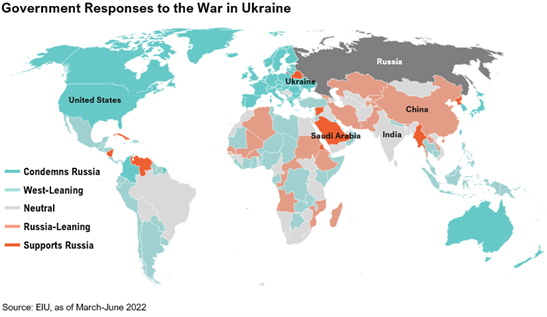
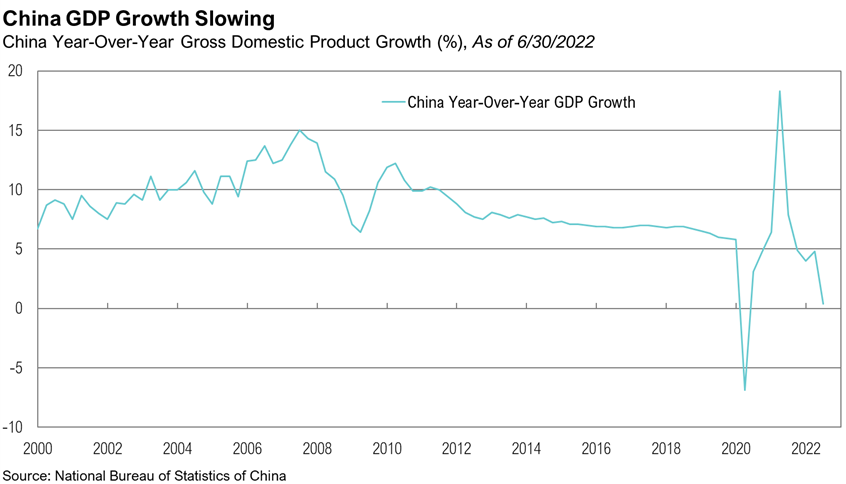
Although a continent away, China remains an active participant in the conflict, given its financial ties to Russia. With Chinese economic growth lower than at any point in the past three decades (excluding 2020), Chinese President Xi Jinping has been subtly strengthening the Middle Kingdom’s relationship with Russia.3 After the invasion of Ukraine, many nations cut back on Russian oil and gas and implemented other forms of financial restrictions.4 In contrast, China stepped in to fill the void by buying Russian oil at steep discounts, thereby providing Russian energy companies (and the state indirectly) with the much-needed cash flow to keep the Russian economy running.5 As a result, Russian oil revenues have risen 38% from a year earlier due to both higher oil prices and increased volumes from Asian buyers.6 Russia has returned the favor by upping its imports of Chinese goods and renewing its interest in the yuan, causing Russian trading of the yuan to rise by more than 40x since the start of the year.8 Putin has gone as far as reviving a plan to issue yuan-denominated debt and considering a plan to buy as much as $70 billion in yuan and other “friendly” currencies to weaken the surging ruble to make Russian exports more attractive to trading partners.9
The U.S. has possibly intensified the situation through its recent dealings with Taiwan. Speaker of the U.S. House of Representatives, Nancy Pelosi, visited the self-governing island in early August, representing the first high-ranking U.S. officer to visit since Newt Gingrich in 1997.10 China claims Taiwan as part of its territory and serves as a fundamental part of the ruling communist party’s “One China” ideology. President Xi Jinping responded to Pelosi’s visit with a series of military drills, asserting that China would safeguard its “national sovereignty and territorial integrity” over Taiwan and warning the U.S repeatedly to stop meddling in Taiwan-China affairs.11, 12 The U.S hasn’t been deterred thus far. Since Pelosi’s visit, several other U.S. leaders have made trips to Taiwan, and on September 2, the U.S. approved a $1.1 billion sale of new weapons and military logistics to bolster Taiwan’s defenses.13
As this dangerous game of chess has drawn on, both sides have become more desperate to use their dwindling pieces carefully and pull other players in. In a move that is frustrating to the U.S. administration, Russia continues to strengthen its ties to Saudi Arabia. This alliance is of crucial strategic importance since the two countries are responsible for over 20% of global oil and natural gas production.14,15 It was recently disclosed that Kingdom Holding, one of Saudi Arabia’s highest-profile investors, invested $500 million in Russian state-owned energy companies shortly before the invasion of Ukraine this year, including $364 million in Gazprom.16 The two nations cooperate closely on oil production through the OPEC+ group, collectively producing 44 million barrels of oil/day, 43% of global production.17 The nations in OPEC+ also represent 41% of global natural gas production per year.15 In early August, OPEC+ decided to increase production by a lower-than-expected 100,000 barrels per day due to market uncertainties.18
To combat OPEC+ production cuts, Biden has used the Strategic Petroleum Reserve (SPR) as a key chess piece, drawing down the reserve by as much as 10 million barrels per week in August.20 All told, Biden has released nearly 200 million barrels of the SPR this year, representing 31% of its total supply. No doubt, this is alleviating the pain of higher energy prices in the short term, but it remains to be seen how this will help in the longer term, specifically where the pain of energy shortages are most acute—in Europe. If record-high gas prices, which forced plant shutdowns in Germany, and a steady stream of stories of exorbitant energy bills across Europe were not enough, on September 2, Russia’s Gazprom PJSC made a last-minute decision not to turn the critical Nord Stream Pipeline back on after three days of maintenance, further restricting painfully constrained supply levels heading into the winter months.21,22
China’s Economic Woes
From an economic standpoint, this global conflict has no apparent winners. China, the second-largest economy in the world, grew just 0.4% in the second quarter from a year prior, representing its second-lowest quarterly growth rate since at least 1992.3 While export growth remained robust at 4%, import growth slowed to just 1% in July, another sign of weakening domestic demand.23 At least some of China’s current economic pain is self-inflicted, as a draconian “zero-COVID” policy has caused rolling lockdowns, which have impacted city after city and affected more than 50 million people.
President Xi and the Chinese Communist Party (CCP) apparently have priorities other than raw economic growth for the time being. In a high-level meeting of the CCP in late July, the state media said China will “try hard to achieve the best possible results for the economy this year,” dropping any mention of the country’s 5.5% growth target.25 That stance was solidified the following week, when Chinese leaders reiterated “their GDP goal is a guidance, not a hard target” and that there won’t be penalties handed out to state officials for failing to achieve it.26
If CCP anti-growth policies remain in place for the foreseeable future, the global economy will certainly feel the impact. The most worrisome issue may be the developing Chinese property crisis. Real estate constitutes about one-third of China’s economic activity, and housing accounts for about 70% of household wealth,28 compared to roughly 30% for United States residents,29 which has led some to call the Chinese real estate market the most important sector in the world.30 As a result of government regulation, Chinese homeowners are struggling to pay their mortgages. The situation has gotten to a point where hundreds of thousands of homeowners are banding together and refusing to repay loans on unfinished properties.28 The public outcry has forced the CCP to act to stabilize the housing market, announcing several stimulative measures, including a surprise rate cut in August, a $146 billion policy package including funds for infrastructure projects, and a mandate for banks to lower rates to make mortgages cheaper.31,32 The CCP has even considered a mortgage grace period for homebuyers. However, this action would force banks to forfeit $4.6 billion of interest income.33 With the homeowner being the target of government stimulus, institutional investors and developers have been left to fend for themselves. Additionally, Housing sector woes are beginning to spill over into the banking sector. Chinese banks saw their bad loans increase to $426 billion in the first half of 2022.37
Markets
If there is a silver lining to the strained geopolitical environment, it is the increase in the perceived value of the dollar, which is on a historic run. Through August, the U.S. Dollar Index, which measures the value of the dollar compared to a basket of developed market currencies, is up 14.5%. For perspective, if the dollar were to end the year at current levels, it would mark its best annual return since 1983. Emerging market currencies have fared poorly, if not as bad as their developed peers, down 6.9% year-to-date relative to the dollar, as measured by the Deutsche Bank EM FX Equally Weighted Spot Index, an equal-weighted basket of 21 emerging market currencies. Poor foreign exchange performance has been the reason why. Despite less technology exposure, both the MSCI EAFE and MSCI Emerging Market Indexes have underperformed their U.S. counterparts this year.
Weaker foreign currencies make imports by these countries more expensive and exacerbates inflation in their domestic economies. In Europe, the European Central Bank was forced to hike interest rates by 75 basis points, its biggest hike ever, amidst an energy crisis and a potential recession due to high energy prices, which are priced in U.S. dollars. Many emerging market countries price their bonds in U.S. dollar terms, meaning that when the dollar appreciates, it makes it more difficult for them to pay their obligations to investors. Lastly, the dollar rally is creating problems for the countries that peg their local currency to the dollar. While China no longer employs a strict peg, the PBOC has generally kept the local currency trading between $6 and $7 since 2010. In 2022, the yuan has depreciated 7.9% against the dollar and trades in the upper end of that range at $6.90 as of the end of August. While a weaker yuan boosts the demand for Chinese exports, depreciation may act as a catalyst for further capital outflows. As a result, the PBOC set its strongest yuan fix against the dollar since 2019 in an effort to strengthen the currency.
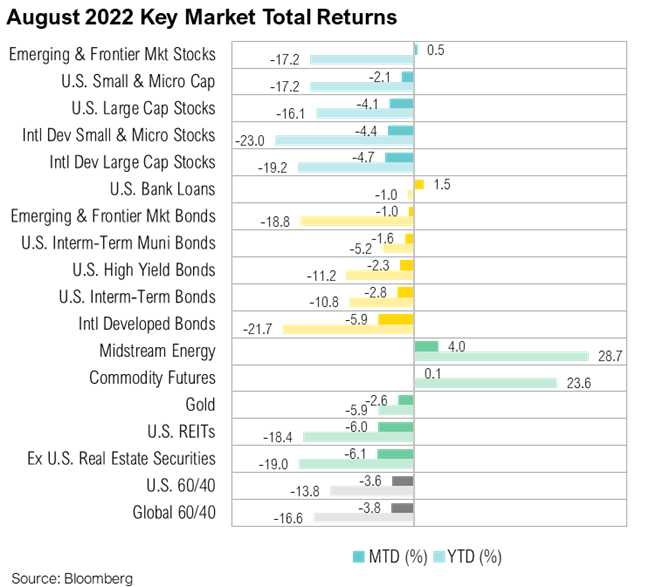
The S&P 500 gave back some of its July rally, falling 4.1% in August. From a style perspective, value stocks outperformed growth stocks, as the Russell 1000® Value Index fell 3.0%, while the Russell 1000® Growth Index fell 4.7%. Small cap stocks beat large cap stocks by 2%, returning -2.1%, as proxied by the Russell 2000® Index. Within real assets, midstream energy was once again a top performer for the month, returning 4.0%. Year to date, the industry has returned 28.7%, outperforming the S&P 500 by 44.8%. Real estate had a difficult month, returning -6.0%, proxied by the MSCI U.S. REIT Index, as mortgage rates continued their rapid ascent. The average 30-year fixed rate mortgage hit 6.1% on September 8, its highest level since November 2008.
U.S. fixed income gave back all its July gains with the Bloomberg U.S. Aggregate Bond Index down 2.8%, as yields reversed course and moved higher once again. The 10-year U.S. treasury rate rose 48 basis points to 3.15%, and the 2-year rate rose 56 basis points to 3.45%. The yield curve remains deeply inverted with the spread between these two rates sitting at -30 basis points. The 2-year is now at a 15-year high, last seeing these levels in August 2007. U.S. high yield credit spreads were just 20 basis points higher at 5.0% but were volatile throughout the month, tightening to as low as 4.2% before widening once again. The Bloomberg U.S. Corporate High Yield Bond Index fell 2.3% as a result. Bank loans were one of the few asset classes in positive territory for the month, gaining 1.5%, as their floating-rate structure acts as a hedge in rising rate environments.
Looking Forward
It is our belief that the year has been dogged by central banks’ erroneous belief that inflation was transitory, and the pain of this miscalculation has since been further exacerbated by a series of geopolitical shocks. For the first six months of the year, the growing awareness of stubbornly high inflation drove almost all asset prices lower. After some of the worst investor sentiment readings in decades, hopes for a Fed pivot propelled a powerful rally in mid-June that saw the S&P 500, which was down 24% at its low, retrace more than half of that decline. This rally eased credit spreads and brightened financial conditions, pulling inflation expectations higher with it—the opposite of the Fed’s desired outcome. In response, Fed Chairman Powell delivered a blunt confirmation at Jackson Hole that the priority would be to slow demand in order to curtail inflation, even if that resulted in economic pain. Markets initially declined rapidly on these comments, but then rebounded modestly until the CPI release on September 13th. The latest monthly number surprised to the upside and showed that inflation remained strong. As a result of the stronger than expected inflation print, the S&P 500 was down over 4% and interest rates rose significantly, with the 2-year U.S. Treasury yield reaching its highest level in nearly 15 years. The Federal Open Market Committee (FOMC) is meeting September 20-21 and the market expects a minimum increase of 0.75% but given the uptick in inflation, a 1.00% increase is not off the table. In view of the current landscape, we believe that, if inflation does not ease rapidly, it will be challenging for the Fed to prevent a recession.
As complex as the investing backdrop is in the U.S., it is far trickier abroad. Other economies are fighting similar challenges as the U.S. is, but without the luxury of energy or food security. In Europe, exorbitant energy prices are weighing heavily on economic activity, and there is considerable concern about what will transpire if the war is not resolved before the winter.
We continue to position portfolios for a range of possible outcomes, but still believe it is premature to signal the all-clear and aggressively deploy capital into risky assets—especially as each rate hike increases the hurdle rate for all investments and makes lower risk substitutes across the fixed income and credit spectrum more attractive.
At RMB, we believe there will be continued volatility in both equity and fixed income markets. High inflation combined with a strong labor market will likely continue to put pressure on the Federal Reserve to remain on their path of increasing short-term interest rates in the coming months. We believe that incoming inflation data and the central bank responses over the next few months remain crucial to determining where the economy—and markets—are headed. Uncertainty about the outlook for the global economy remains elevated and risks in the short-term are increasing. At RMB, we continue to believe that strong fundamentals should help markets over the longer term and that the income component of our client’s investment portfolios – the interest paid from owning bonds and stock dividends – will be a more important factor of investment returns going forward. To help weather the short-term volatility we are likely to experience in the coming months, we continue to recommend clients stick to their long-term investment allocation targets and use the market volatility to their benefit by taking advantage of rebalancing opportunities to selectively make changes within portfolios. During volatile times, the one of the keys to successful investing is often remaining calm and committed to long-term investment plans. We remain optimistic that the strategies we have in place for our clients will drive long-term success despite the volatility we are currently experiencing.
Citations
1. Chess24.com: https://chess24.com/en/read/news/sinquefield-cup-3-niemann-beats-carlsen-to-cross-2700
2. Guardian: https://www.theguardian.com/sport/2022/sep/09/chess-hans-niemann-hits-back-over-cheating-controversy-in-st-louis
3. Trading Economics: https://tradingeconomics.com/china/gdp-growth-annual
4. Forbes: https://www.forbes.com/sites/katharinabuchholz/2022/06/15/which-countries-are-ditching-russian-fossil-fuels-infographic/?sh=61a3dd1d200a
5. Aljazeera: https://www.aljazeera.com/economy/2022/7/6/russia-pockets-24b-from-selling-energy-to-china-india
6. Aljazeera: https://www.aljazeera.com/economy/2022/8/17/russia-sees-38-rise-in-energy-export-earnings-this-year-reuters
7. Bloomberg: https://www.bloomberg.com/news/articles/2022-08-04/zelenskiy-seeks-direct-talks-with-xi-amid-war-with-russia
8. Bloomberg: https://www.bloomberg.com/news/articles/2022-08-24/russia-s-local-debt-revival-has-a-place-reserved-for-yuan-bonds
9. Bloomberg: https://www.bloomberg.com/news/articles/2022-09-01/russia-mulls-buying-70-billion-in-yuan-friendly-currencies
10. Washington Post: https://www.washingtonpost.com/world/2022/08/01/nancy-pelosi-taiwan-china/
11. Ministry of Foreign Affairs of the People’s Republic of China: https://www.fmprc.gov.cn/eng/zxxx_662805/202208/t20220802_10732293.html
12. Reuters: https://www.reuters.com/world/asia-pacific/taiwan-will-continue-work-with-us-bolstering-its-defences-president-says-2022-08-23/
13. WSJ: https://www.wsj.com/articles/u-s-approves-1-billion-in-arms-sales-to-taiwan-11662166386
14. EIA: https://www.eia.gov/tools/faqs/faq.php?id=709&t=6
15. Atlas Big: https://www.atlasbig.com/en-cn/countries-natural-gas-production
16. FT: https://www.ft.com/content/c743f14c-b284-4ec4-93f9-2df600d31a89
17. EIA: https://www.eia.gov/opendata/v1/qb.php?category=829746
18. Energy Intel: https://www.energyintel.com/00000182-637c-d9e9-af9e-fbfdc52a0000
19. NYT: https://www.nytimes.com/2022/09/05/business/opec-plus-meeting.html
20. EIA: https://www.eia.gov/dnav/pet/hist/LeafHandler.ashx?n=PET&s=WCSSTUS1&f=W
21. REMIX: rmx.news/article/production-in-germany-is-no-longer-competitive-ceo-at-worlds-largest-steel-manufacturer-warns-of-crisis-as-plants-shut-down/
22. Bloomberg: https://www.bloomberg.com/news/articles/2022-09-05/european-gas-jumps-as-moscow-tightens-the-screw-on-supply
23. Bloomberg: https://www.bloomberg.com/news/articles/2022-07-13/china-exports-in-yuan-rose-about-21-in-june-as-lockdowns-eased
24. Bloomberg: https://www.bloomberg.com/news/articles/2022-09-01/chengdu-fears-shanghai-repeat-as-cities-fall-to-xi-s-covid-zero
25. Reuters: https://www.reuters.com/world/china/china-drops-gdp-target-mention-aims-best-possible-results-instead-2022-07-28/
26. U.S. News: https://money.usnews.com/investing/news/articles/2022-08-02/china-leaders-say-5-5-gdp-growth-is-guidance-not-hard-target-bloomberg-news
27. Bloomberg: https://www.bloomberg.com/news/articles/2022-07-08/beijing-revokes-first-ever-vaccine-mandate-after-public-outcry
28. NYT: https://www.nytimes.com/2022/08/17/business/china-economy-real-estate-crisis.html
29. U.S. Census: https://www.census.gov/content/dam/Census/library/publications/2020/demo/p70br-170.pdf
30. The Economist: https://www.economist.com/finance-and-economics/2021/11/26/measuring-the-universes-most-important-sector
31. Barron’s: https://www.barrons.com/articles/china-infrastructure-spending-stimulus-51661414357
32. CNN: https://www.cnn.com/2022/08/22/economy/china-lpr-rate-cut-property-crisis-intl-hnk/index.html#:~:text=The%20People's%20Bank%20of%20China,lend%20to%20their%20best%20customers.
33. Bloomberg: https://www.bloomberg.com/news/articles/2022-07-19/china-banks-to-forfeit-4-6-billion-on-mortgage-break-citi-says
34. Seeking Alpha: https://seekingalpha.com/article/4529184-hsbc-lifts-key-targets-bid-win-skeptics
35. Fortune: https://fortune.com/2022/09/02/china-property-developers-housing-market-real-estate/
36. WSJ: https://www.wsj.com/articles/china-home-sales-plunge-in-july-as-mortgage-revolt-deters-buyers-11659264152
37. Bloomberg: https://www.bloomberg.com/news/articles/2022-08-30/china-s-icbc-sees-slower-profit-growth-amid-loan-pressure
38. Bloomberg: https://www.bloomberg.com/news/articles/2022-08-30/china-to-require-approvals-for-companies-to-issue-offshore-debt
39. WSJ: https://www.wsj.com/articles/apple-to-cut-new-iphone-14-production-lag-between-india-and-china-11661251562
40. Bloomberg: https://www.bloomberg.com/news/articles/2022-07-28/jeep-pulls-out-of-china-over-government-meddling-in-business
41. The Register: https://www.theregister.com/2022/08/09/alibaba_cuts_jobs/
Index Definitions
The S&P 500 Index is widely regarded as the best single gauge of the United States equity market. It includes 500 leading companies in leading industries of the U.S. economy. The S&P 500 focuses on the large cap segment of the market and covers approximately 75% of U.S. equities.
The Bloomberg Barclays U.S. Aggregate Index represents securities that are SEC-registered, taxable, and dollar denominated. The index covers the U.S. investment grade fixed rate bond market, with index components for government and corporate securities, mortgage pass-through securities, and asset-backed securities. Duration is roughly 5 years.
The Bloomberg U.S. Corporate High Yield Bond Index measures the USD-denominated, high yield, fixed-rate corporate bond market. Securities are classified as high yield if the middle rating of Moody’s, Fitch and S&P is Ba1/BB+/BB+ or below. Bonds from issuers with an emerging markets country of risk, based on the indices’ EM country definition, are excluded.
The Russell 1000® Value Index measures the performance of the large-cap value segment of the U.S. equity universe. It includes those Russell 1000 companies with lower price-to-book ratios and lower expected and historical growth rates.
The Russell 1000® Growth Index measures the performance of the large- cap growth segment of the US equity universe. It includes those Russell 1000 companies with relatively higher price-to-book ratios, higher I/B/E/S forecast medium term (2 year) growth and higher sales per share historical growth (5 years).
The Russell 2000® Index measures the performance of the small-cap segment of the US equity universe. It includes approximately 2000 of the smallest US equity securities in the Russell 3000 Index based on a combination of market capitalization and current index membership. The Russell 2000 Index represents approximately 10% of the total market capitalization of the Russell 3000 Index. Because the Russell 2000 serves as a proxy for lower quality, small cap stocks, it provides an appropriate benchmark for RMB Special Situations.
MSCI EAFE Index*: an equity index which captures large and mid-cap representation across 21 of 23 Developed Markets countries around the world, excluding the U.S. and Canada. With 926 constituents, the index covers approximately 85% of the free float-adjusted market capitalization in each country.
The MSCI Emerging Markets Index* measures equity market performance in the global emerging markets universe. It covers over 2,700 securities in 21 markets that are currently classified as EM countries. The MSCI EM Index universe spans large, mid and small cap securities and can be segmented across all styles and sectors.
The U.S. Dollar Index is used to measure the value of the dollar against a basket of six foreign currencies: the euro, Swiss franc, Japanese yen, Canadian dollar, British pound, and Swedish krona.
The Deutsche Bank EM FX Equally Weighted Spot Index, an equal-weighted basket of 21 emerging market currencies.
MSCI U.S. REIT Index is a free float-adjusted market capitalization weighted index that is comprised of equity Real Estate Investment Trusts (REITs). The index is based on the MSCI USA Investable Market Index (IMI), its parent index, which captures the large, mid and small cap segments of the USA market. With 150 constituents, it represents about 99% of the US REIT universe and securities are classified under the Equity REITs Industry (under the Real Estate Sector) according to the Global Industry Classification Standard (GICS®), have core real estate exposure (i.e., only selected Specialized REITs are eligible) and carry REIT tax status.
*Source: MSCI.MSCI makes no express or implied warranties or representations and shall have no liability whatsoever with respect to any MSCI data contained herein. The MSCI data may not be further redistributed or used as a basis for other indexes or any securities or financial products. This report is not approved, endorsed, reviewed or produced by MSCI. None of the MSCI data is intended to constitute investment advice or a recommendation to make (or refrain from making) any kind of investment decision and may not be relied on as such.
Performance Disclosures
All market pricing and performance data from Bloomberg, unless otherwise cited. Asset class and sector performance are gross of fees unless otherwise indicated.