


Key Takeaways
- As the debt ceiling debate intensifies, Congress remains at an impasse. Treasury Secretary Janet Yellen has advised Congress that the U.S. government may run out of money and technically default on its debt as soon as June 1.
- Inflation continued to moderate, but the 5% year-over-year rate for March remains well above the Fed’s 2% target.
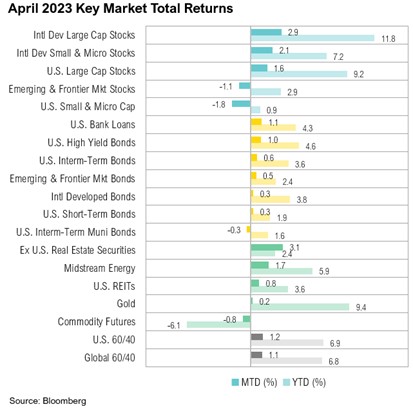
- Both U.S. and international equity markets ended April with positive returns. International markets outperformed their U.S. counterparts. U.S. small cap stocks have wiped out nearly all the gains made this year, ending the month down 1.8% and now only up 0.9% year-to-date.
- We continue to view the stresses facing banks as more of a symptom of the Fed’s rapid rate hiking cycle than systemic solvency risk. Both supply and demand for loans are drying up, with almost half of all banks were tightening standards for commercial and industrial loans.
- We believe that strong fundamentals should help markets over the longer term and that the income component of our clients’ investment portfolios will be a more important factor of investment returns going forward.
Overview
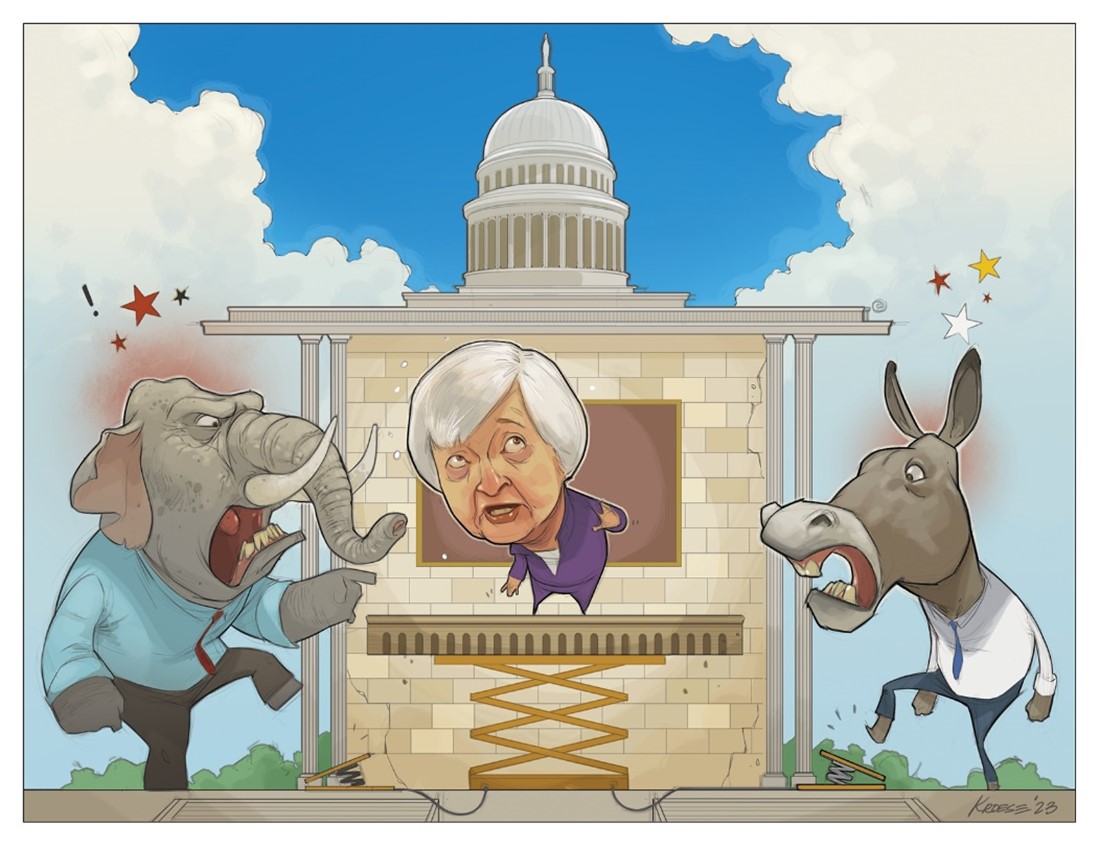
Borrowing the title from the popular series of children’s books, April was notable for a series of unfortunate policy-related events, which could pave the way for a potentially volatile few months for markets. Major players in these events include a Federal Reserve that has been forced to hike interest rates into an economic slowdown, a banking sector facing severe stresses, and a Congress fumbling with how to pay for a budget deficit estimated at $1.4 trillion.1 Unfortunately, in the real world, assigning the role of the antagonist is not as easy as in a story. American consumers are frustrated that the Fed hasn’t done more to address inflation, while markets are frustrated the Fed hasn’t done more to support failing banks. In terms of fiscal policy, both the left and the right sides of the political aisle view each other as the villain—and markets are caught in the middle.
Throughout the month, U.S. markets bounced around on short-term news and ended April with modest gains. The S&P 500 posted a 1.6% gain, bringing year-to-date gains to an impressive 9.2%, while the Bloomberg U.S. Aggregate Bond Index ended the month marginally up 0.6%. Inflation continued to show signs of cooling, as illustrated by a March CPI print of 5.0% year-over-year. While still well above the Federal Reserve’s 2.0% target, this was an improvement from the 8.5% year-over-year increase in March 2022.2
The banking troubles that haunted March continued. On May 1, First Republic Bank collapsed, marking the second-biggest banking failure in U.S. history. Despite borrowing more than $77 billion from the Fed’s discount window and receiving more than $30 billion in rescue funds from other large banks (including Morgan Stanley and Wells Fargo), First Republic could not be saved. It was acquired by JPMorgan, who has assumed the majority of the failed bank’s assets.3 It is estimated that the collapse of First Republic will cost the FDIC approximately $13 billion.4
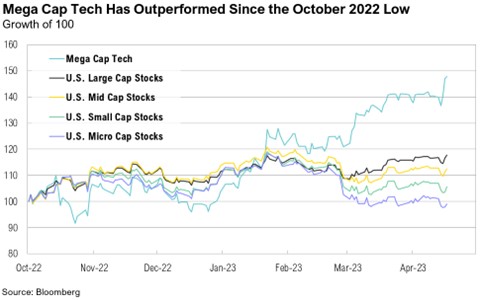
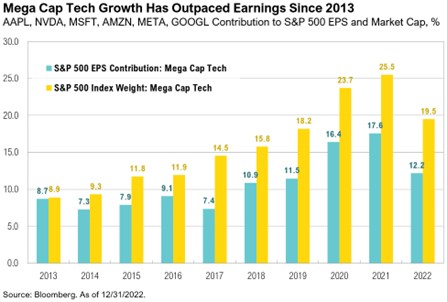
Although the S&P 500 was up 9.2% year-to-date through April, this headline strength is not indicative of the average public company’s performance. Rather, a handful of Mega Cap Tech stocks (including Meta, Apple, and Microsoft) are largely responsible for recent market gains. Microsoft and Apple alone constitute nearly half of this year’s gains, and together the two companies account for 14.0% of the S&P 500—the largest concentration of two companies in the index on record.5,6
First-quarter earnings season kicked off in April, and more than half (53%) of S&P 500 companies have already reported earnings. For the first and second quarters of 2023, analysts are projecting year-over-year earnings declines of -3.7% and -5.0% respectively, as well as a marginal full-year 2023 estimated earnings increase of 1.2%.7 Unfortunately, this is less than expectations at the start of the year, when full-year 2023 earnings were projected to increase by 3.4%.8
A Series of Unfortunate Events
The debt ceiling has once again dominated headlines. As a quick refresher, the debt ceiling is the total amount of money that the U.S. government is authorized to borrow to meet its existing legal obligations, such as Social Security, Medicare, military salaries, interest payments on national debt, and tax refunds.9 Since 1960, Congress has raised the debt ceiling 78 times—49 times under Republican presidents and 29 times under Democratic presidents—with minimal debate.9 This time, however, Congress has reached an impasse, unable to come to an agreement to either raise or suspend the debt ceiling.
The argument over whether to raise the debt limit is a political battle with implications for next year’s presidential election. On one side, Republicans argue that raising the debt ceiling without any strings will encourage reckless spending and that Democrats need to cut spending and reduce the U.S. debt load.10 On the other side, Democrats argue that cutting government spending now will have disastrous effects for the basic functioning of the U.S. government, the public healthcare system, and will push the U.S. into a crisis.11
Once the debt ceiling has been reached, Treasury can use a variety of “extraordinary accounting measures” to lower debt levels and avoid running out of cash and risking a technical default on its debt. On January 26, the U.S. officially hit its debt ceiling, and Treasury activated these “extraordinary measures” to improve liquidity. Treasury had been hopeful for another good year of tax receipts (Tax Day 2022 brought in more than $263 billion).12 Instead, however, Treasury cash balances only increased by $108 billion.13 Treasury announced that it expects to borrow $726 billion in the second quarter, a borrowing estimate that is $449 billion higher than announced in January 2023, due to lower cash balances, lower receipts, and higher outlays.14
On Monday May 1, Treasury Secretary Janet Yellen published a letter addressed to Congress that stated that the U.S. government may run out of money and technically default on its debt as soon as June 1.15 In her letter, Secretary Yellen explained that:
“After reviewing recent federal tax receipts, our best estimate is that we will be unable to continue to satisfy all of the government’s obligations by early June, if Congress does not raise or suspend the debt limit before that time… Given the current projections, it is imperative that Congress act as soon as possible.” 16
The letter spurred President Biden to invite House Speaker Kevin McCarthy and other top congressional leaders to the White House in the coming week to discuss and hopefully agree to raise the debt ceiling before June 1.17 In her letter, Yellen emphasized the importance of an agreement being reached:
“We have learnt from past debt limit impasses that waiting until the last minute to suspend or increase the debt limit can cause serious harm to business and consumer confidence, raise short-term borrowing costs for taxpayers, and negatively impact the credit rating of the United States.” 16
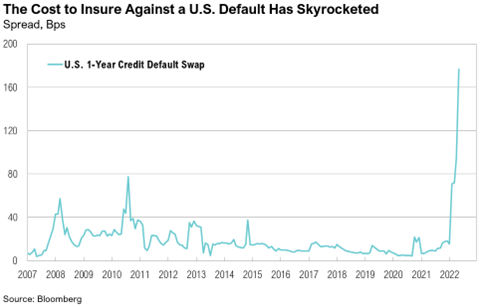
The debt ceiling drama caused some unusual distortions in Treasury markets late in the month, especially in short-term Treasury bills. The divergence between the one-month and three-month T-bills extended to the largest on record, as the spread between the three-month minus the one-month T-bill yields peaked at 1.72% on April 20. Further, the cost to insure against a default by the U.S. government, proxied by pricing in U.S. credit default swaps (CDS), spiked to the highest levels on record.
Unstoppable Tech
Despite uninspiring first quarter earnings results, investors appear to have focused their attention on a half-dozen large technology and consumer-related companies. These “Mega Cap Tech” companies—Microsoft, Apple, Meta, Amazon, Alphabet, and Nvidia—have contributed an estimated 9.0% of the market’s 9.2% return so far in 2023 and now represent a combined 24% of the S&P 500.18
Microsoft, whose share price increased more than 8% after its earnings announcement, reported 7.1% year-over-year revenue growth for the quarter and beat earnings estimates by almost 10% ($2.45 vs. the expected $2.23).19 Alphabet has authorized a $70 billion stock buyback and reported a 2.6% year-over-year revenue growth, beating earnings per share expectations by 9% ($1.17 vs. the expected $1.07).20 Apple’s total revenue declined 3.0% over the quarter, falling from $97.3 billion to $94.8 billion.21 Similar to Alphabet, Apple also announced a $90 billion buyback on its quarterly earnings call.21 Meta exceeded earnings per share expectations by an impressive 31% ($2.54 vs. the expected $1.95) as its commitment to increase efficiency by cutting more than 21,000 jobs seemed to be paying off. Meta reported 2.6% year-over-year revenue growth, though the company’s Reality Labs continued to incur significant losses—more than $4 billion over the quarter.22 Company management will continue to ramp up investment in this new division of the company and therefore expects losses to accelerate throughout the year.22 Nvidia does not report its earnings until May 24, but its share price rose 4% over the month.
Four of these Mega Cap Tech companies—Meta, Microsoft, Alphabet, and Amazon—collectively mentioned the term “AI” no less than 168 times in their first-quarter earnings calls.23 CEOs and investors alike are increasingly focusing on how this rapidly evolving technology might add value to large technology companies, from boosting efficiency to pushing the boundaries of technological innovations. As Microsoft CEO Satya Nadella puts it: “I have never felt this liberated in terms of opportunity in the days ahead.”24
This behavior is reminiscent of an investing aphorism that warns, “In a bear market, the generals get shot last.”25 In other words, during the early phases of a bear market, large-cap market leaders might outperform, but they will eventually be dragged down by broader negative sentiment and economic headwinds. It remains to be seen whether this dynamic will play out in 2023 or if these global companies can return to their above-average growth rates of the past.
Markets
Both U.S. and international equity markets ended April with positive returns. International markets outperformed their U.S. counterparts. The MSCI EAFE ended the month up 2.9% while the S&P 500 posted a 1.6% gain. The Bloomberg U.S. Aggregate Bond Index ended the month with a marginal 0.6% gain, and international developed market bonds ended the month up 0.3%.
Small cap stocks have wiped out nearly all the gains made this year, ending the month down 1.8% and now only up 0.9% year-to-date. Uncertainty regarding the ongoing banking sector turmoil and the future of the Fed’s monetary policy have weighed heavily on U.S. small and micro-cap stocks because debt dynamics, higher-for-longer borrowing costs, and a potentially looming credit crunch place more pressure on smaller companies.26
Looking Forward
We continue to view the stresses facing banks as more of a symptom of the Fed’s rapid rate hiking cycle than systemic solvency risk, but that may not matter if deposits continue to flee the punishingly low deposit rates paid by the banks. As the crisis has continued in an environment of sharply higher interest rates, both supply and demand for loans are drying up. The most recent Senior Loan Officer Survey, released by the Fed on May 8, showed that almost half of all banks were tightening standards for commercial and industrial loans.27 These levels are some of the worst in the past 20 years, only matched or eclipsed during the Global Financial Crisis and COVID-19 pandemic.
Although there is no predefined path for policy or markets, we remain focused on the risks and opportunities this environment is presenting. At RMB, we believe there will be continued volatility in both equity and fixed income markets, as the Federal Reserve continues with their plan to increase interest rates in order to mitigate above average inflation. The labor market has thus far remained resilient but initial jobless claims are showing signs of weakness over the last few weeks. Inflation has declined from peak levels seen last summer but is proving to be stickier than the Fed would like. The trajectory of inflation from here appears to be downward, but the pace at which the declines occur remains a key component to Federal Reserve policy going forward.
Incoming economic data and the policy developments they help shape are fluid and highly uncertain. While we wait for clarity on these topics, for the first time in more than 15 years, we can earn 4% to 5% on short-term government bonds. We continue to believe that strong fundamentals should help markets over the longer term and that the income component of our clients’ investment portfolios – the interest paid from owning bonds and stock dividends – will be a more important factor of investment returns going forward. While we think that the longer-term outlook will continue to improve with higher yields and stocks getting cheaper, we would caution that 2023 could be another challenging year for investors. We recommend sticking to long-term investment allocation targets through a diversified portfolio of assets that emphasizes quality and cash flow and taking advantage of rebalancing opportunities as they emerge amongst the volatility. We remain optimistic that the strategies we have in place for our clients will drive long-term success despite the volatility we are currently experiencing.
The final book in the popular A Series of Unfortunate Events books by Daniel Handler is titled, The End of Prosperity, but we do not think investors need to resign themselves to this outcome. The Baudelaire children survived the series by drawing on their courage, adaptability, and resourcefulness. We think investors could learn from them.
Citations
- CBO: https://www.cbo.gov/topics/budget
- Bureau of Labor Statistics: https://www.bls.gov/bls/news-release/cpi.htm
- New York Times: https://www.nytimes.com/2023/05/01/business/dealbook/jpmorgan-first-republic-rescue.html
- Washington Post: https://www.washingtonpost.com/business/2023/05/01/firstrepublic-fdic-jpmorgan/
- Financial Times: https://www.ft.com/content/b760c871-6812-4409-ba76-1e4a67f8b7e7
- Bloomberg: https://www.bloomberg.com/news/articles/2023-04-28/apple-and-microsoft-hold-record-sway-over-s-p-500-tech-watch#xj4y7vzkg
- FactSet: https://insight.factset.com/sp-500-earnings-season-update-april-28-2023
- FactSet: https://insight.factset.com/sp-500-earnings-season-update-january-27-2023
- U.S. Treasury: https://home.treasury.gov/policy-issues/financial-markets-financial-institutions-and-fiscal-service/debt-limit
- Reuters: https://www.reuters.com/world/us/why-republican-hardliners-can-afford-push-us-brink-default-2023-02-14/
- NY Times: https://www.nytimes.com/2023/01/11/us/politics/debt-ceiling-economy-congress.html
- U.S. Treasury: https://fiscaldata.treasury.gov/datasets/daily-treasury-statement/operating-cash-balance
- Bloomberg: https://www.bloomberg.com/news/articles/2023-04-19/us-cash-pile-jumps-108-billion-on-tax-day-amid-debt-cap-concern#xj4y7vzkgb
- U.S. Treasury: https://home.treasury.gov/news/press-releases/jy1453
- WSJ: https://www.wsj.com/articles/treasury-secretary-janet-yellen-says-u-s-could-default-as-soon-as-june-1-without-a-debt-ceiling-increase-6714ed7c?mod=economy_lead_pos2
- U.S. Treasury: https://home.treasury.gov/news/press-releases/jy1454
- Washington Post: https://www.washingtonpost.com/business/2023/05/01/congress-debt-limit-deadline-biden-mccarthy/
- Morningstar: https://www.morningstar.com/etfs/arcx/ivv/portfolio
- Microsoft: https://www.microsoft.com/en-us/Investor/earnings/FY-2023-Q3/press-release-webcast
- Alphabet: https://abc.xyz/investor/static/pdf/2023Q1_alphabet_earnings_release.pdf?cache=0924ccf
- Apple: https://www.apple.com/newsroom/2023/05/apple-reports-second-quarter-results/
- Meta: https://investor.fb.com/financials/default.aspx
- Business Insider: https://www.businessinsider.com/tech-giants-mentioned-ai-168-times-on-earnings-calls-2023-4
- CNBC: https://www.cnbc.com/2023/02/07/microsoft-ceo-satya-nadella-calls-ai-search-biggest-thing-in-15-years.html
- Business Live: https://www.businesslive.co.za/fm/opinion/2022-11-03-jean-pierre-verster-the-new-stock-market-generals/
- Financial Times: https://www.ft.com/content/28b47031-44bb-44e1-acb6-67142c4fb3e9
- Axios: https://www.axios.com/2023/05/08/us-bank-lenders-fed-loans
Index Definitions
The S&P 500 Index is widely regarded as the best single gauge of the United States equity market. It includes 500 leading companies in leading industries of the U.S. economy. The S&P 500 focuses on the large cap segment of the market and covers approximately 75% of U.S. equities.
The Bloomberg Barclays U.S. Aggregate Index represents securities that are SEC-registered, taxable, and dollar denominated. The index covers the U.S. investment grade fixed rate bond market, with index components for government and corporate securities, mortgage pass-through securities, and asset-backed securities. Duration is roughly 5 years.
The Bloomberg U.S. Corporate High Yield Bond Index measures the USD-denominated, high yield, fixed-rate corporate bond market. Securities are classified as high yield if the middle rating of Moody’s, Fitch and S&P is Ba1/BB+/BB+ or below. Bonds from issuers with an emerging markets country of risk, based on the indices’ EM country definition, are excluded.
The Russell 1000® Value Index measures the performance of the large-cap value segment of the U.S. equity universe. It includes those Russell 1000 companies with lower price-to-book ratios and lower expected and historical growth rates.
The Russell 1000® Growth Index measures the performance of the large- cap growth segment of the US equity universe. It includes those Russell 1000 companies with relatively higher price-to-book ratios, higher I/B/E/S forecast medium term (2 year) growth and higher sales per share historical growth (5 years).
The Russell 2000® Index measures the performance of the small-cap segment of the US equity universe. It includes approximately 2000 of the smallest US equity securities in the Russell 3000 Index based on a combination of market capitalization and current index membership. The Russell 2000 Index represents approximately 10% of the total market capitalization of the Russell 3000 Index. Because the Russell 2000 serves as a proxy for lower quality, small cap stocks, it provides an appropriate benchmark for RMB Special Situations.
MSCI EAFE Index*: an equity index which captures large and mid-cap representation across 21 of 23 Developed Markets countries around the world, excluding the U.S. and Canada. With 926 constituents, the index covers approximately 85% of the free float-adjusted market capitalization in each country.
The MSCI Emerging Markets Index* measures equity market performance in the global emerging markets universe. It covers over 2,700 securities in 21 markets that are currently classified as EM countries. The MSCI EM Index universe spans large, mid and small cap securities and can be segmented across all styles and sectors.
The U.S. Dollar Index is used to measure the value of the dollar against a basket of six foreign currencies: the euro, Swiss franc, Japanese yen, Canadian dollar, British pound, and Swedish krona.
The Deutsche Bank EM FX Equally Weighted Spot Index, an equal-weighted basket of 21 emerging market currencies.
MSCI U.S. REIT Index is a free float-adjusted market capitalization weighted index that is comprised of equity Real Estate Investment Trusts (REITs). The index is based on the MSCI USA Investable Market Index (IMI), its parent index, which captures the large, mid and small cap segments of the USA market. With 150 constituents, it represents about 99% of the US REIT universe and securities are classified under the Equity REITs Industry (under the Real Estate Sector) according to the Global Industry Classification Standard (GICS®), have core real estate exposure (i.e., only selected Specialized REITs are eligible) and carry REIT tax status.
*Source: MSCI.MSCI makes no express or implied warranties or representations and shall have no liability whatsoever with respect to any MSCI data contained herein. The MSCI data may not be further redistributed or used as a basis for other indexes or any securities or financial products. This report is not approved, endorsed, reviewed or produced by MSCI. None of the MSCI data is intended to constitute investment advice or a recommendation to make (or refrain from making) any kind of investment decision and may not be relied on as such.
Performance Disclosures
All market pricing and performance data from Bloomberg, unless otherwise cited. Asset class and sector performance are gross of fees unless otherwise indicated.
The opinions and analyses expressed in this newsletter are based on RMB Capital Management, LLC’s (“RMB Capital”) research and professional experience are expressed as of the date of our mailing of this newsletter. Certain information expressed represents an assessment at a specific point in time and is not intended to be a forecast or guarantee of future results, nor is it intended to speak to any future time periods. RMB Capital makes no warranty or representation, express or implied, nor does RMB Capital accept any liability, with respect to the information and data set forth herein, and RMB Capital specifically disclaims any duty to update any of the information and data contained in this newsletter. The information and data in this newsletter does not constitute legal, tax, accounting, investment or other professional advice. Returns are presented net of fees. An investment cannot be made directly in an index. The index data assumes reinvestment of all income and does not bear fees, taxes, or transaction costs. The investment strategy and types of securities held by the comparison index may be substantially different from the investment strategy and types of securities held by your account. RMB Asset Management is a division of RMB Capital Management.