


Key Takeaways
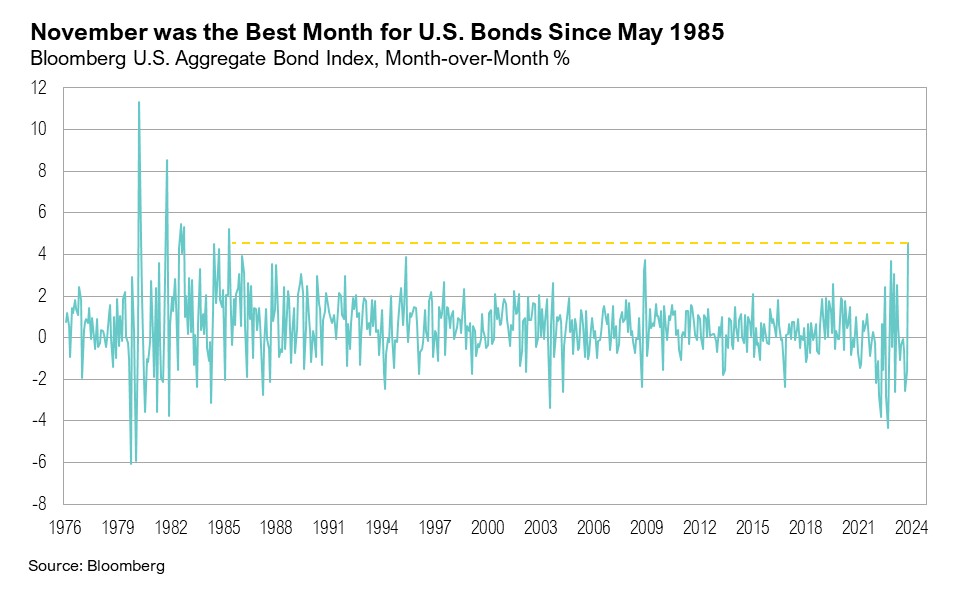
- Stocks and bonds ended November in positive territory. Both U.S. small cap and large cap stocks increased 9.1%, and the Bloomberg U.S. Aggregate Bond Index had its best month since 1985, rising 4.5%.
- The S&P 500’s Q3 earnings grew by 4.3% year-over-year and revenues increased 2.4%. However, earnings growth is expected to slow in the coming quarters.
- Although consumer sentiment remains unusually negative, Thanksgiving weekend broke records for U.S. travel and online shopping levels were robust.
- Underneath strong consumer spending levels lies growing credit reliance, hinting at an unsustainable trend that could foretell increased economic and market volatility.
Overview
Stocks and bonds ended November on a distinctly positive note. The S&P 500 Index, a proxy for U.S. large cap stocks, ended the month up an impressive 9.1%. This was the second-best November since 1988, surpassed only by November 2020’s 10.9% gain, which was fueled by optimism surrounding the impending COVID-19 vaccine rollouts.1 U.S. small cap stocks had a great month, also ending up 9.1%. Bonds had their best month since May 1985, and the Bloomberg U.S. Aggregate Bond Index ended November up 4.5%.
Nearly all S&P 500 companies have reported third-quarter earnings for 2023. The third-quarter earnings growth estimate for the S&P 500 was 4.8% year-over-year, the first increase since the third quarter of 2022.2 Third-quarter revenues grew 2.4%, exceeding the 1.6% growth expected in September. However, despite the recent market rally, analysts are projecting a more modest earnings growth of 3.0% for the fourth quarter, which is significantly lower than the 8.1% growth initially expected in September.2 Earnings estimates for the fourth quarter decreased by 5.0% between September 30 and November 30. The healthcare sector experienced the most significant decline, with a decrease of 19.9%. Despite the decline, forward earnings growth in the healthcare sector is anticipated to improve, partly due to the introduction of new GLP-1 weight-loss drugs like Ozempic, which have been boosting sales prospects for companies such as Centene, Cencora, and Eli Lilly.2
Annualized third-quarter gross domestic product (GDP) was revised even higher in November, to 5.2%, up from the first estimate of 4.9%. Although the government component’s contribution to GDP was revised higher (from 4.6% to 5.5%), third-quarter personal consumption was adjusted down to 3.6% from an initial 4.0%.3 However, fourth-quarter real GDP growth estimates have been declining. The Atlanta Federal Reserve’s GDPNow estimate for the fourth quarter was revised down to 1.2% on November 30, from a prior reading of 1.8%, as poor construction spending and weak ISM Manufacturing Purchasing Manager Index (PMI) reports weighed on the outlook for economic growth.4
The ISM Manufacturing PMI for November registered 46.7, its 13th consecutive month of contraction—the longest stretch since the Global Financial Crisis.5 The Federal Reserve’s latest Beige Book (which tracks economic conditions across the 12 Federal Reserve Districts), released on November 27, recorded a slowdown in economic activity, and Oxford Economics’ Beige Book Activity Index recorded a negative reading in November.6,7 This is the first time that the Index has turned negative without the U.S. economy being in a recession.7 The Conference Board’s Leading Economic Index (LEI) recorded another negative reading in October, driven by deteriorating consumer expectations and lower ISM data. The LEI continues to indicate a short recession, fueled by still-elevated inflation, high interest rates, and contracting consumer spending.8
Consumer sentiment remains at low levels. The University of Michigan’s Consumer Sentiment Index for November recorded its lowest reading since May—the fourth consecutive decline in consumer sentiment and its longest straight decline since 2016.9 Despite turning positive in May after a record 24 consecutive months of negative wage growth, average hourly wages have dropped to a two-year low.10 Further, real disposable income levels have been flat since May.11
With all this seemingly negative news, one may expect that consumer spending would also turn negative, but U.S. consumers are continuing to spend, albeit more selectively.12

Retail Therapy
Amid economic uncertainties, consumers are engaging in their own form of retail therapy and are focusing their spending on travel and experiences. For instance, nearly three million people were screened by TSA on Sunday, November 26, marking the busiest day on record at U.S. airports and the second time TSA broke its own travel record this year.13 The agency previously recorded its busiest day in history on Friday, June 30, ahead of Fourth of July.14 U.S. consumers also spent a record $9.8 billion in online sales on Black Friday, a 7.5% increase from the prior year. A Mastercard analysis of this year’s Black Friday sales found that while online sales increased by 8% year-over-year, in-store sales rose only 1% year-over-year.15
However, as online sales have increased, so has the reliance on buy-now, pay-later (BNPL) platforms. According to a report by Adobe Analytics, BNPL methods of payment increased by 47% year-over-year during the Black Friday spending period.15 BNPL services allow consumers to divide their spending into several interest-free installments. A recent study by the Bank of International Settlements (BIS) found that BNPL services have become increasingly popular, particularly amongst younger generations and those with riskier credit profiles who have higher delinquency rates across various consumer credit products.16 When U.S. government stimulus checks ended in 2021, the BIS study identified a notable spike in failed BNPL loan payments, whereas credit card loan failures did not increase as much. The rate of failed BNPL loan payments is almost four times higher than that of credit card loans.16 Revolving consumer credit, which includes credit cards, has been climbing rapidly, reaching $1.29 trillion in October, despite average U.S. credit card interest rates reaching a record high of 24.3%.17,18,19 Average credit card interest rates were 14.5% in February 2022 and have increased by more than 60% in less than two years.20
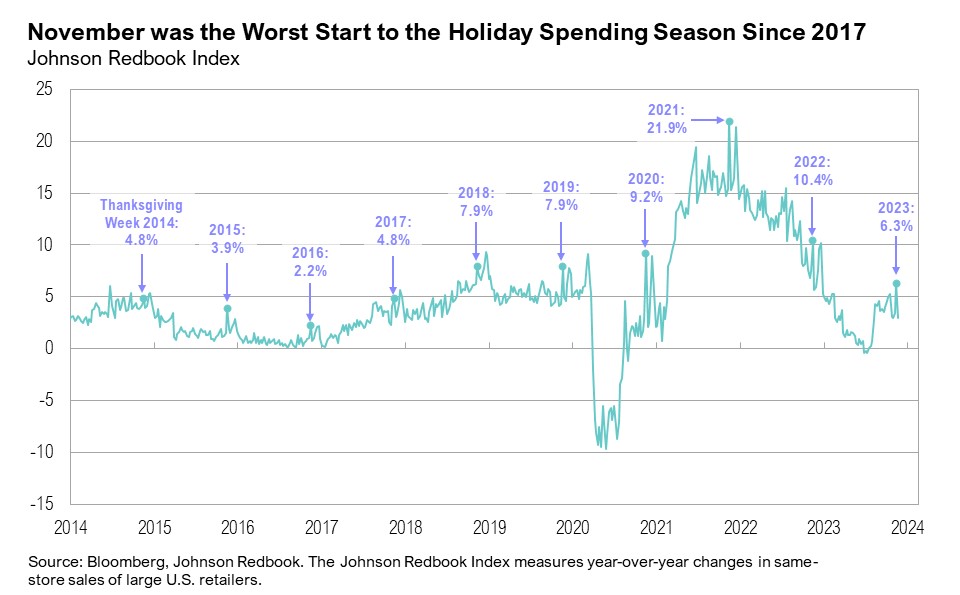
November has historically marked the start of the holiday spending season. However, many months of accumulated inflation are placing more and more pressure on consumers, and spending habits are changing. Notably, while retailers saw their largest sales gains of the year during the recent Thanksgiving week, November was the worst start to the holiday spending season since 2017. The Johnson Redbook Index of retail sales (a weekly measure of same-store sales growth) increased 6.3% during the 2023 Thanksgiving week and promptly dropped down to 3% in the week after Thanksgiving, reiterating the slow start to the holiday spending season.12, 21
On a more positive note, oil prices declined nearly 6% throughout November to end the month at $75 per barrel. The decline in oil prices contributed to the U.S. national average gasoline price dropping to $3.30 at the end of November, nearly 15% lower than the almost $4-per-gallon prices of early October.22 This may boost consumer confidence heading into the holiday season. According to Moody’s Analytics, a $1 decrease in gas prices equals about $125 billion a year in savings for U.S. households, amounting to more than $10 billion per month.23
Markets
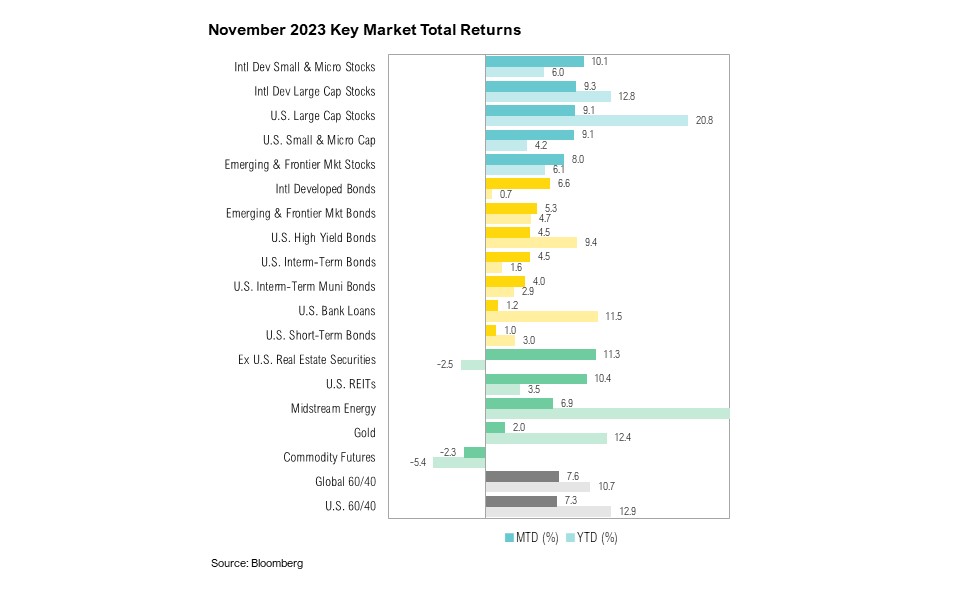
In November, only one asset class reported a negative return: commodity futures, which declined by 2.3%. U.S. large cap stocks and international developed market large cap stocks showed nearly identical positive performance. Specifically, the S&P 500 Index and the MSCI EAFE Index ended the month up by 9.1% and 9.3%, respectively. A similar trend was observed in small cap stocks, with the Russell 2000 Index and the MSCI EAFE Small Cap Index closing November with increases of 9.1% and 10.1%, respectively. Following this robust monthly performance, U.S. small cap stocks, represented by the Russell 2000 Index, finished November in positive territory for the year, showing a year-to-date gain of 4.2%. Bonds also performed well, as the 10-year Treasury yield dropped sharply lower throughout the month, ending November down 70 basis points at 4.2%.
Looking Forward
Robust headline consumer spending masks an increasing and unsustainable reliance on high-cost credit. Not only is spending moderating even with the economy at or near full employment, but it is being financed by a notable shift toward more credit card debt and other high-cost financing. This could point to a more volatile economic and market environment in the quarters ahead.
The delayed impact of the Federal Reserve's aggressive rate-hiking cycle, higher long-term interest rates, the unfolding of two wars, and the upcoming U.S. presidential election all have the potential to disrupt markets. While lower gas prices serve as a welcome offset, we do not believe this will be enough to fully offset growing stresses across the economy. The U.S. economy has been gradually slowing and recession risks remain elevated through 2024. The Federal Reserve is still aiming for their soft-landing goal while the U.S. economy and markets grapple with mixed economic data. We continue to favor high quality stocks and bonds, rather than being overly aggressive with opportunities in lower quality assets. Short-term bonds remain attractive, but investors should be prepared for changes to the yield curve over the next 12 months.
We believe that a high-quality diversified asset allocation remains the best approach to navigate uncertainty in the coming year. During volatile times, the key to successful investing is often remaining committed to long-term investment plans.
Citations
1. Pfizer: https://www.pfizer.com/news/press-release/press-release-detail/pfizer-and-biontech-announce-vaccine-candidate-against
2. FactSet: https://advantage.factset.com/hubfs/Website/Resources%20Section/Research%20Desk/Earnings%20Insight/EarningsInsight_120123.pdf
3. Bureau of Economic Analysis: https://www.bea.gov/data/gdp/gross-domestic-product
4. Federal Reserve Bank of Atlanta: https://www.atlantafed.org/-/media/documents/cqer/researchcq/gdpnow/realgdptrackingslides.pdf
5. ISM: https://www.ismworld.org/supply-management-news-and-reports/reports/ism-report-on-business/pmi/november/
6. Federal Reserve Beige Book: https://www.federalreserve.gov/monetarypolicy/files/BeigeBook_20231129.pdf
7. Oxford Economics: https://thedailyshot.com/2023/11/30/the-feds-beige-book-signals-slowing-economic-growth/
8. The Conference Board: https://www.conference-board.org/topics/us-leading-indicators
9. FRED: https://fred.stlouisfed.org/series/UMCSENT
10. FRED: https://fred.stlouisfed.org/series/CES0500000003
11. FRED: https://fred.stlouisfed.org/series/DSPIC96
12. Reuters: https://www.reuters.com/business/retail-consumer/discounts-drew-crowds-black-friday-week-sales-gain-softest-years-report-2023-11-28/
13. Travel + Leisure: https://www.travelandleisure.com/tsa-record-2023-thanksgiving-travel-8407292
14. Barron’s: https://www.barrons.com/articles/july-fourth-airlines-travel-stocks-a66f7c27
15. CNBC: https://www.cnbc.com/2023/11/25/black-friday-shoppers-spent-a-record-9point8-billion-in-us-online-sales-up-7point5percent-from-last-year.html
16. Bank for International Settlements: https://www.bis.org/publ/qtrpdf/r_qt2312e.htm
17. FRED: https://fred.stlouisfed.org/series/REVOLSL
18. Lending Tree: https://www.lendingtree.com/credit-cards/average-credit-card-interest-rate-in-america/
19. Forbes: https://www.forbes.com/advisor/credit-cards/average-credit-card-interest-rate/
20. FRED: https://fred.stlouisfed.org/series/TERMCBCCALLNS
21. Trading Economics: https://tradingeconomics.com/united-states/redbook-index
22. AAA: https://gasprices.aaa.com/state-gas-price-averages/
23. CBS: https://www.cbsnews.com/sacramento/news/lower-gas-prices-amounts-to-100-a-month-tax-cut-or-pay-raise/
Index Definitions
The S&P 500 Index is widely regarded as the best single gauge of the United States equity market. It includes 500 leading companies in leading industries of the U.S. economy. The S&P 500 focuses on the large cap segment of the market and covers approximately 75% of U.S. equities.
The Bloomberg Barclays U.S. Aggregate Index represents securities that are SEC-registered, taxable, and dollar denominated. The index covers the U.S. investment grade fixed rate bond market, with index components for government and corporate securities, mortgage pass-through securities, and asset-backed securities. Duration is roughly 5 years.
The Bloomberg U.S. Corporate High Yield Bond Index measures the USD-denominated, high yield, fixed-rate corporate bond market. Securities are classified as high yield if the middle rating of Moody’s, Fitch and S&P is Ba1/BB+/BB+ or below. Bonds from issuers with an emerging markets country of risk, based on the indices’ EM country definition, are excluded.
The Russell 1000® Value Index measures the performance of the large-cap value segment of the U.S. equity universe. It includes those Russell 1000 companies with lower price-to-book ratios and lower expected and historical growth rates.
The Russell 1000® Growth Index measures the performance of the large- cap growth segment of the US equity universe. It includes those Russell 1000 companies with relatively higher price-to-book ratios, higher I/B/E/S forecast medium term (2 year) growth and higher sales per share historical growth (5 years).
The Russell 2000® Index measures the performance of the small-cap segment of the US equity universe. It includes approximately 2000 of the smallest US equity securities in the Russell 3000 Index based on a combination of market capitalization and current index membership. The Russell 2000 Index represents approximately 10% of the total market capitalization of the Russell 3000 Index. Because the Russell 2000 serves as a proxy for lower quality, small cap stocks, it provides an appropriate benchmark for RMB Special Situations.
MSCI EAFE Index*: an equity index which captures large and mid-cap representation across 21 of 23 Developed Markets countries around the world, excluding the U.S. and Canada. With 926 constituents, the index covers approximately 85% of the free float-adjusted market capitalization in each country.
The MSCI Emerging Markets Index* measures equity market performance in the global emerging markets universe. It covers over 2,700 securities in 21 markets that are currently classified as EM countries. The MSCI EM Index universe spans large, mid and small cap securities and can be segmented across all styles and sectors.
The U.S. Dollar Index is used to measure the value of the dollar against a basket of six foreign currencies: the euro, Swiss franc, Japanese yen, Canadian dollar, British pound, and Swedish krona.
The Deutsche Bank EM FX Equally Weighted Spot Index, an equal-weighted basket of 21 emerging market currencies.
MSCI U.S. REIT Index is a free float-adjusted market capitalization weighted index that is comprised of equity Real Estate Investment Trusts (REITs). The index is based on the MSCI USA Investable Market Index (IMI), its parent index, which captures the large, mid and small cap segments of the USA market. With 150 constituents, it represents about 99% of the US REIT universe and securities are classified under the Equity REITs Industry (under the Real Estate Sector) according to the Global Industry Classification Standard (GICS®), have core real estate exposure (i.e., only selected Specialized REITs are eligible) and carry REIT tax status.
*Source: MSCI.MSCI makes no express or implied warranties or representations and shall have no liability whatsoever with respect to any MSCI data contained herein. The MSCI data may not be further redistributed or used as a basis for other indexes or any securities or financial products. This report is not approved, endorsed, reviewed or produced by MSCI. None of the MSCI data is intended to constitute investment advice or a recommendation to make (or refrain from making) any kind of investment decision and may not be relied on as such.
Performance Disclosures
All market pricing and performance data from Bloomberg, unless otherwise cited. Asset class and sector performance are gross of fees unless otherwise indicated.
The opinions and analyses expressed in this newsletter are based on RMB Capital Management, LLC’s (“RMB Capital”) research and professional experience are expressed as of the date of our mailing of this newsletter. Certain information expressed represents an assessment at a specific point in time and is not intended to be a forecast or guarantee of future results, nor is it intended to speak to any future time periods. RMB Capital makes no warranty or representation, express or implied, nor does RMB Capital accept any liability, with respect to the information and data set forth herein, and RMB Capital specifically disclaims any duty to update any of the information and data contained in this newsletter. The information and data in this newsletter does not constitute legal, tax, accounting, investment or other professional advice. Returns are presented net of fees. An investment cannot be made directly in an index. The index data assumes reinvestment of all income and does not bear fees, taxes, or transaction costs. The investment strategy and types of securities held by the comparison index may be substantially different from the investment strategy and types of securities held by your account. RMB Asset Management is a division of RMB Capital Management.