


Key Takeaways
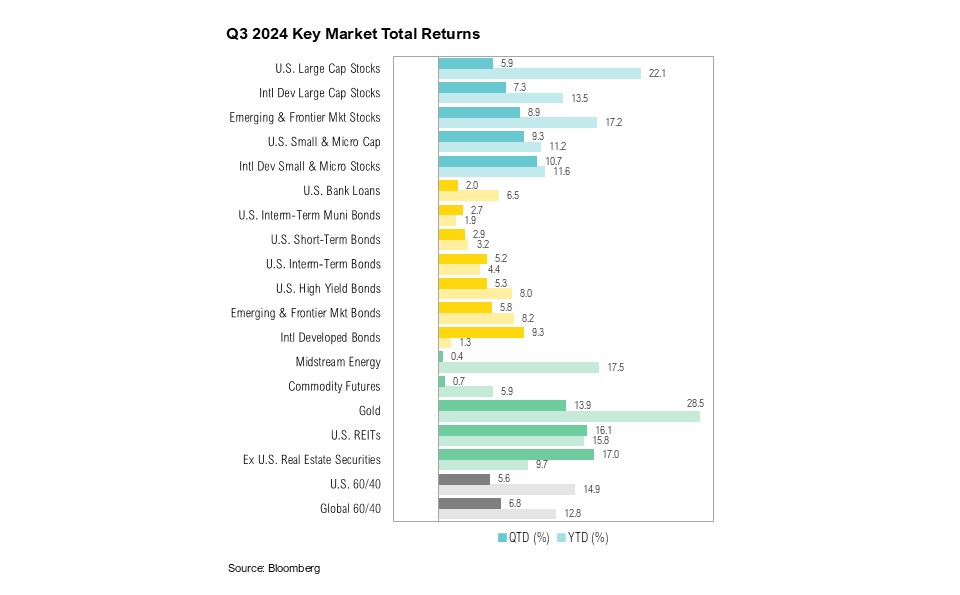
- U.S. large-cap stocks gained 5.9% during the third quarter, while U.S. small caps rose 9.3%. The Bloomberg U.S. Aggregate Bond Index had its best September since 2003.
- The Federal Reserve cut interest rates by 50 basis points, and it is expected to cut another 50 basis points before year end.
- The U.S. Treasury’s fiscal year ended in September with a $1.9 trillion deficit, the largest ever in a non-recession year.
- Investors face ambiguity around interest rates, the growing deficit, and upcoming elections, requiring vigilance in portfolio construction.
Overview
Markets performed well over the third quarter, and every major asset class is now positive for the year to date. In fact, this was the best first nine months of the year for U.S. large-cap stocks since 1997. U.S. large-cap stocks, as represented by the S&P 500 Index, gained 5.9% over the third quarter and are up 22.1% year to date. The Russell 2000 Index of U.S. small cap stocks ended the quarter up 9.3% and are up 11.2% year to date. Notably, September was the best month for the Bloomberg U.S. Aggregate Bond Index since 2003. U.S. intermediate-term bonds gained 1.3% over the month, 5.2% for the quarter, and 4.4% year to date.
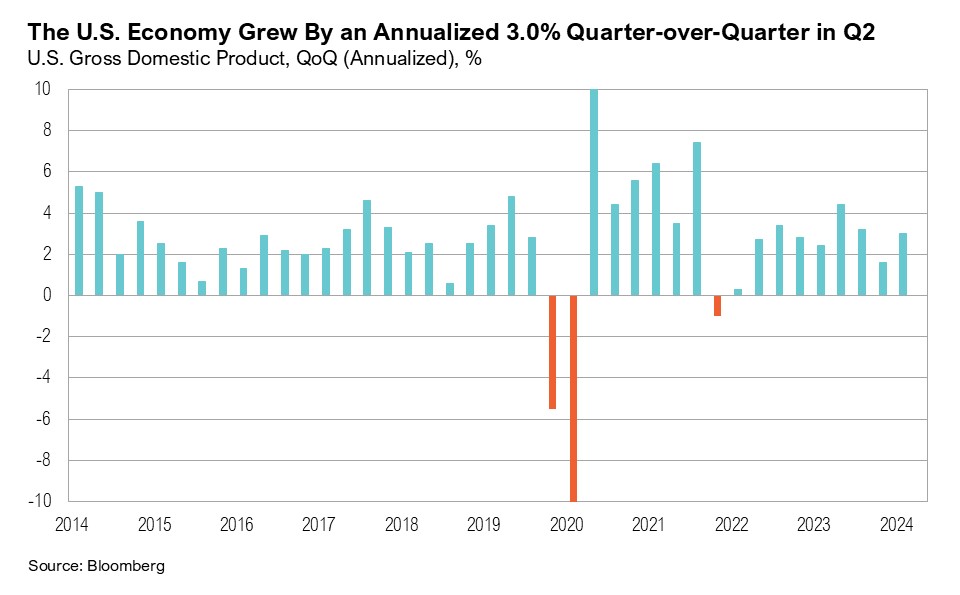
Final second-quarter gross domestic product (GDP) estimates indicated that annualized quarter-over-quarter growth rose from 1.6% in the first quarter to 3.0% in the second quarter.1 Compared to the first quarter, the acceleration in GDP was primarily driven by increased government spending (rising from 1.8% of GDP to 3.1% in the second quarter) and consumer spending (from 1.9% to 2.8%).1 During the quarter, the Bureau of Economic Analysis released its annual data revisions, notably upping second-quarter 2022 GDP from a previously reported decline of 0.6% to growth of 0.4%, quarter over quarter.2 This revision means that the economy did not, in fact, contract for two consecutive quarters—which would have met the informal definition of a technical recession.
Although inflation has fallen significantly since it reached its four-decade high of 9.1% in June 2022, it has remained above the Federal Reserve’s official 2% target for over three-and-a-half years. The August inflation report, released in September, showed headline inflation at a 41-month low of 2.6% on a year-over-year basis.3 The labor market remains resilient, and the U.S. economy continues to add new jobs. In September, the economy added 254,000 new jobs, far surpassing the expected 150,000.4 Further, the unemployment rate ticked marginally lower over the quarter, from 4.3% in July to 4.1% in September.4
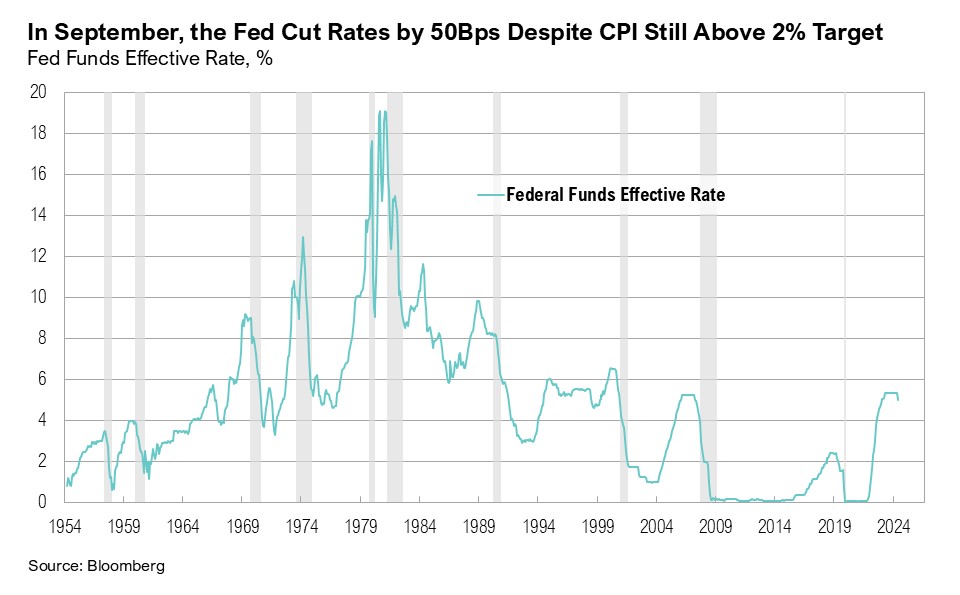
Following one of the most aggressive interest rate hiking cycles in history, it’s easy to forget that interest rates were near 0% as recently as March 2022.5 Between March 2022 and July 2023, the Fed raised rates by 5.0%, maintaining a target range of 5.25% to 5.50% for 14 months. At the September Federal Open Market Committee (FOMC) meeting, the Federal Reserve cut interest rates by 50 basis points. This cut occurred even with both core and headline inflation above target, a robust labor market, and no signs of stress in financial markets.
Rate Cuts and Deficits and Elections, Oh My!
August of this year marked the 85th anniversary of The Wizard of Oz. Throughout the third quarter, investors found themselves on their own yellow brick road, navigating a forest of election unpredictability, a unique rate cut, and an ever-growing U.S. fiscal deficit—hoping the journey will ultimately lead to the economic equivalent of the Emerald City: a soft landing.
In September, the Fed cut interest rates and signaled the start of a new rate-cutting cycle. Although largely anticipated (markets were pricing in a 65% probability of a 50-basis point cut two days before the announcement), such a significant cut—especially the first in a cycle—is unusual, typically occurring only in times of crisis.6,7 Similar 50-basis point cuts occurred before the start of the recession in January 2001, before the Global Financial Crisis in September 2007, and during the pandemic in March 2020. A 50-basis point cut in the current benign economic environment is unprecedented.
At the post-FOMC meeting press conference on September 18, even Chair Jerome Powell noted the strength in the labor market:
“This recalibration of our policy stance will help maintain the strength of the economy and the labor market and will continue to enable further progress on inflation as we begin the process of moving toward a more neutral stance.”8
With both core and headline inflation above the official 2% target, financial conditions at their loosest since May 2022, and the labor market not showing signs of significant cooling, it’s debatable whether the Fed’s recent 50 basis point rate cut was justified. Indeed, addressing this very concern, Powell expanded on the FOMC’s decision in the press conference:
“There is thinking that the time to support the labor market is when it’s strong and not when you begin to see the layoffs…We don’t think we need to see further loosening in labor market conditions to get inflation down to 2 percent.”8
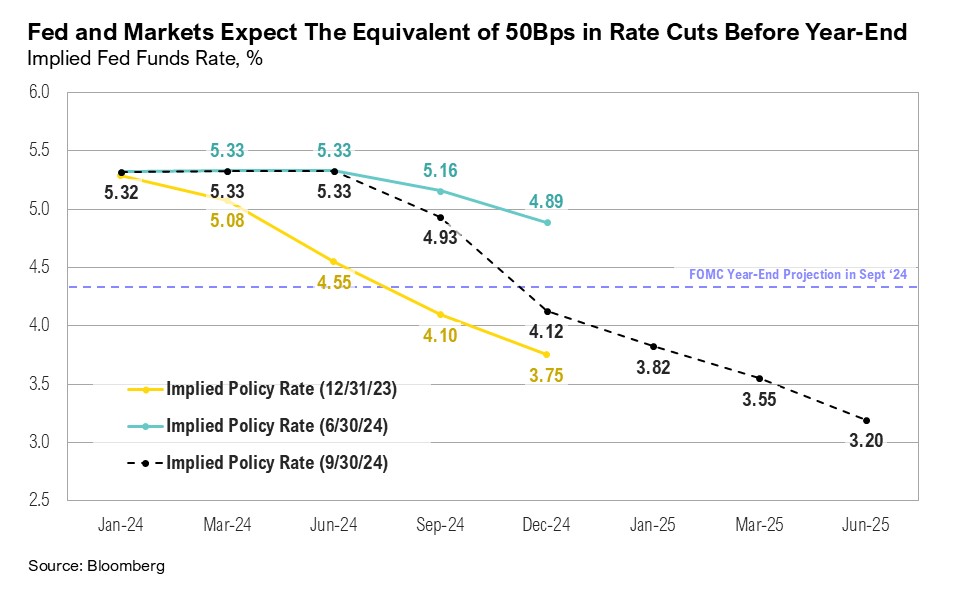
Initial jobless claims, for example, are nearly 60% lower at this rate cut than at the time of the January 2001 initial rate cut and 40% lower than at the time of the September 2007 initial cut.9 The Fed’s recent 50-basis point cut may be overcompensating for past mistakes by acting more aggressively now, perhaps trying to avoid the error of moving too slowly ahead of prior recessions. However, the Fed’s more lenient approach to monetary policy could re-accelerate growth and cause inflation to reverse course from its current cooling trend. Further, the move could encourage risk-taking behavior and push up asset prices. (The forward price-to-earnings ratio for the S&P 500 is currently elevated at 21.5, but still below the Tech Bubble peak of 25.1, indicating that valuations could become even more stretched.) Whether the Fed will ultimately be willing—or able—to defeat the “Wicked Witch” of inflation remains to be seen. Both the Fed and markets are expecting the equivalent of another 50-basis-point reduction by year end, implying a 25-basis-point cut at each of the remaining FOMC meetings in 2024, bringing interest rates down to a range of 4.25% to 4.50%.6
Equity markets cheered the Fed’s announcement, and the S&P 500 rose 2.6% between September 18 and September 30. Market breadth also improved as rate-sensitive areas of the market rallied throughout the third quarter, both in anticipation of and following the Fed’s first rate cut. Notably, 45% of S&P 500 constituents outperformed the broader index over the past three months, a significant improvement from just 26% six months ago.10 The technology and communication services sectors both climbed over 4% between September 18 and September 30. The utilities sector also saw strong gains, rising 3.6% between September 18 and the end of the month, finishing the quarter up 19.4%. After a robust third quarter, utilities have now surpassed the technology sector to become the S&P 500's top-performing sector in 2024, up 30.6%. The real estate sector closed the quarter with a gain of over 17%, and U.S. small-cap stocks advanced 9.3%. Small-cap stocks are particularly sensitive to interest rates due to relatively high debt levels and the high ratio (approximately 42%) of unprofitable companies in the Russell 2000 Index.11
In contrast to risky assets, the Treasury market appeared to play the role of Scarecrow as it digested the rate cut. Notably, the 10-year Treasury yield, which reached a one-year low of 3.6% on September 16—just two days before the Fed's rate cut—ended the month 20 basis points higher, at 3.8%, while reaching nearly 4.0% just after the jobs report was announced in early October. The rise in yields could be signaling the bond market’s recognition that the Fed may tolerate higher inflation or could reflect underlying concerns about the precarious U.S. fiscal situation, especially the weight of rising debt and the structural deficit burden, which threaten to drive up long-term borrowing costs, regardless of the Fed's actions.12
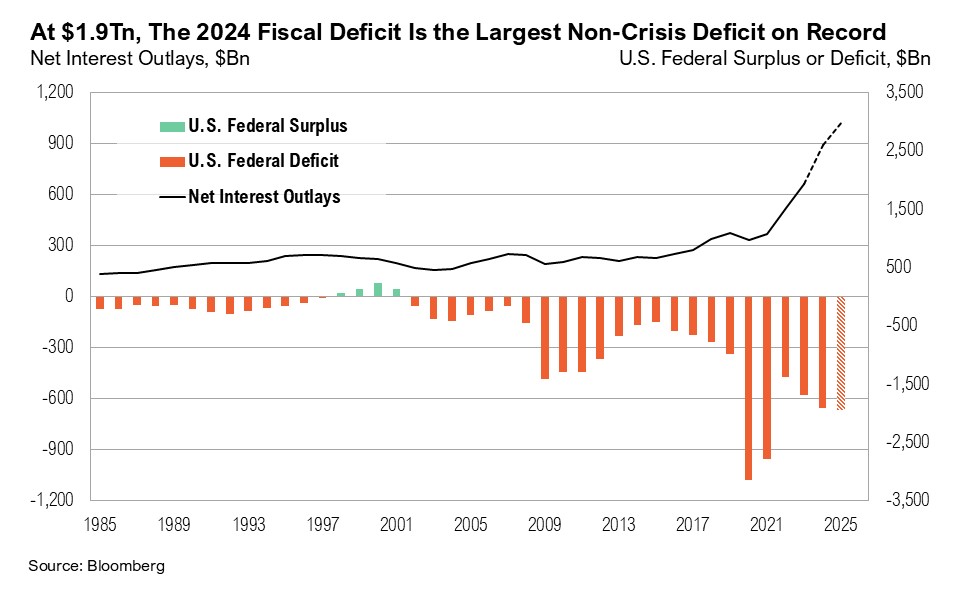
Despite the pandemic having ended several years ago, the U.S. economy continues to be driven by crisis-era government spending, which is producing multi-trillion-dollar deficits with no end in sight. The close of the third quarter marked the end of the U.S. Treasury’s fiscal year, and the most recent Treasury monthly budget statement shows that the budget deficit has ballooned to $1.9 trillion, making the 2024 deficit the largest ever in a non-crisis or non-recession year. Net interest outlays have surged to $843 billion, surpassing both defense spending ($798 billion) and health expenditures ($824 billion).13 The U.S. government is currently paying an average of $3 billion in interest expenses each day, including weekends.14 A further 50-basis-point decline in interest rates, as expected by year end, is estimated to reduce these daily interest payments to $2.5 billion.14
As Election Day approaches, neither presidential candidate has provided a detailed plan to address the deficit. Both candidates have avoided discussing the necessary policies to tackle the issue, and the deficit was only mentioned twice during the September 10 presidential debate.15 Current estimates suggest that both former President Trump and Vice President Harris’s spending policies would add at least $6 trillion to the deficit over the next decade.16,17 An additional risk is the potential for inflation to rise again if the growing deficit pressures the Fed to print more money to help the government manage its debt.17 Despite these unsustainable spending trends, longer-term Treasury yields have remained relatively stable. Regardless of individual opinions of the sustainability of deficits and how and when they should be addressed, the bond market will likely be the final arbiter of the sustainability of the U.S. fiscal strategy—or lack thereof. Investors should take notice if and when bond markets reach their limit and begin to push back against excessive government spending.
With just two months remaining until the 2024 presidential election, the race remains tight, and it appears increasingly likely that the path to the White House will hinge on just seven key swing states: Nevada, Arizona, Michigan, North Carolina, Wisconsin, Georgia, and, perhaps most critically, Pennsylvania. Current trends and polls suggest the path to 270 electoral votes will be difficult for either candidate without Pennsylvania, which holds 19 electoral votes.18,19,20 In such a close race, voter turnout will be vital, particularly among young voters, who have historically participated at lower rates.21 Since 1988, voter turnout amongst those aged 18 to 29 years has averaged at 42%, compared to 56% for those aged 30 to 44, 66% for those aged 45 to 59 years, and a 69% voter turnout for those 60 years and older.
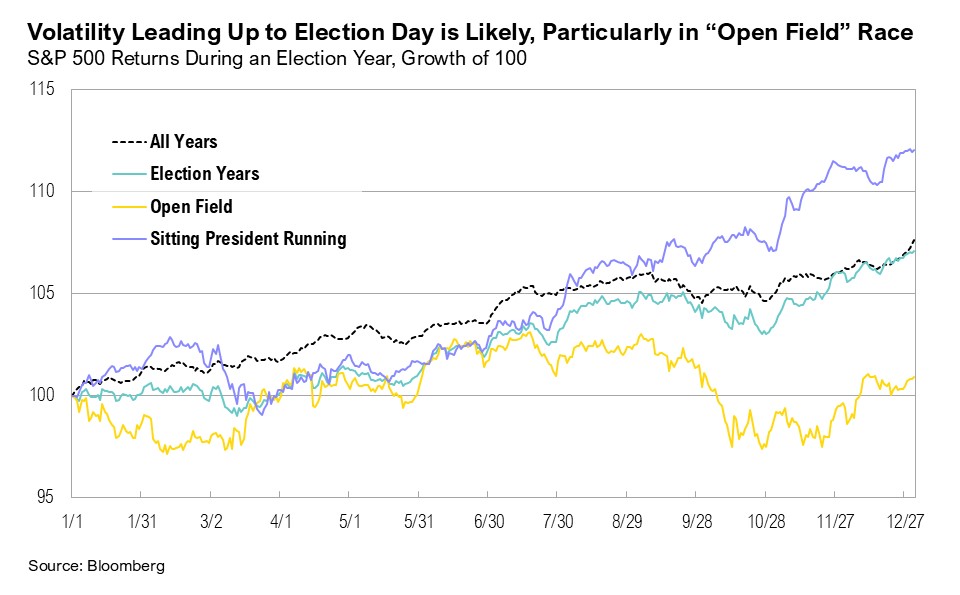
While it is too close to predict the election outcome, it would not be unusual for volatility to rise as Election Day approaches, especially given the incumbent president is not seeking re-election. However, markets typically rally once the uncertainty surrounding the election is resolved.
Markets
International equities slightly outperformed their U.S. counterparts in the third quarter. International developed market stocks, as represented by the MSCI EAFE Index, outpaced U.S. large-cap stocks, which ended the quarter up 5.9%, by 1.4%. Similarly, international developed market small- and micro-cap stocks rose 10.7% for the quarter, compared to a 9.3% gain for U.S. small-cap stocks. Emerging markets also performed well, finishing the third quarter up 8.9% to be the second-best performing equity asset class year to date, behind U.S. large cap stocks. Emerging market gains were driven by the MSCI China Index, which surged 23.5% on news of economic stimulus, and the MSCI South Africa Index, which gained 16.1%, continuing the positive momentum from the second quarter following a favorable election outcome. Meanwhile, U.S. intermediate-term bonds gained 5.2% in the third quarter and are up 4.4% year-to-date.
Looking Forward
Going into fourth quarter, investors are facing an unusual policy mix of crisis-level deficits and a Federal Reserve that is taking a historically lenient approach to inflation, even as the economy seems to be humming along. Over the last four years, core inflation has run at an average annual rate of 4.8%, and the U.S. is spending more than $1.43 for every $1.00 it collects in taxes.22,13 For comparison, when the U.S. was emerging from the Great Depression, the country was running a 3% fiscal deficit—considered aggressive but necessary with unemployment at 17.2%. Today, while unemployment is a much lower 4.1%, our deficit is more than double that of 1939.23,24
Investors must contend with ambiguity around interest rates, the deficit, and the upcoming election as they prepare for the last quarter of the year. Policymakers seem content with decisions that prioritize the here and now at the expense of long-term fiscal stability, thereby limiting their ability to respond to future crises and threatening the role of the U.S. dollar in global trade.
Given all the uncertainty and increased volatility in markets, we continue to be cautious with risk assets as the current cycle plays out in the coming weeks and months. Although lower asset prices would be a welcome development and an opportunity to put additional capital to work, typical election year seasonals—coupled with still-high equity valuations—suggest that there is no rush. We remain biased towards high-quality companies within our core stock portfolios. We have been well-positioned within core bond portfolios with a low weight toward shorter-duration corporate bonds and a higher weight toward longer-duration treasury bonds. We believe clients are best served reminding themselves of the timeless principles of patience and diversification. The key to successful investing is often remaining committed to long-term investment plans.
Citations
- BEA: https://www.bea.gov/sites/default/files/2024-09/gdp2q24-3rd.pdf
- BEA: https://www.bea.gov/sites/default/files/2024-09/NEA-AU24-Briefing.pdf
- FRED: https://fred.stlouisfed.org/series/CPIAUCSL
- BLS: https://www.bls.gov/news.release/empsit.nr0.htm
- FRED: https://fred.stlouisfed.org/series/FEDFUNDS
- CME FedWatch: https://www.cmegroup.com/markets/interest-rates/cme-fedwatch-tool.html
- Forbes: https://www.forbes.com/advisor/investing/fed-funds-rate-history/
- Federal Reserve: https://www.federalreserve.gov/mediacenter/files/FOMCpresconf20240918.pdf
- FRED: https://fred.stlouisfed.org/series/ICSA
- Liz Ann Sonders via X: https://x.com/LizAnnSonders/status/1841083134366158982/photo/2
- Wall Street Journal: https://www.wsj.com/finance/stocks/if-a-soft-landing-is-in-the-cards-why-arent-small-cap-stocks-rallying-475b8b66
- CNBC: https://www.cnbc.com/2024/09/26/the-fed-slashed-interest-rates-last-week-but-treasury-yields-are-rising-whats-going-on-.html
- Bureau of the Fiscal Service: https://www.fiscal.treasury.gov/files/reports-statements/mts/mts0824.pdf
- Apollo Academy: https://www.apolloacademy.com/3-billion-per-day-in-interest-expenses/
- The American Presidency Project: https://www.presidency.ucsb.edu/documents/presidential-debate-philadelphia-pennsylvania
- Wall Street Journal: https://www.wsj.com/politics/policy/federal-debt-deficit-trump-harris-5a0d30d2?mod=hp_lead_pos7
- CNN: https://edition.cnn.com/2024/09/27/economy/deficit-danger-harris-trump/index.html
- 270ToWin: https://www.270towin.com/2024-presidential-election-polls/
- Real Clear Politics: https://www.realclearpolitics.com/epolls/latest_polls/national_president/index.html
- FiveThirtyEight: https://projects.fivethirtyeight.com/2024-election-forecast/?cid=rrpromo#electoral-college-probability
- Statista: https://www.statista.com/statistics/1096299/voter-turnout-presidential-elections-by-age-historical/
- FRED: https://fred.stlouisfed.org/series/CPILFESL
- FRED: https://fred.stlouisfed.org/series/FYFSGDA188S
- Statista: https://www.statista.com/statistics/1315397/united-states-unemployment-number-rate-historical/
Index Definitions
The S&P 500 Index is widely regarded as the best single gauge of the United States equity market. It includes 500 leading companies in leading industries of the U.S. economy. The S&P 500 focuses on the large cap segment of the market and covers approximately 75% of U.S. equities.
The Bloomberg Barclays U.S. Aggregate Index represents securities that are SEC-registered, taxable, and dollar denominated. The index covers the U.S. investment grade fixed rate bond market, with index components for government and corporate securities, mortgage pass-through securities, and asset-backed securities. Duration is roughly 5 years.
The Bloomberg U.S. Corporate High Yield Bond Index measures the USD-denominated, high yield, fixed-rate corporate bond market. Securities are classified as high yield if the middle rating of Moody’s, Fitch and S&P is Ba1/BB+/BB+ or below. Bonds from issuers with an emerging markets country of risk, based on the indices’ EM country definition, are excluded.
The Russell 1000® Value Index measures the performance of the large-cap value segment of the U.S. equity universe. It includes those Russell 1000 companies with lower price-to-book ratios and lower expected and historical growth rates.
The Russell 1000® Growth Index measures the performance of the large- cap growth segment of the US equity universe. It includes those Russell 1000 companies with relatively higher price-to-book ratios, higher I/B/E/S forecast medium term (2 year) growth and higher sales per share historical growth (5 years).
The Russell 2000® Index measures the performance of the small-cap segment of the US equity universe. It includes approximately 2000 of the smallest US equity securities in the Russell 3000 Index based on a combination of market capitalization and current index membership. The Russell 2000 Index represents approximately 10% of the total market capitalization of the Russell 3000 Index. Because the Russell 2000 serves as a proxy for lower quality, small cap stocks, it provides an appropriate benchmark for RMB Special Situations.
MSCI EAFE Index*: an equity index which captures large and mid-cap representation across 21 of 23 Developed Markets countries around the world, excluding the U.S. and Canada. With 926 constituents, the index covers approximately 85% of the free float-adjusted market capitalization in each country.
The MSCI Emerging Markets Index* measures equity market performance in the global emerging markets universe. It covers over 2,700 securities in 21 markets that are currently classified as EM countries. The MSCI EM Index universe spans large, mid and small cap securities and can be segmented across all styles and sectors.
The U.S. Dollar Index is used to measure the value of the dollar against a basket of six foreign currencies: the euro, Swiss franc, Japanese yen, Canadian dollar, British pound, and Swedish krona.
The Deutsche Bank EM FX Equally Weighted Spot Index, an equal-weighted basket of 21 emerging market currencies.
MSCI U.S. REIT Index is a free float-adjusted market capitalization weighted index that is comprised of equity Real Estate Investment Trusts (REITs). The index is based on the MSCI USA Investable Market Index (IMI), its parent index, which captures the large, mid and small cap segments of the USA market. With 150 constituents, it represents about 99% of the US REIT universe and securities are classified under the Equity REITs Industry (under the Real Estate Sector) according to the Global Industry Classification Standard (GICS®), have core real estate exposure (i.e., only selected Specialized REITs are eligible) and carry REIT tax status.
MSCI China NR Index: designed to measure the performance of the large and mid cap segments of the Chilean market. With 12 constituents, the index covers approximately 85% of the Chile equity universe.
MSCI South Africa NR Index: designed to measure the performance of the large and mid cap segments of the South African market. With 37 constituents, the index covers approximately 85% of the free float-adjusted market capitalization in South Africa.
*Source: MSCI.MSCI makes no express or implied warranties or representations and shall have no liability whatsoever with respect to any MSCI data contained herein. The MSCI data may not be further redistributed or used as a basis for other indexes or any securities or financial products. This report is not approved, endorsed, reviewed or produced by MSCI. None of the MSCI data is intended to constitute investment advice or a recommendation to make (or refrain from making) any kind of investment decision and may not be relied on as such.
Performance Disclosures
All market pricing and performance data from Bloomberg, unless otherwise cited. Asset class and sector performance are gross of fees unless otherwise indicated.
The opinions and analyses expressed in this newsletter are based on Curi RMB Capital, LLC’s (“Curi RMB Capital”) research and professional experience are expressed as of the date of our mailing of this newsletter. Certain information expressed represents an assessment at a specific point in time and is not intended to be a forecast or guarantee of future results, nor is it intended to speak to any future time periods. Curi RMB Capital makes no warranty or representation, express or implied, nor does Curi RMB Capital accept any liability, with respect to the information and data set forth herein, and Curi RMB Capital specifically disclaims any duty to update any of the information and data contained in this newsletter. The information and data in this newsletter does not constitute legal, tax, accounting, investment or other professional advice. Returns are presented net of fees. An investment cannot be made directly in an index. The index data assumes reinvestment of all income and does not bear fees, taxes, or transaction costs. The investment strategy and types of securities held by the comparison index may be substantially different from the investment strategy and types of securities held by your account. RMB Asset Management is a division of Curi RMB Capital.