


Key Takeaways
- May was nearly ideal for most asset classes. U.S. equities performed best, as large cap and small cap stocks both rose 5%. Intermediate-term bonds ended the month up 1.7%—their best monthly return this year.
- While AI excitement remains centered on mega-cap technology companies like Nvidia, there is growing attention on the infrastructure needed for AI development, particularly the vast data and significant electricity required to train and run learning models.
- Markets have benefitted from the easing of inflation pressures, but maintaining stability requires keeping inflation and bond yields contained.
Overview
May was a nearly ideal month for most asset classes. U.S. equities fared best, with both U.S. large cap stocks and U.S. small cap stocks ending the month up 5%. Even the downtrodden bond market ended the month in the green. U.S. intermediate-term bonds ended May up 1.7%—their best monthly return this year.
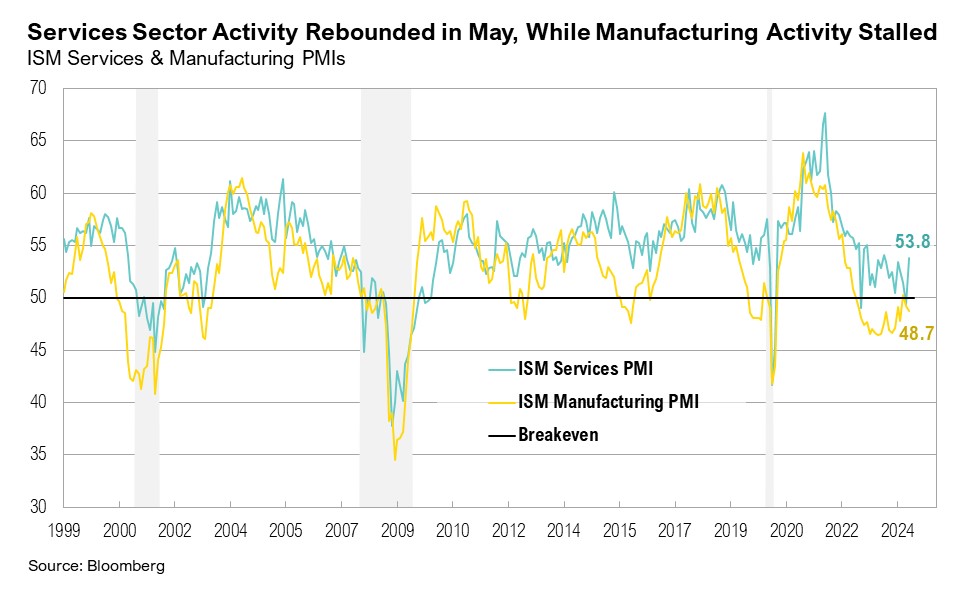
Revised first-quarter gross domestic product (GDP) estimates showed annualized quarter-over-quarter GDP growth lowered from 1.6% to 1.3%, driven primarily by declines in consumer spending, as personal consumption was revised down from 2.5% to 2.0%.1 After dipping into contractionary territory in April, the ISM Manufacturing PMI showed continued weakness in May, dropping further into contractionary territory with a reading of 48.7.2 In contrast to the stalling manufacturing sector, the services sector rebounded in May. The ISM Services PMI hit 53.8, after briefly dipping into contractionary territory in April with a reading of 49.4.3 The April inflation report, released in May, showed headline inflation slightly decreasing year-over-year, from 3.5% to 3.4%.4 The core inflation print of 3.6% year-over-year was the lowest in exactly three years.
In May, the Federal Open Market Committee (FOMC) yet again kept interest rates unchanged. During the meeting, Fed Chair Jerome Powell expressed concerns about a “lack of further progress” on inflation.5 He also announced a more aggressive than expected quantitative tightening (QT) taper. Starting June 1, the monthly redemption cap on Treasury securities will decrease from $60 billion to $25 billion.6 Despite inflation remaining above 3% and surpassing the Fed’s official 2% target for over three years, the Fed’s recent QT taper decision indicates a more accommodative approach to enduring higher inflation. Market expectations for interest rate cuts continued to hover between one and two for 2024, and the first cut is expected at the September FOMC meeting.7
By the end of May, 98% of S&P 500 companies had reported first-quarter earnings results. Earnings growth for the quarter steadily improved from 3.4% at the end of March to 5.9% by the end of May.8 Notably, full-year 2024 and 2025 earnings per share estimates have increased, driven primarily by the communication services and information technology sector.8 Both earnings growth and S&P 500 stock market performance have largely been driven by a handful of mega-cap companies. Nvidia, Microsoft, Apple, and Alphabet together added over $1.4 trillion in market cap over the past month, surpassing the combined gains of the other 296 stocks that ended the month positive. More than half of the gains were driven by Nvidia alone, which ended the month up 25%.9 At a sector level, information technology was the top-performing sector, gaining 10% over May, followed by the utilities sector, which ended the month up 8%.
Power Play
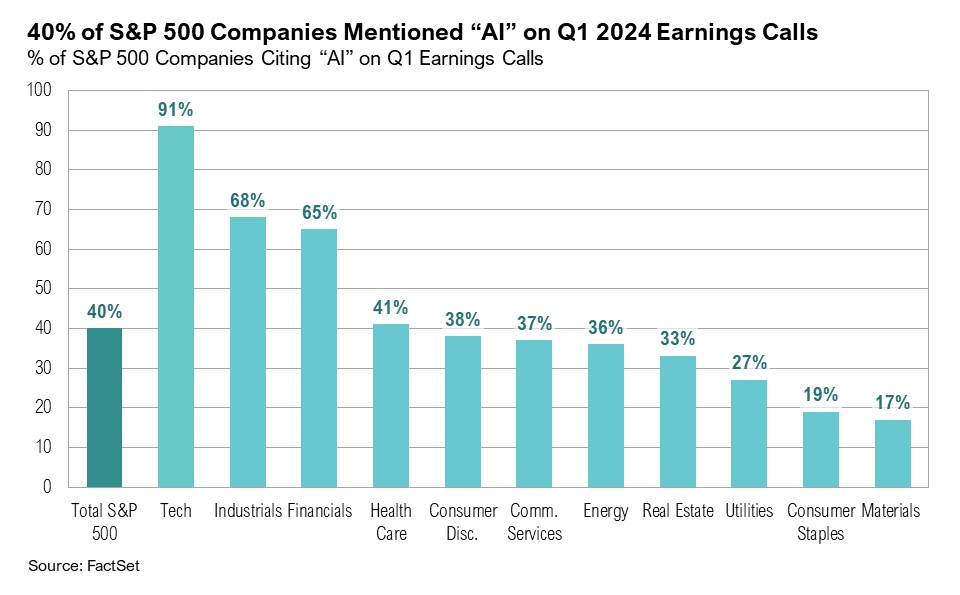
Coincidentally, May 2023 was dominated by the artificial intelligence (AI) boom, triggered by the release of OpenAI’s ChatGPT in November 2022 and fueled by surging investor excitement about the potential impact of AI on the global economy. By some estimates, AI could contribute as much as $15 trillion to the global economy by 2050.10,11 Nvidia, a key driver of the AI boom, saw its share price gain more than 40% in May 2023 after announcing first-quarter earnings results that far exceeded expectations due to rising demand for AI microchips.12 Over the past year, the excitement surrounding AI has persisted. Nearly 40% of S&P 500 companies (around 200) mentioned “AI” in their first-quarter 2024 earnings calls, almost double the number of mentions in first-quarter earnings calls last year.13
Although AI excitement continues to revolve primarily around a handful of mega-cap technology companies like Nvidia, some of the focus has shifted to the infrastructure needed to support the continued development of AI. Over the past year, it has become clear that artificial intelligence requires vast amounts of data to train learning models, which in turn demands significant electricity usage. For example, estimates show that AI applications such as ChatGPT-3 may consume up to 10 times the energy used by Google for a search.14 Furthermore, AI-model training requires large numbers of graphics processing unit (GPU) servers and specialized data centers to accommodate the intense computational demands. These data centers consume significant amounts of water (for cooling), energy, and land. The amount of land needed for an AI data center can vary significantly, ranging between 10 to 1,200 acres—which is the size of the data center campus recently purchased by Amazon.15 A study by the University of California has found that OpenAI’s ChatGPT-3 “consumes” a 16-ounce bottle of water for every 10-50 responses it generates.16 The study also found that training a large language model (such as ChatGPT-3) in Microsoft’s high-end data centers can directly evaporate around 185,000 gallons of water per day.16
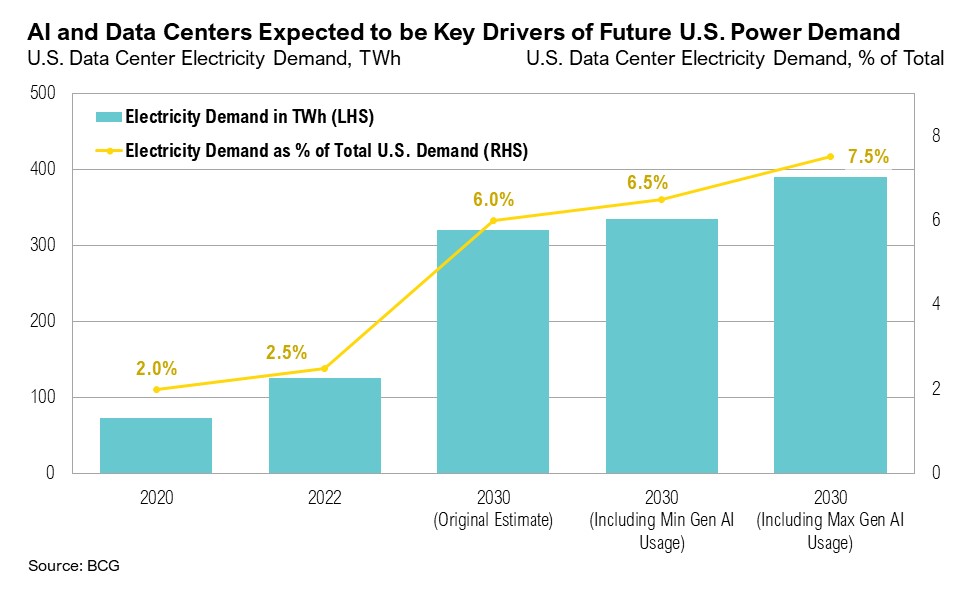
In the U.S., power generation has remained relatively stable over the past 20 years, growing modestly by around 0.4% a year.17 Electricity demand has also remained relatively steady over this time.18 However, this stability is likely to be disrupted as the demand for (and from) AI and data centers escalates. Recent studies suggest that the volume of data generated by businesses and consumers in the next five years will double that of the past decade.19 Forecasts by Boston Consulting Group indicate that data centers could account for between 6.0% and 7.5% of total electricity demand by 2030, necessitating an annual increased production of between three and seven gigawatts of new power capacity to meet these needs.20 This represents a 15% compound annual growth rate, equal to the electricity consumed by one-third of U.S. homes.20
In order to meet these energy demands, the U.S. has started to push back the retirement dates of the country’s aging coal fleet.21 Approximately 4% of the country’s total coal-powered electricity capacity is to be retired by 2030—a 40% downward revision from last year.21 However, coal’s share of power continues to decline, and ongoing reliance on coal is recognizably unsustainable. Instead, companies have started to turn to nuclear power as a solution. Narratives around nuclear power have begun shifting, with the United Nations in December 2023 recognizing its significant role in reducing carbon emissions and mitigating climate change. At the 28th United Nations Climate Change Conference of the Parties (COP28), companies from 140 countries signed the Net Zero Nuclear Industry Pledge, committing to support the expansion of nuclear energy to achieve net-zero emissions by 2050.22 20 nations, including the U.S., France, Sweden, and the United Arab Emirates, have committed to triple nuclear energy capacity by 2050.22
Nuclear power has also piqued the interest of Silicon Valley, and both startups and mega-cap tech companies have begun investing. Oklo, a startup backed by the founder of OpenAI, Sam Altman, started trading on the New York Stock Exchange in May. Oklo aims to develop mini nuclear reactors to power data centers, including those used by AI companies.23,24 Amazon recently purchased a 100% nuclear-powered data center in Pennsylvania from Talen Energy.25 The data center is expected to be powered directly by the neighboring nuclear power plant, Susquehanna, with Amazon committing to up to 960 megawatts of power from the plant over the next several years.25 Meta CEO Mark Zuckerberg believes the key challenge for AI over the next few years will be energy constraints. According to Zuckerberg, energy constraints have held back Meta’s own data center buildout: “I think we would probably build out bigger clusters than we currently can if we could get the energy to do it.”26 Also potentially adding to power needs driven by AI demand, Microsoft is reportedly considering building a $100 billion supercomputer campus to develop AI models in a project called Stargate.27,28
While nuclear power appears to be one of the emerging leaders in meeting AI and data center energy requirements, it will not be an immediate solution. There are currently 60 nuclear reactors being constructed worldwide, and an additional 110 are planned to start over the next five years.29 However, there are currently only 13 nuclear reactors proposed in the U.S., which have not yet been approved. The average construction timeline for a nuclear plant, from approval to becoming operational, generally ranges between seven and 10 years.30
AI’s energy requirements have inevitably led to increased attention on the U.S. utilities sector, especially those companies generating and distributing electricity for data centers. These companies tend to primarily reside in the historically low-growth utilities sector. Between 2018 and 2022, earnings growth across the S&P 500 utilities sector was negative, and revenue growth fell below the average inflation rate of 3.6% over the period.31 However, many of these companies are now estimated to grow at 6% or more per year over the next 15 years.32 Despite being the second worst-performing S&P 500 sector over the past five years (with real estate faring worst), the utilities sector is the top-performing S&P 500 sector year-to-date, up 15.8%. In comparison, the communication services sector is up 14.9%, and the technology sector is up 9.4%.
Markets
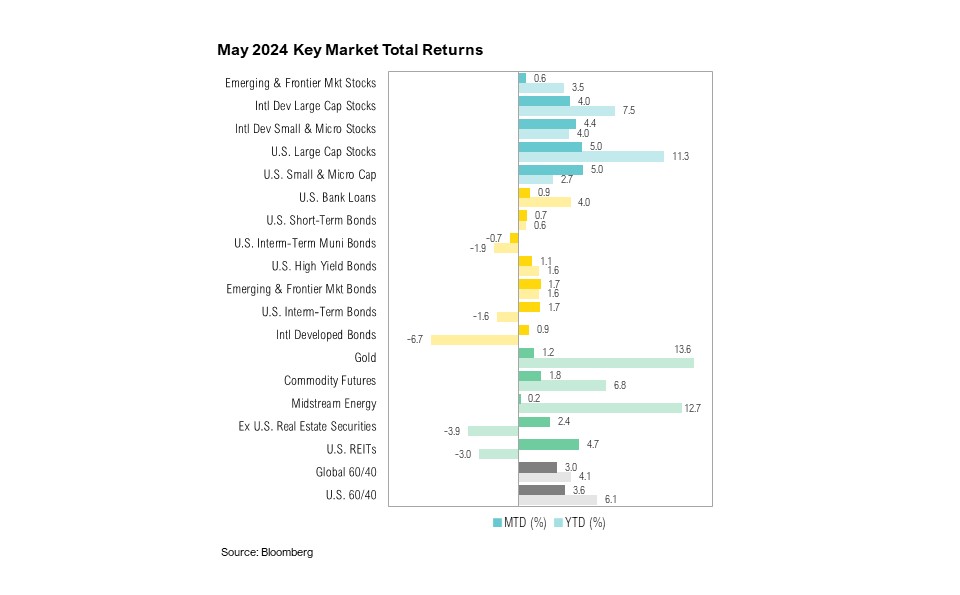
With the exception of U.S. intermediate-term municipal bonds, which ended the month down 0.7%, all major asset classes ended May with positive returns. U.S. large cap stocks and U.S. small cap stocks were the top performers, both ending the month up 5.0%, followed by U.S. REITs, which gained 4.7%. Emerging and frontier market stocks gained 0.6%, while international developed market large cap stocks ended May up 4.0%. U.S. intermediate-term bonds ended the month up 1.7%—the best monthly return this year.
Overseas, the past month was characterized by presidential elections in several developing market countries. India held its general elections between April and June, and the country’s National Democratic Alliance won the majority while incumbent Prime Minister Narendra Modi won a historic third term.33 On May 29, South Africa held national elections, and the African National Congress lost majority power for the first time in 30 years. A coalition government now needs to be formed.34 On June 2, Mexico held its general elections, with Claudia Sheinbaum from the Party of the Democratic Revolution winning the presidency.35 21 emerging economies were scheduled to hold elections this year, and 14 of these elections have already taken place. Among developed market countries, the U.S., the United Kingdom, and France are holding elections this year.36 With significant elections activity this year, global and regional market performance is likely to be impacted by the run up to and outcomes of these elections.
Gold ended May up 1.2%, reaching a new record high of $2,421. West Texas Intermediate (WTI) crude ended the month at $77 per barrel, dropping $5 per barrel (or 6%) over the month. After remaining largely unchanged over the month, the national average price per gallon of regular unleaded gas dropped from $3.6 per gallon to $3.5 per gallon by the end of May, the largest weekly drop year-to-date.37
Looking Forward
We continue to believe the bond market’s reaction to growth and inflation data, particularly at the longer end of the curve, is critical to the trajectory of the economy and markets. With the 10-year Treasury yield around 4.5% and the two-year yield near 4.9%, we will see how well bond markets will tolerate the Fed’s relatively lax approach to the “last mile” of inflation. If yields rise much more, they will likely affect broader markets, especially rate-sensitive segments, including real estate, regional banks, non-profitable small caps, and low-end consumers. Conversely, if yields can stay contained, there could be plenty of runway for risky assets.
Our view remains that as long as higher rates persist, they will continue to accentuate the difference in prospects between faster-growing and/or highly profitable businesses relative to those that are not, creating a tailwind for active managers. While the immediate impact of any further easing by the Federal Reserve will likely be viewed as positive for all risky assets, persistent inflation could continue to frustrate efforts to manage it. The ongoing policy tug-of-war means opportunities and risks will ebb and flow, with significant implications for inflation and interest rates, which will, in turn, dictate economic activity. Ultimately, we believe the stability of the economy and markets hinges on keeping inflation and interest rates contained.
We also believe that there will be increased levels of volatility in equity and fixed income markets as the year progresses. The Federal Reserve remains focused on their dual mandate of ensuring lower levels of inflation while also targeting full employment. Investors remain focused on when the Fed will begin cutting rates. With inflation remaining sticky, the number of cuts has been significantly reduced from where we started the year and expectations for the first cut have been pushed to the fall. We continue to pay special attention to trends in earnings, as we feel earnings will be a key driver of equity returns for this year. The upcoming U.S. election and its potential effects on future fiscal policy will also be a key focus for markets in the coming months as the campaigning picks up steam.
We continue to favor high-quality stocks and bonds, rather than being overly aggressive with opportunities in lower quality assets. Investors should be prepared for changes to the yield curve over the next 12 months. We believe that a high-quality diversified asset allocation remains the best approach to navigate uncertainty in the coming year. During uncertain times, the key to successful investing is often remaining committed to long-term investment plans.
Citations
1. Bureau of Economic Analysis: https://www.bea.gov/data/gdp/gross-domestic-product
2. ISM: https://www.ismworld.org/supply-management-news-and-reports/reports/ism-report-on-business/pmi/may/
3. ISM: https://www.ismworld.org/supply-management-news-and-reports/reports/ism-report-on-business/services/may/
4. Bureau of Labor Statistics: https://bls.gov/cpi/home.htm
5. Reuters: https://www.reuters.com/markets/rates-bonds/fed-hold-rates-steady-inflation-dims-hopes-policy-easing-2024-05-01/
6. Federal Reserve: https://www.federalreserve.gov/mediacenter/files/FOMCpresconf20240501.pdf
7. CME Group: https://www.cmegroup.com/markets/interest-rates/cme-fedwatch-tool.html
8. FactSet: https://advantage.factset.com/hubfs/Website/Resources%20Section/Research%20Desk/Earnings%20Insight/EarningsInsight_053124.pdf
9. Wall Street Journal: https://www.wsj.com/finance/stocks/this-record-stock-market-is-riding-on-questionable-ai-assumptions-cb890703
10. PwC: https://www.pwc.com/gx/en/issues/data-and-analytics/publications/artificial-intelligence-study.html
11. McKinsey: https://www.mckinsey.com/capabilities/mckinsey-digital/our-insights/the-economic-potential-of-generative-ai-the-next-productivity-frontier
12. CNBC: https://www.cnbc.com/2023/05/24/nvidia-nvda-earnings-report-q1-2024.html
13. FactSet: https://insight.factset.com/highest-number-of-sp-500-companies-citing-ai-on-earnings-calls-over-past-10-years
14. International Energy Agency: https://iea.blob.core.windows.net/assets/6b2fd954-2017-408e-bf08-952fdd62118a/Electricity2024-Analysisandforecastto2026.pdf
15. Data Center Dynamics: https://www.datacenterdynamics.com/en/news/aws-acquires-talens-nuclear-data-center-campus-in-pennsylvania/
16. Newsweek: https://www.newsweek.com/why-ai-so-thirsty-data-centers-use-massive-amounts-water-1882374
17. Statista: https://www.statista.com/statistics/188521/total-us-electricity-net-generation/
18. Statista: https://www.statista.com/statistics/201794/us-electricity-consumption-since-1975/
19. Financial Times: https://markets.ft.com/data/announce/detail?dockey=600-202405150930PR_NEWS_USPRX____CL14418-1 20. Boston Consulting Group via LinkedIn: https://www.linkedin.com/pulse/impact-genai-electricity-how-fueling-data-center-boom-vivian-lee/
21. Financial Times: https://www.ft.com/content/ddaac44b-e245-4c8a-bf68-c773cc8f4e63
22. World Nuclear Association: https://world-nuclear.org/news-and-media/press-statements/net-zero-nuclear-industry-pledge-sets-goal-for-tri
23. NBC News: https://www.nbcnews.com/tech/tech-news/nuclear-power-oklo-sam-altman-ai-energy-rcna139094
24. CNBC: https://www.cnbc.com/2021/06/28/oklo-planning-nuclear-micro-reactors-that-run-off-nuclear-waste.html
25. American Nuclear Society: https://www.ans.org/news/article-5842/amazon-buys-nuclearpowered-data-center-from-talen/
26. Data Center Dynamics: https://www.datacenterdynamics.com/en/news/metas-mark-zuckerberg-says-energy-constraints-are-holding-back-ai-data-center-buildout/
27. Forbes: https://www.forbes.com/sites/cindygordon/2024/03/31/microsoft-and-openai-partnering-on-stargate-a-100b-us-data-center/
28. Reuters: https://www.reuters.com/technology/microsoft-openai-planning-100-billion-data-center-project-information-reports-2024-03-29/
29. World Nuclear Association: https://world-nuclear.org/information-library/current-and-future-generation/plans-for-new-reactors-worldwide
30. Statista: https://www.statista.com/statistics/712841/median-construction-time-for-reactors-since-1981/
31. FRED: https://fred.stlouisfed.org/series/CPIAUCS
32. Reaves Asset Management: https://info.reavesam.com/lp-why-is-the-utility-sector-heating-up-for-investors
33. AP News: https://apnews.com/article/india-election-results-2024-lok-sabha-modi-bjp-7893efecc83fa8225a611f174e6420ee
34. BBC: https://www.bbc.com/news/articles/cgee5n9jen9o
35. AP News: https://apnews.com/article/mexico-elections-president-governorships-lopez-obrador-d7fef5c7ac964072401ba6d9809dd7d4
36. Reuters: https://www.reuters.com/markets/global-markets-election-pix-graphic-2024-04-09/
37. AAA: https://gasprices.aaa.com/
Index Definitions
The S&P 500 Index is widely regarded as the best single gauge of the United States equity market. It includes 500 leading companies in leading industries of the U.S. economy. The S&P 500 focuses on the large cap segment of the market and covers approximately 75% of U.S. equities.
The Bloomberg Barclays U.S. Aggregate Index represents securities that are SEC-registered, taxable, and dollar denominated. The index covers the U.S. investment grade fixed rate bond market, with index components for government and corporate securities, mortgage pass-through securities, and asset-backed securities. Duration is roughly 5 years.
The Bloomberg U.S. Corporate High Yield Bond Index measures the USD-denominated, high yield, fixed-rate corporate bond market. Securities are classified as high yield if the middle rating of Moody’s, Fitch and S&P is Ba1/BB+/BB+ or below. Bonds from issuers with an emerging markets country of risk, based on the indices’ EM country definition, are excluded.
The Russell 1000® Value Index measures the performance of the large-cap value segment of the U.S. equity universe. It includes those Russell 1000 companies with lower price-to-book ratios and lower expected and historical growth rates.
The Russell 1000® Growth Index measures the performance of the large- cap growth segment of the US equity universe. It includes those Russell 1000 companies with relatively higher price-to-book ratios, higher I/B/E/S forecast medium term (2 year) growth and higher sales per share historical growth (5 years).
The Russell 2000® Index measures the performance of the small-cap segment of the US equity universe. It includes approximately 2000 of the smallest US equity securities in the Russell 3000 Index based on a combination of market capitalization and current index membership. The Russell 2000 Index represents approximately 10% of the total market capitalization of the Russell 3000 Index. Because the Russell 2000 serves as a proxy for lower quality, small cap stocks, it provides an appropriate benchmark for RMB Special Situations.
MSCI EAFE Index*: an equity index which captures large and mid-cap representation across 21 of 23 Developed Markets countries around the world, excluding the U.S. and Canada. With 926 constituents, the index covers approximately 85% of the free float-adjusted market capitalization in each country.
The MSCI Emerging Markets Index* measures equity market performance in the global emerging markets universe. It covers over 2,700 securities in 21 markets that are currently classified as EM countries. The MSCI EM Index universe spans large, mid and small cap securities and can be segmented across all styles and sectors.
The U.S. Dollar Index is used to measure the value of the dollar against a basket of six foreign currencies: the euro, Swiss franc, Japanese yen, Canadian dollar, British pound, and Swedish krona.
The Deutsche Bank EM FX Equally Weighted Spot Index, an equal-weighted basket of 21 emerging market currencies.
MSCI U.S. REIT Index is a free float-adjusted market capitalization weighted index that is comprised of equity Real Estate Investment Trusts (REITs). The index is based on the MSCI USA Investable Market Index (IMI), its parent index, which captures the large, mid and small cap segments of the USA market. With 150 constituents, it represents about 99% of the US REIT universe and securities are classified under the Equity REITs Industry (under the Real Estate Sector) according to the Global Industry Classification Standard (GICS®), have core real estate exposure (i.e., only selected Specialized REITs are eligible) and carry REIT tax status.
*Source: MSCI.MSCI makes no express or implied warranties or representations and shall have no liability whatsoever with respect to any MSCI data contained herein. The MSCI data may not be further redistributed or used as a basis for other indexes or any securities or financial products. This report is not approved, endorsed, reviewed or produced by MSCI. None of the MSCI data is intended to constitute investment advice or a recommendation to make (or refrain from making) any kind of investment decision and may not be relied on as such.
Performance Disclosures
All market pricing and performance data from Bloomberg, unless otherwise cited. Asset class and sector performance are gross of fees unless otherwise indicated.
The opinions and analyses expressed in this newsletter are based on Curi RMB Capital, LLC’s (“Curi RMB”) research and professional experience are expressed as of the date of our mailing of this newsletter. Certain information expressed represents an assessment at a specific point in time and is not intended to be a forecast or guarantee of future results, nor is it intended to speak to any future time periods. Curi RMB makes no warranty or representation, express or implied, nor does Curi RMB accept any liability, with respect to the information and data set forth herein, and Curi RMB specifically disclaims any duty to update any of the information and data contained in this newsletter. The information and data in this newsletter does not constitute legal, tax, accounting, investment or other professional advice. Returns are presented net of fees. An investment cannot be made directly in an index. The index data assumes reinvestment of all income and does not bear fees, taxes, or transaction costs. The investment strategy and types of securities held by the comparison index may be substantially different from the investment strategy and types of securities held by your account. RMB Asset Management is a division of Curi RMB Capital.