


Key Takeaways
- In April, rising bond yields and increased geopolitical tensions put pressure on the stock market. U.S. large cap stocks declined 4.1%, while small cap stocks ended the month down 7.0%.
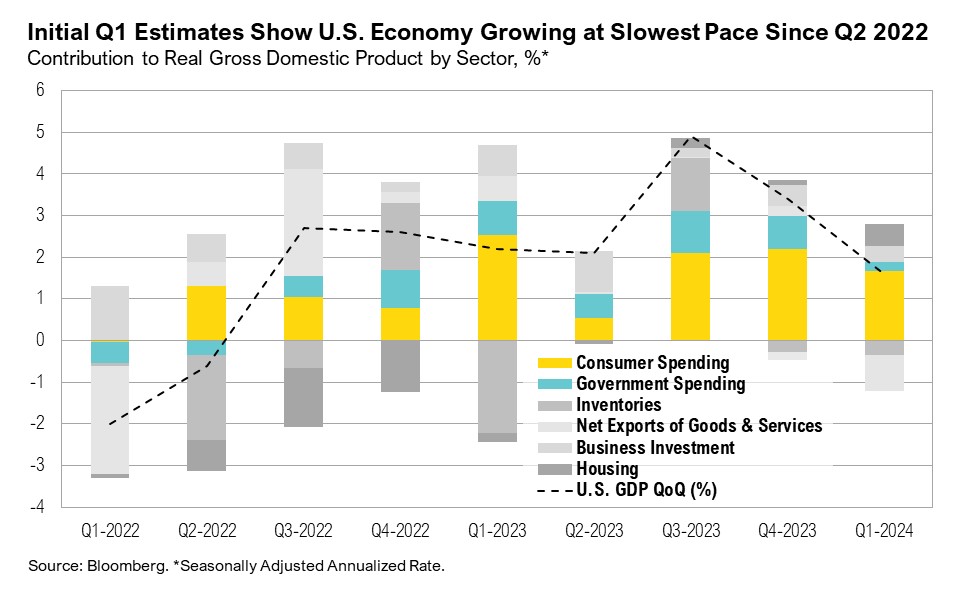
- Preliminary estimates show the U.S. economy grew by 1.6% in the first quarter, the slowest pace in nearly two years. With three consecutive warmer-than-expected CPI prints, inflation remains well above 2%, and market expectations for rate cuts are fading.
- Policy differences are emerging between the U.S. Department of Treasury, which is focusing on robust economic growth, and the Federal Reserve, which has a dual mandate of maintaining long-term inflation and employment targets.
- The tug-of-war between these two groups will cause opportunities and risks to ebb and flow. It remains critical that inflation and interest rates stay contained to support the economy and markets.
Overview
Throughout April, rising bond yields and geopolitical tensions placed pressure on the stock market. U.S. large cap stocks ended the month down 4.1%, making it the third-worst April since 1980. U.S. small cap stocks ended the month down 7.0% due to sticky inflation and dwindling hopes of interest rate cuts. U.S. intermediate-term bonds ended the month down 2.5% on similar concerns.
Preliminary estimates indicate that in the first quarter of 2024 the U.S. economy expanded by an annualized 1.6%, the slowest pace in nearly two years. This gross domestic product (GDP) figure falls below the estimated 2.5% and is nearly half the 3.4% that the economy grew by during the fourth quarter. The slower-than-expected growth was largely due to a decline in government spending, which dropped from 4.6% in the fourth quarter to 1.2% and highlights the economy’s reliance on this source for its growth.1 Trade and inventories, the most volatile GDP components, declined by 0.9% and 0.4%, respectively, though these figures are subject to revision.1 Domestic demand remained robust: the consumer spending component of GDP grew at 2.5% in the first quarter while business investment ticked up.1 In the words of JPMorgan CEO Jamie Dimon:
“In spite of the unsettling landscape, including last year’s regional bank turmoil, the U.S. economy continues to be resilient, with consumers still spending, and the markets currently expecting a soft landing. It is important to note that the economy is being fueled by large amounts of government deficit spending and past stimulus.”2
Inflation remains well above the Federal Reserve’s stated 2% target. The March CPI report, released earlier in April, showed headline CPI increasing to 3.5% year-over-year, and core CPI climbing to 3.8% year-over-year. The personal consumption expenditure (PCE) price index—the Federal Reserve’s preferred inflation gauge—remains sticky, increasing to 2.7% year-over-year in March.3 Notably, consumer inflation expectations have changed direction. In March, consumers were anticipating short-term inflation rates of 2.9% and longer-term rates of 2.8%, but by April, the short-term outlook had risen to 3.2% and the long-term outlook to 3.0%.4
As recent and expected inflation have pushed higher, market expectations for interest rate cuts have been pulled in the other direction. At the start of January, markets were anticipating the equivalent of seven rate cuts in 2024. However, by the end of April, expectations had shifted dramatically, and markets priced in the equivalent of only one rate cut, which will likely not occur until the Federal Open Market Committee’s (FOMC) meeting in September.5 The bond market’s sensitivity to inflation and interest rate expectations has been particularly pronounced. Over the past month, Treasury yields climbed to the highest level since November 2023. Specifically, the 10-year Treasury yield ended April at 4.7% while the 2-year Treasury yield closed the month at 5.0%.
Policy Tug of War
A policy tug-of-war has emerged between the U.S. Department of Treasury and the Federal Reserve, each with a different goal in mind. The Treasury is prioritizing deficit-financed economic growth, even if that means a worsening U.S. fiscal situation and sticky inflation. In contrast, the Fed is focused on setting policy to support its dual mandate and move inflation back toward its 2% target.
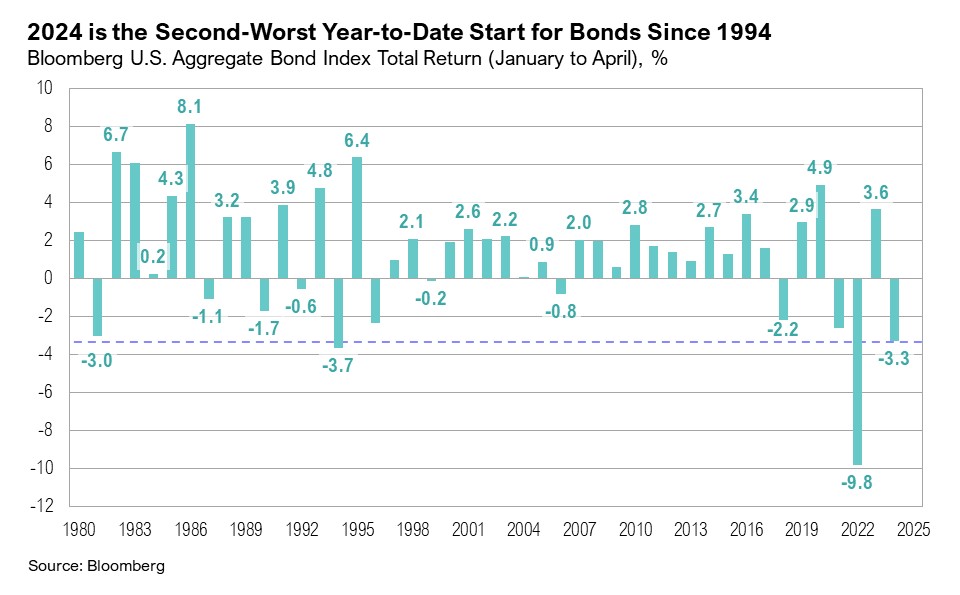
The Fed has kept interest rates unchanged since June 2023, opting to wait for further evidence that inflation is moving back down to 2% before cutting rates. For the past 10 months, interest rates have remained at their highest level in nearly two decades. Higher interest rates, and the increasing likelihood of rates remaining elevated, have been pressuring rate-sensitive areas of the market. U.S. REITs ended April down 7.1% and are now down 7.4% year-to-date. Regional banks ended the month down 6.5% and the year down 11.0%. U.S. intermediate-term bonds, as measured by the Bloomberg U.S. Aggregate Bond Index, are down 3.3% year-to-date, making the first four months of 2024 the second worst for U.S. bonds since 1994.
But U.S. Treasury Secretary Janet Yellen has different motives, and for now, at least, she seems convinced that prioritizing economic growth above all else is in the best interests of the country. As such, Yellen has long advocated for the Federal Reserve to cut interest rates. In a recent interview with Reuters, Yellen emphasized the strength of the U.S. economy and the likelihood that the preliminary 1.6% first-quarter GDP estimates would be revised higher.6 Further, Yellen downplayed the recent spike in inflation, citing “peculiar” factors that are not indicative of the underlying strength of the economy.6 She expressed confidence that inflation would return to the Fed's target of 2% without an increase in unemployment or a cooling of other sectors of the economy.6
Treasury's push for the Fed to cut rates comes as high interest rates drive net interest payments to unprecedented levels. The U.S. federal budget deficit continues to grow, surpassing $1 trillion in the first seven months of the fiscal year, largely fueled by higher interest costs on national debt.7 Treasury’s recent borrowing estimates show that it needs to borrow $243 billion in the second quarter—$41 billion more than initially anticipated—and a whopping $847 billion in the third quarter.8 Outside of 2023, this will be the largest third-quarter issuance in more than 20 years. The Fed’s upcoming policy decisions will significantly influence the government’s interest payments. According to Bank of America, if interest rates remain unchanged, annual interest payments are projected to hit $1.7 trillion by April 2025. Conversely, six 25 basis-point cuts (a 1.5% overall reduction in the current interest rate) over the next year could reduce these payments by $500 billion, lowering them to $1.2 trillion by April 2025.9
On April 16, less than a week after the warmer-than-expected March CPI report was released, Fed Chair Powell told a forum in Washington:
“The recent data have clearly not given us greater confidence and instead indicate that it’s likely to take longer than expected to achieve that confidence. Right now, given the strength of the labor market and progress on inflation so far, it’s appropriate to allow restrictive policy further time to work.”10
However, the Fed seems to be overlooking three months of higher-than-expected inflation and the fact that inflation has been above its target for over three years. Two weeks after making the above statement, at the May 1 Federal Open Market Committee (FOMC) meeting, Powell announced plans to slow the pace of the balance sheet runoff. Starting June 1, the Fed will lower the cap on the amount of maturing Treasury securities that will not be replaced from $60 billion to $25 billion.11 Although the reduction in the balance sheet runoff was widely anticipated, it was implemented more aggressively than expected. The Fed’s decision to taper quantitative tightening indicates a more accommodative approach to higher inflation, and it effectively incrementally eased monetary policy. The decision contradicts Powell’s statement made on April 16 that monetary policy needed “further time to work” before the Fed would consider additional loosening, and it underpins both the challenging policy mix currently at play in the U.S. as well as the potential political implications in an election year.10
Washington’s loose fiscal policy is at odds with the Fed’s efforts to cool the economy and could make getting inflation back to 2% harder to achieve while exacerbating the government’s debt burden. Despite continuing to navigate higher interest rates and sticky inflation, Fed Chair Powell apparently remains upbeat about the economy, finding common ground with Treasury Secretary Janet Yellen. However, given how the Fed was caught off guard by the persistence of inflation in 2022 and 2023, as well as the uptick over the past three months, one wonders how Powell’s perspective on the economy will hold up throughout the rest of the year. As this policy tug-of-war continues, it is unclear who will ultimately prevail.
Markets
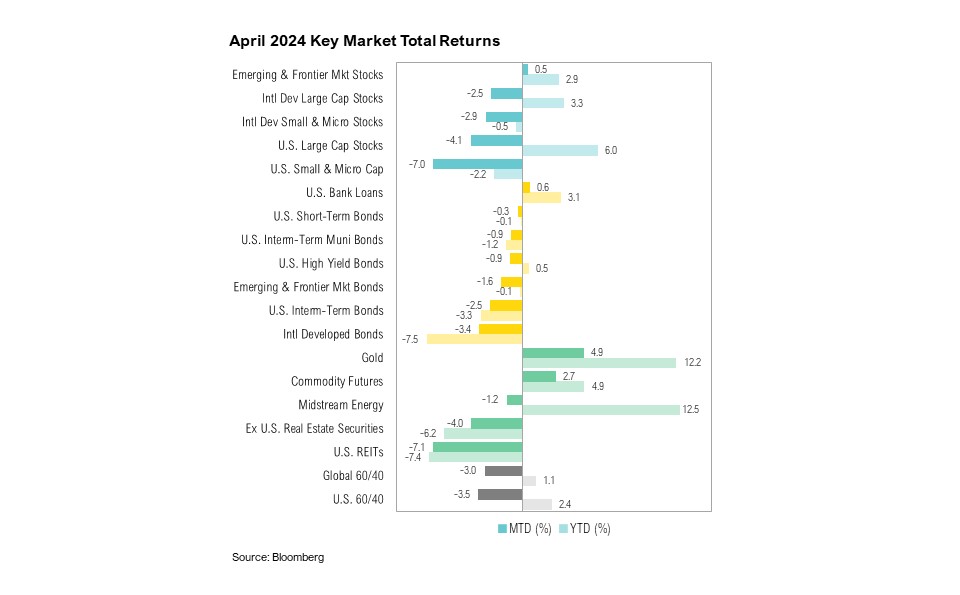
Returns were negative across most asset classes in April. International developed market large cap stocks fared slightly better than U.S. large cap stocks. The former ended April down 2.5%, and the latter ended the month down 4.1%. U.S. small cap stocks ended the month down 7.0% while emerging and frontier market equities ended the month up 0.5%. The only equity asset class to end April with positive returns was emerging and frontier market stocks, primarily due to strong performance in China (+11.2%), Turkey (+16.6%), and Hungary (+6.1%). U.S. intermediate-term bonds ended the month down 2.5% and are now down 3.3% year to date. Gold and commodity futures fared best, ending April up 4.9% and 2.7%, respectively.
Looking Forward
The Treasury is advocating for the Fed to support bond markets via rate cuts, as interest payments will continue to balloon if rates remain unchanged. However, loose fiscal policy makes the Fed’s attempt to get inflation back to 2% more difficult, while exacerbating the growing U.S. debt burden. As such, we continue to monitor the bond market’s reaction to incoming growth and inflation data, particularly at the longer end of the curve. With the 10-year Treasury yield around 4.5% and the 2-year yield nearing 5.0%, we will see how well long bond markets will tolerate the Fed’s relatively lax approach to the “last mile” of inflation. If yields rise much more, they will also likely affect the broader markets, especially rate-sensitive segments, including real estate markets, regional banks, non-profitable small caps, and the low-end consumer. Indeed, small business job creation plans are back to the lowest levels since May 2020; in the words of the National Federation of Independent Business, they are “below what would be typical in a strong growth economy.”12
As for the rest of the market, our view remains that higher rates will continue to create a tailwind for active managers. While the immediate impact of any further easing by the Federal Reserve will likely be viewed as a positive for all risky assets, persistent inflation could continue to frustrate to the upside.
We continue to believe that there will be volatility in equity and fixed income markets in the coming year. The Federal Reserve remains focused on their dual mandate of ensuring lower levels of inflation while also targeting full employment. Investors are focused on when the Fed will begin cutting rates, and with inflation remaining sticky, expectations for the first cut have been pushed to later this year. We continue to pay special attention to trends in earnings, as we feel earnings will be a key driver of equity returns for this year. The upcoming U.S. election and its potential effects on future fiscal policy will also be a key focus for markets in the coming months as campaigning picks up steam.
We continue to favor high-quality stocks and bonds, rather than being overly aggressive with opportunities in lower quality assets. Investors should be prepared for changes to the yield curve over the next 12 months. We believe that a high-quality diversified asset allocation remains the best approach to navigate uncertainty in the coming year. During uncertain times, the key to successful investing is often remaining committed to long-term investment plans.
Citations
1. Bureau of Economic Analysis: https://www.bea.gov/data/gdp/gross-domestic-product
2. JPMorgan Chase & Co: https://reports.jpmorganchase.com/investor-relations/2023/ar-ceo-letters.htm
3. Bureau of Economic Analysis: https://www.bea.gov/data/personal-consumption-expenditures-price-index
4. Investing.com: https://www.investing.com/economic-calendar/
5. CME FedWatch: https://www.cmegroup.com/markets/interest-rates/cme-fedwatch-tool.html
6. Reuters: https://www.reuters.com/markets/us/yellen-says-economy-performing-well-inflation-will-ebb-2024-04-25/
7. Bureau of the Fiscal Service: https://www.fiscal.treasury.gov/reports-statements/mts/current.html
8. U.S. Department of Treasury: https://home.treasury.gov/news/press-releases/jy2304
9. Bank of America Global Research via The Daily Shot: https://us10.campaign-archive.com/?e=c59d0e783a&u=451473e81730c5a3ae680c489&id=1eab4c797e
10. Reuters: https://www.reuters.com/markets/us/feds-powell-jefferson-square-restrictive-policy-with-strong-data-2024-04-16/
11. Federal Reserve: https://www.federalreserve.gov/mediacenter/files/FOMCpresconf20240501.pdf
12. NFIB: https://strgnfibcom.blob.core.windows.net/nfibcom/April-2024-Jobs-Report.pdf
Index Definitions
The S&P 500 Index is widely regarded as the best single gauge of the United States equity market. It includes 500 leading companies in leading industries of the U.S. economy. The S&P 500 focuses on the large cap segment of the market and covers approximately 75% of U.S. equities.
The Bloomberg Barclays U.S. Aggregate Index represents securities that are SEC-registered, taxable, and dollar denominated. The index covers the U.S. investment grade fixed rate bond market, with index components for government and corporate securities, mortgage pass-through securities, and asset-backed securities. Duration is roughly 5 years.
The Bloomberg U.S. Corporate High Yield Bond Index measures the USD-denominated, high yield, fixed-rate corporate bond market. Securities are classified as high yield if the middle rating of Moody’s, Fitch and S&P is Ba1/BB+/BB+ or below. Bonds from issuers with an emerging markets country of risk, based on the indices’ EM country definition, are excluded.
The Russell 1000® Value Index measures the performance of the large-cap value segment of the U.S. equity universe. It includes those Russell 1000 companies with lower price-to-book ratios and lower expected and historical growth rates.
The Russell 1000® Growth Index measures the performance of the large- cap growth segment of the US equity universe. It includes those Russell 1000 companies with relatively higher price-to-book ratios, higher I/B/E/S forecast medium term (2 year) growth and higher sales per share historical growth (5 years).
The Russell 2000® Index measures the performance of the small-cap segment of the US equity universe. It includes approximately 2000 of the smallest US equity securities in the Russell 3000 Index based on a combination of market capitalization and current index membership. The Russell 2000 Index represents approximately 10% of the total market capitalization of the Russell 3000 Index. Because the Russell 2000 serves as a proxy for lower quality, small cap stocks, it provides an appropriate benchmark for RMB Special Situations.
MSCI EAFE Index*: an equity index which captures large and mid-cap representation across 21 of 23 Developed Markets countries around the world, excluding the U.S. and Canada. With 926 constituents, the index covers approximately 85% of the free float-adjusted market capitalization in each country.
The MSCI Emerging Markets Index* measures equity market performance in the global emerging markets universe. It covers over 2,700 securities in 21 markets that are currently classified as EM countries. The MSCI EM Index universe spans large, mid and small cap securities and can be segmented across all styles and sectors.
The U.S. Dollar Index is used to measure the value of the dollar against a basket of six foreign currencies: the euro, Swiss franc, Japanese yen, Canadian dollar, British pound, and Swedish krona.
The Deutsche Bank EM FX Equally Weighted Spot Index, an equal-weighted basket of 21 emerging market currencies.
MSCI U.S. REIT Index is a free float-adjusted market capitalization weighted index that is comprised of equity Real Estate Investment Trusts (REITs). The index is based on the MSCI USA Investable Market Index (IMI), its parent index, which captures the large, mid and small cap segments of the USA market. With 150 constituents, it represents about 99% of the US REIT universe and securities are classified under the Equity REITs Industry (under the Real Estate Sector) according to the Global Industry Classification Standard (GICS®), have core real estate exposure (i.e., only selected Specialized REITs are eligible) and carry REIT tax status.
*Source: MSCI.MSCI makes no express or implied warranties or representations and shall have no liability whatsoever with respect to any MSCI data contained herein. The MSCI data may not be further redistributed or used as a basis for other indexes or any securities or financial products. This report is not approved, endorsed, reviewed or produced by MSCI. None of the MSCI data is intended to constitute investment advice or a recommendation to make (or refrain from making) any kind of investment decision and may not be relied on as such.
Performance Disclosures
All market pricing and performance data from Bloomberg, unless otherwise cited. Asset class and sector performance are gross of fees unless otherwise indicated.
The opinions and analyses expressed in this newsletter are based on Curi RMB Capital, LLC’s (“Curi RMB”) research and professional experience are expressed as of the date of our mailing of this newsletter. Certain information expressed represents an assessment at a specific point in time and is not intended to be a forecast or guarantee of future results, nor is it intended to speak to any future time periods. Curi RMB makes no warranty or representation, express or implied, nor does Curi RMB accept any liability, with respect to the information and data set forth herein, and Curi RMB specifically disclaims any duty to update any of the information and data contained in this newsletter. The information and data in this newsletter does not constitute legal, tax, accounting, investment or other professional advice. Returns are presented net of fees. An investment cannot be made directly in an index. The index data assumes reinvestment of all income and does not bear fees, taxes, or transaction costs. The investment strategy and types of securities held by the comparison index may be substantially different from the investment strategy and types of securities held by your account. RMB Asset Management is a division of Curi RMB Capital.