
Key Takeaways
- U.S. small cap stocks ended July up 10%, while U.S. large cap stocks ended the month up 1%, the widest relative performance spread since February 2000.
- After a prolonged period of favoring mega-cap technology stocks, investors turned their attention to small cap stocks due to a mild June inflation report, anticipation of expected interest rate cuts, and election developments.
- The Bank of Japan hiked interest rates on July 31, which, along with currency intervention, led to a strengthening of the yen. This has put carry traders in a difficult position, as they now face higher U.S. dollar repayment costs.
- Several market and political races will compete for investors’ attention, and, as we have seen in recent weeks, will likely contribute to market volatility in the coming months.
Overview
Much like an Olympic athlete in Paris, U.S. small cap stocks delivered a gold medal performance in July, ending the month up 10%. U.S. large cap stocks lagged, ending the month up 1%. At 9%, July was the third-widest monthly spread between U.S. small cap and U.S. large cap stocks since 1980, with only February 2000, 18%, and January 1992, 10%, exceeding it. Encouraged by the increasing likelihood of imminent interest rate cuts, U.S. intermediate-term bonds ended July up more than 2%.
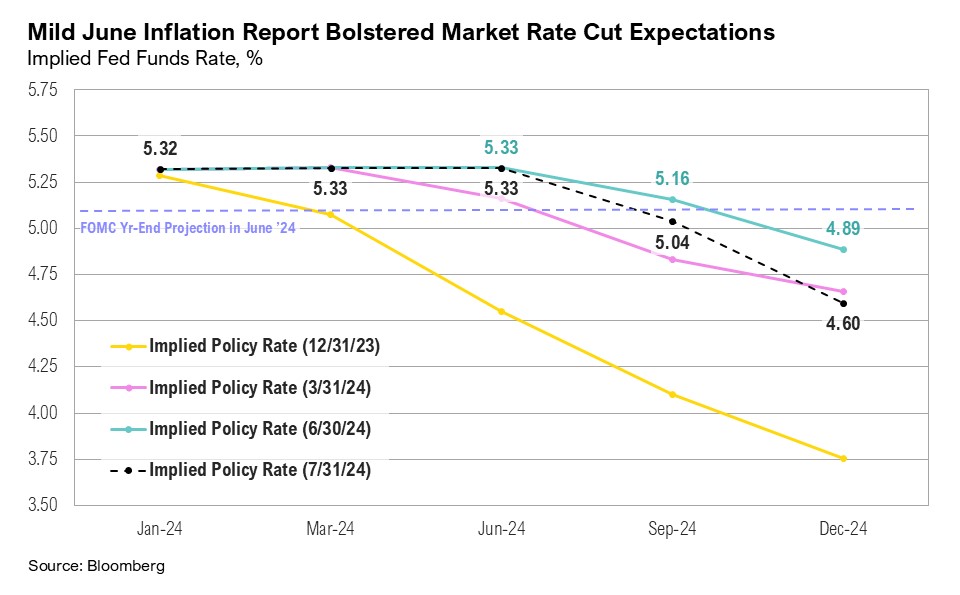
The June inflation report showed prices rising at a slower-than-expected pace, reaching the lowest point since early 2021. Headline inflation eased from 3.3% year-over-year to 3.0%, with the monthly rate showing a 0.1% decline—the first month-over-month decrease in four years. 1 Core inflation also ticked lower in June, from 3.4% year-over-year to 3.3%. 2 Bolstered by the mild inflation report, markets started to price in the probability of a 50-basis point interest rate cut at the September Federal Open Market Committee (FOMC) meeting. As of the end of July, markets were pricing in the equivalent of three rate cuts for 2024, despite there being only three FOMC meetings remaining this year. At the July FOMC meeting, held on the last day of the month, Federal Reserve Chair Jerome Powell acknowledged the increasing likelihood of an imminent interest rate cut, saying, “A reduction in our policy rate could be on the table for as soon as the next meeting in September.” 3 Powell also emphasized that any decision to cut rates in September would be apolitical, asserting that the Fed “would never try to make policy decisions based on the outcome of an election that hasn’t happened yet.” 3
Continued signs of a cooling labor market are also clearing the way for the Fed to cut interest rates. Job openings dipped in June, from 8.23 to 8.18 million, and are now down over 30% from their peak of 12.18 million in March 2022. 4 The U.S. economy added only 114,000 new jobs in July, while the unemployment rate ticked up from 4.1% to 4.3%. Excluding the pandemic, this is the highest unemployment rate since September 2017. 5
Preliminary second-quarter gross domestic product (GDP) results indicated that the U.S. economy grew at a respectable annualized rate of 2.8% quarter over quarter. 6 This growth was largely driven by a reacceleration in government spending, which rose from 1.8% in the first quarter to 3.1% in the second quarter. However, though these preliminary results are subject to revision, government spending continues unchecked. With two months remaining in the 2024 fiscal year, which runs from October 1 to September 30, the fiscal deficit has surpassed $1.2 trillion. 7 This is a marginal improvement over the $1.4 trillion deficit recorded at the same time last year. 8 On July 29, Treasury announced its net marketable borrowing estimates for the third and fourth quarters. These estimates imply that borrowing in 2024 will exceed $2.2 trillion, the second largest on record after 2020. For context, during the outset of the COVID-19 pandemic in 2020, the Treasury issued $4.3 trillion in net debt. 9
By the end of July, over 70% of the S&P 500 had reported earnings for the second quarter. Continuing a trend from the first quarter, four of the Magnificent Seven companies—Amazon, Google, Meta, and Nvidia—are expected to report year-over-year earnings growth of 56.4% for the second quarter. 10 Excluding these four, the other 496 S&P 500 companies are expected to see earnings growth of 5.7% for the second quarter. 10 Notably, these 496 companies are forecast to reach double-digit earnings growth of 15.6% by the fourth quarter. 10 Overall, the second-quarter earnings growth rate for the entire S&P 500 is anticipated to be 11.5%. 11
Passing the Baton
At the start of July, the Russell 2000 Index of U.S. small cap stocks was underperforming U.S. large cap stocks (proxied by the S&P 500) by 5.9% over the past decade—the fourth-worst decade for small caps relative to large caps in a century. 12 Year-to-date, small cap stocks had gained only 1.7%, compared to the 15.3% gain made by large cap stocks. Then came July, when U.S. small cap stocks sprinted ahead to end the month up 10%, outperforming their large cap counterparts by 9%—the widest monthly spread since February 2000.

After months of mostly underweighting the asset class in favor of the mega-cap Magnificent Seven companies, investors surged into U.S. small cap stocks at a rapid pace, and small cap funds experienced some of the strongest weekly inflows on record over the past month. 12,13 Two key factors likely contributed to this rally: the mild June inflation report and recent election developments (including the June 25 presidential debate and President Biden’s subsequent withdrawal on July 21 from the presidential race).
Although the rally in small cap stocks evoked memories of 2000—a period when small caps continued to outperform for years—distinct differences raise questions about the sustainability of the recent rally. One key difference is that, before this year’s rally, there was a dramatic rise in heavily shorted securities, as indicated by the GS Most Shorted Index, which reached its highest level since September 2022. This suggests that much of the rally in small cap stocks was likely the result of short covering and investors’ desire to rebalance away from extreme positions. Short covering occurs when investors who have sold stocks short buy them back to close their short positions, often to limit losses or lock in profits, and these purchases can push stock prices higher. The small cap rally likely also represented a de-risking event in which investors sought to reduce their exposure to large-cap positions. According to the Bank of America’s Global Fund Manager Survey, the “long Magnificent Seven” has been the most overcrowded trade for several quarters. 14 However, mega-cap stocks are also less expensive than they were in 2000. The average price-to-earnings (PE) ratio of the S&P 500 Information Technology Index peaked at 32x on July 10, compared to a peak of 59x on March 24, 2000. Furthermore, smaller companies are less profitable today than they were then: 41% of companies in the Russell 2000 now have negative earnings, compared to 19% in March 2000. 15
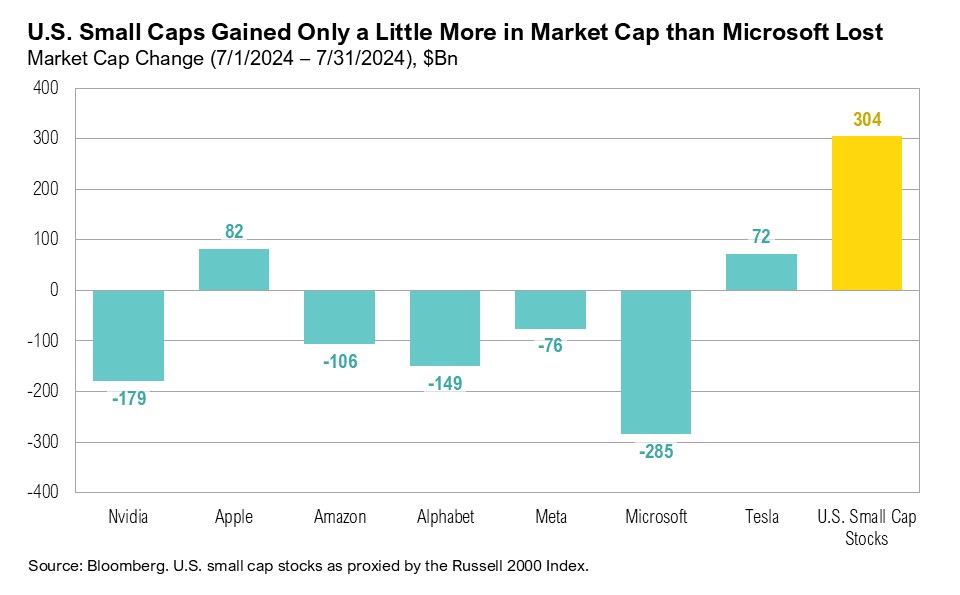
After gaining 37% in the first six months of the year, the Magnificent Seven ended July down 1.2%, erasing over $640 billion in market cap. Despite the rally in small caps, the entire Russell 2000 Index’s market cap gain of $304 billion in July was little more than what Microsoft alone lost in terms of market cap over the same period.
Earnings will likely play the deciding role in the sustainability of the rally. As of the end of July, Bloomberg Consensus showed earnings growth for the Magnificent Seven rising by 46% in 2024, while slowing to a still impressive 20% in 2025. In contrast, earnings growth expectations for the Russell 2000 in 2024 are more modest at 3% but are projected to jump to 36% in 2025. If the earnings growth for U.S. small cap stocks materializes, the rotation may turn out to be sustainable. A smooth pass of the baton from long-favored large cap stocks to their small cap counterparts would likely suggest a certain level of economic resiliency.
On July 21, President Joe Biden officially announced his withdrawal from the presidential race and endorsed current Vice President Kamala Harris as the new Democratic presidential nominee. Up until President Biden’s decision to withdraw, former President Donald Trump had been leading in the polls, and betting markets favored a 64% probability of a Trump win over a 36% probability of a Biden win. 16,17,18 With this historic spread, which endured for most of July, and based on recent performance of several sectors, it seems that markets were looking back to 2016 for a possible repeat of history, as U.S. small cap stocks increased by 18.3% in the two months following the Trump election in 2016. As of the end of July, the spread between Trump and the now-Democratic nominee Harris had narrowed to roughly a 50/50 split. 16,17,18
Now that the political baton has been passed to a new Democratic candidate, markets are dealing with the inevitable volatility that typically characterizes a closely contested election. History suggests that the seasonal trends of U.S. large cap stocks tend to be influenced by whether the incumbent president runs for re-election or not.

In scenarios where the incumbent is running, summer trading has generally been subdued, and the S&P 500 has shown a gradual upward trend, followed by a slight decline towards the end of August. Conversely, in years when the incumbent does not seek re-election, trading during the summer months has tended to exhibit greater choppiness and volatility has extended from August through November. Thus, volatility at this point in the election cycle is quite normal and to be expected. In more ways than one, the race is on.
Markets
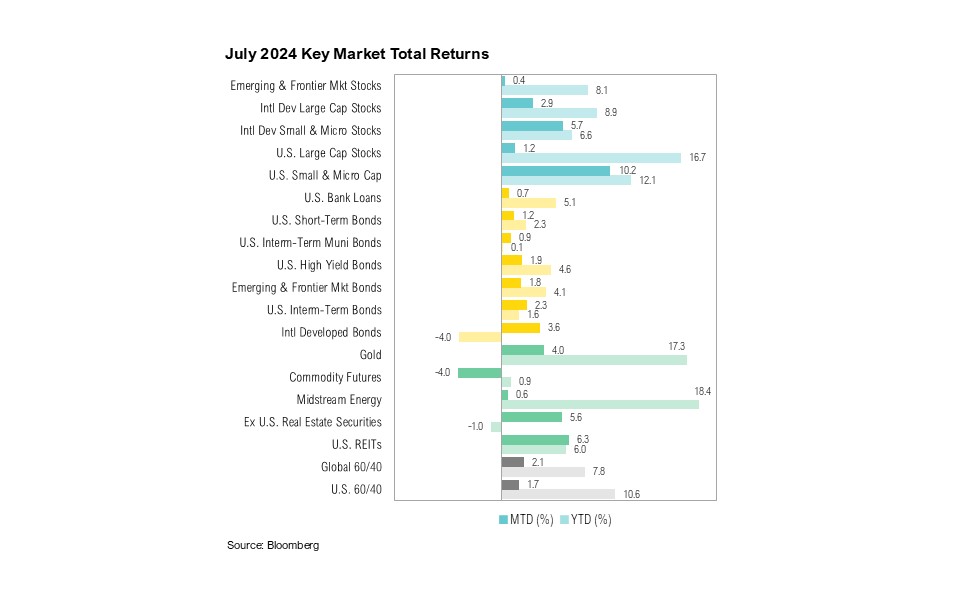
In addition to the strong returns for U.S. small cap stocks during the month of July, U.S. REITs gained 6.3%, as interest rate-sensitive areas of the market celebrated the milder inflation report and increasing likelihood of rate cuts. U.S. intermediate-term bonds gained 2.3% on similar sentiment. International small cap stocks outperformed their large cap counterparts. The former ended July up 5.7%, and the latter ended the month up 2.9%. Gold ended the month up 4.0%, reaching a new high of $2,471 per ounce on July 18. Commodity futures were the worst-performing sector, ending the month down 4.0%, followed by emerging and frontier market stocks, which gained only 0.4%.
The 10-year minus 2-year Treasury yield, a common indicator of economic growth and general representation of the Treasury yield curve, reached -0.09 basis points on July 24, the nearest point of dis-inverting since it inverted on July 6, 2022. 19 As of the end of July, the yield curve had been inverted for 523 consecutive trading days—the longest on record, with or without a recession.
The first week of August brought with it increased volatility for equity and fixed income markets around the world. Recession fears have been reignited following a weaker than expected July jobs report. Following the weak jobs report, investors are now disappointed that the Federal Reserve did not lower its target interest rate at the July meeting. Equity markets saw their biggest one-day decline in nearly two years on Monday, August 5, and treasury yields moved sharply lower.
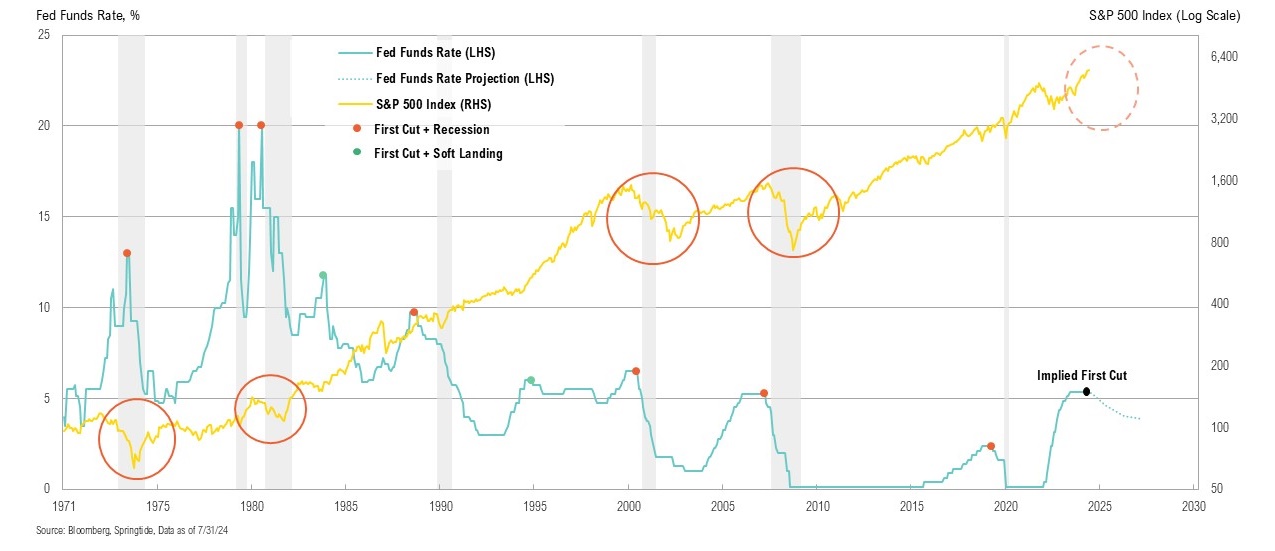
Along with these market moves, the interest rate expectations for the remainder of the year increased. Even with the FOMC meeting still over 40 days away, an interest rate cut at the next meeting seems highly likely. History has shown that the first interest rate cut is often not a good signal for the stock market. Hence, we would continue to be cautious with risk allocations and continue to monitor how this cycle develops.
Looking Forward
Aside from the Olympics, several other market and political races will compete for investors’ attention—and likely contribute to market volatility—in the coming months. This includes volatility in interest rates as bond investors balance the competing forces of slowing growth, the start of an imminent rate-cutting cycle, and fiscal spending that continues at crisis-era levels. After driving inflation lower with its restrictive monetary policy, there is now concern that the Federal Reserve is behind the curve in easing its policy stance. Investors will be waiting and watching closely as the next FOMC meeting approaches in September.
Given all the uncertainty and increased volatility in markets, we continue to be cautious with risk assets as the current cycle continues to play out in the coming weeks and months. Although lower asset prices would be a welcome development and an opportunity to put additional capital to work, typical election year seasonals—coupled with still-high equity valuations—suggest that there is no rush. We remain biased towards high-quality companies within our core stock portfolios. We have been well-positioned within core bond portfolios with a low weight toward shorter duration corporate bonds and a higher weight toward longer-duration treasury bonds. That said, as with the Olympics, only time will tell who the ultimate winners in several of these races will be. Until then, we believe clients are best served reminding themselves of the timeless principles of patience and diversification. The key to successful investing is often remaining committed to long-term investment plans.
Citations
- FRED: https://fred.stlouisfed.org/series/CPIAUCSL#0
- Bureau of Labor Statistics: https://www.bls.gov/news.release/cpi.nr0.htm
- CNBC: https://www.cnbc.com/2024/07/31/fed-meeting-live-updates-traders-brace-for-central-banks-rate-policy-outlook.html
- FRED: https://fred.stlouisfed.org/series/JTSJOL
- Bureau of Labor Statistics: https://www.bls.gov/charts/employment-situation/civilian-unemployment-rate.htm
- Bureau of Economic Analysis: https://www.bea.gov/data/gdp/gross-domestic-product
- Bureau of the Fiscal Service: https://www.fiscal.treasury.gov/files/reports-statements/mts/mts0624.pdf
- Bureau of the Fiscal Service: https://www.fiscal.treasury.gov/files/reports-statements/mts/mts0623.pdf
- U.S. Department of the Treasury: https://home.treasury.gov/news/press-releases/jy2506
- FactSet: https://insight.factset.com/which-magnificent-7-companies-are-top-contributors-to-earnings-growth-for-the-sp-500-for-q2
- FactSet: https://advantage.factset.com/hubfs/Website/Resources%20Section/Research%20Desk/Earnings%20Insight/EarningsInsight_080224A.pdf
- Russell Investments: https://russellinvestments.com/us/blog/small-cap-rally-fast-furious
- Isabelnet via Bank of America: https://www.isabelnet.com/flow-into-u-s-small-cap-stocks/
- Morningstar: https://www.morningstar.com/news/marketwatch/2024061853/long-magnificent-seven-is-now-one-of-the-most-crowded-trades-on-record-new-poll-shows
- Apollo: https://www.apolloacademy.com/small-cap-vs-large-cap-earnings-expectations/
- PredictIt: https://www.predictit.org/markets/detail/7456/Who-will-win-the-2024-US-presidential-election
- Polymarket: https://polymarket.com/elections
- 270ToWin: https://www.270towin.com/2024-presidential-election-polls/
- FRED: https://fred.stlouisfed.org/series/T10Y2Y
Index Definitions
The S&P 500 Index is widely regarded as the best single gauge of the United States equity market. It includes 500 leading companies in leading industries of the U.S. economy. The S&P 500 focuses on the large cap segment of the market and covers approximately 75% of U.S. equities.
The Bloomberg Barclays U.S. Aggregate Index represents securities that are SEC-registered, taxable, and dollar denominated. The index covers the U.S. investment grade fixed rate bond market, with index components for government and corporate securities, mortgage pass-through securities, and asset-backed securities. Duration is roughly 5 years.
The Bloomberg U.S. Corporate High Yield Bond Index measures the USD-denominated, high yield, fixed-rate corporate bond market. Securities are classified as high yield if the middle rating of Moody’s, Fitch and S&P is Ba1/BB+/BB+ or below. Bonds from issuers with an emerging markets country of risk, based on the indices’ EM country definition, are excluded.
The Russell 1000® Value Index measures the performance of the large-cap value segment of the U.S. equity universe. It includes those Russell 1000 companies with lower price-to-book ratios and lower expected and historical growth rates.
The Russell 1000® Growth Index measures the performance of the large- cap growth segment of the US equity universe. It includes those Russell 1000 companies with relatively higher price-to-book ratios, higher I/B/E/S forecast medium term (2 year) growth and higher sales per share historical growth (5 years).
The Russell 2000® Index measures the performance of the small-cap segment of the US equity universe. It includes approximately 2000 of the smallest US equity securities in the Russell 3000 Index based on a combination of market capitalization and current index membership. The Russell 2000 Index represents approximately 10% of the total market capitalization of the Russell 3000 Index. Because the Russell 2000 serves as a proxy for lower quality, small cap stocks, it provides an appropriate benchmark for RMB Special Situations.
MSCI EAFE Index*: an equity index which captures large and mid-cap representation across 21 of 23 Developed Markets countries around the world, excluding the U.S. and Canada. With 926 constituents, the index covers approximately 85% of the free float-adjusted market capitalization in each country.
The MSCI Emerging Markets Index* measures equity market performance in the global emerging markets universe. It covers over 2,700 securities in 21 markets that are currently classified as EM countries. The MSCI EM Index universe spans large, mid and small cap securities and can be segmented across all styles and sectors.
The U.S. Dollar Index is used to measure the value of the dollar against a basket of six foreign currencies: the euro, Swiss franc, Japanese yen, Canadian dollar, British pound, and Swedish krona.
The Deutsche Bank EM FX Equally Weighted Spot Index, an equal-weighted basket of 21 emerging market currencies.
MSCI U.S. REIT Index is a free float-adjusted market capitalization weighted index that is comprised of equity Real Estate Investment Trusts (REITs). The index is based on the MSCI USA Investable Market Index (IMI), its parent index, which captures the large, mid and small cap segments of the USA market. With 150 constituents, it represents about 99% of the US REIT universe and securities are classified under the Equity REITs Industry (under the Real Estate Sector) according to the Global Industry Classification Standard (GICS®), have core real estate exposure (i.e., only selected Specialized REITs are eligible) and carry REIT tax status.
Disclaimers
Performance Disclosures
All market pricing and performance data from Bloomberg, unless otherwise cited. Asset class and sector performance are gross of fees unless otherwise indicated.
The opinions and analyses expressed in this newsletter are based on Curi RMB Capital, LLC’s (“Curi RMB Capital”) research and professional experience are expressed as of the date of our mailing of this newsletter. Certain information expressed represents an assessment at a specific point in time and is not intended to be a forecast or guarantee of future results, nor is it intended to speak to any future time periods. Curi RMB Capital makes no warranty or representation, express or implied, nor does Curi RMB Capital accept any liability, with respect to the information and data set forth herein, and Curi RMB Capital specifically disclaims any duty to update any of the information and data contained in this newsletter. The information and data in this newsletter does not constitute legal, tax, accounting, investment or other professional advice. Returns are presented net of fees. An investment cannot be made directly in an index. The index data assumes reinvestment of all income and does not bear fees, taxes, or transaction costs. The investment strategy and types of securities held by the comparison index may be substantially different from the investment strategy and types of securities held by your account. RMB Asset Management is a division of Curi RMB Capital.