


Key Takeaways
- Equity market returns were robust in February. U.S. small cap stocks led the rally, up 5.7%, and the S&P 500 reached new highs, marking a rare occurrence of gains in 16 of the past 18 weeks—something not achieved in more than 50 years.
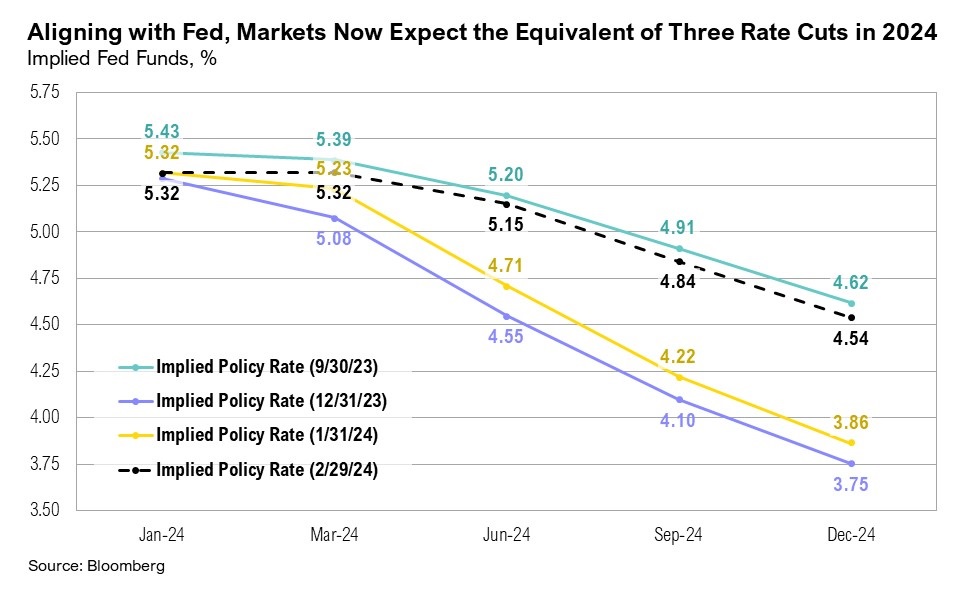
- The January CPI report indicated higher-than-expected inflation. Coupled with strong economic data, this has prompted investors to scale back expectations for Federal Reserve rate cuts in 2024.
- While the U.S. economy continues to show resilience, the United Kingdom and Japan recently slipped into technical recessions, adding complexity to the global economic landscape.
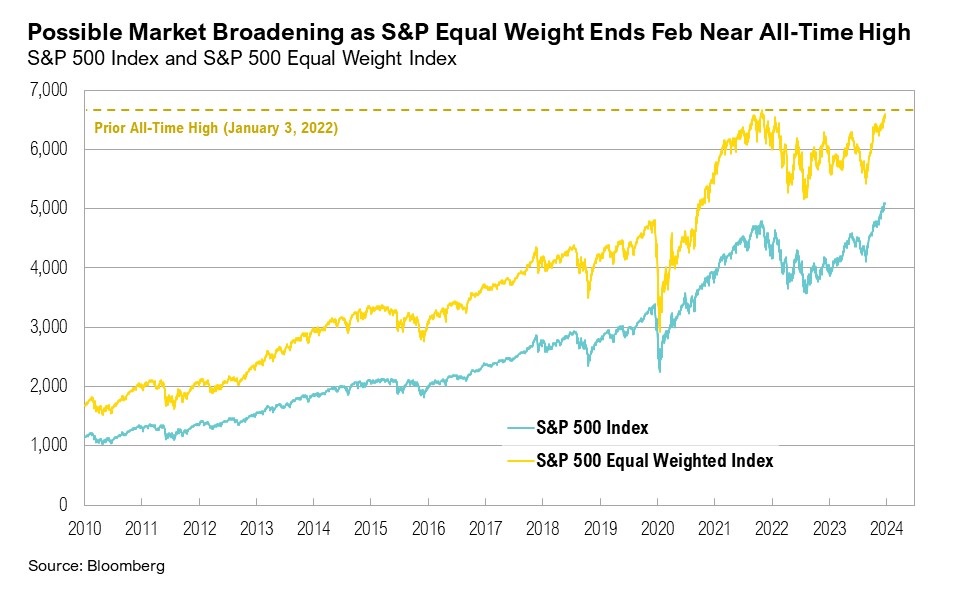
- Despite the recent equity rally, its narrow scope raises crucial questions. Investors are keenly watching to see if the rally will broaden out further and whether the current blend of earnings and monetary policy can sustain elevated market valuations.
Overview
Equity markets ended February on a strong note. U.S. small cap stocks marginally bested their larger peers, ending the month up 5.7%. The S&P 500 continued to reach new highs throughout the month, as U.S. large cap stocks gained 5.3%. As of the last week in February, the S&P 500 Index had been up in 16 of the past 18 weeks—something that hasn’t occurred in more than 50 years.1 In contrast to strong equity markets, U.S. intermediate-term bonds continued to struggle, with the Bloomberg U.S. Aggregate Bond Index ending the month down 1.4%.
The January CPI report came in above expectations, and headline inflation eased to 3.1% year-over-year, down from 3.4% in December, but higher than the expected 2.9%. Core inflation remained unchanged year-over-year, at 3.9%.2 Producer prices also rose more than expected in January, increasing by 0.3% month-over-month, compared to the anticipated 0.1%.3 Strong economic data over the past month suggests that inflation may linger at current levels for longer than initially expected. The labor market remained extremely tight, and the unemployment rate stayed near its four-decade low of 3.4%, marginally ticking up to 3.9% in February.4 In response, Fed officials' communications throughout February consistently emphasized that rate cuts would be considered only with clear evidence that inflation is moving towards the 2% target.5,6,7 Interestingly, market expectations for interest rate cuts declined throughout February and ended the month in line with the Fed’s expected three cuts for the year. This is a notable decline from the six cuts expected at the end of January, the result of strong economic data and stickier inflation, which pushed out hopes for imminent rate cuts.
Navigating the Bull

Investor sentiment remained above average for 16 consecutive weeks, in line with the ongoing rise of the S&P 500.8 With more than 80% of S&P 500 companies having reported earnings by the end of February, the fourth quarter 2023 earnings season is nearly wrapped up. Fourth quarter earnings growth estimates have increased to 4.0% year-over-year, up from an initial 1.5% expected at the end of 2023, due mostly to gains in the communication services and consumer discretionary sectors.9 Looking forward, expectations for first quarter 2024 earnings growth have been revised lower, falling to 3.6% from an earlier projection of 5.8% at the start of the year.9 Despite the S&P 500 continuing to reach new highs throughout February, bottom-up earnings estimates for 2024 remained largely unchanged.9
Although earnings estimates have stayed relatively stagnant, the performance of several bellwether companies highlighted the continued resilience of the U.S. consumer. At Walmart, U.S. same-store sales increased by 4% year-over-year in the fourth quarter, as consumers, though more selective, “have been shopping frequently,” according to CEO John Rainey during the company’s earnings call.10 Further, Marriott, Royal Caribbean, and other travel-related companies noted that demand for travel remained elevated into 2024.11,12 A recent study by the San Francisco Federal Reserve found that the overall level of real household wealth in the U.S. remained above pre-pandemic levels, despite the drawdown in excess savings, which may suggest the potential for ongoing strength in spending, at least in the near future.13
Some speculate that an AI-driven “bubble” might be forming, largely due to the stellar performance of a handful of mega-cap technology companies.14,15,16 Despite clear signs of excitement (and, arguably, frenzy) surrounding the new technology, the current rally may be built on more solid underpinnings than the tech bubble of the early 2000s. For instance, several high-flying companies may ultimately merit their otherwise stretched valuations if they can continue to deliver the same level of strong earnings growth that they have had in recent quarters. Despite ending February up more than 65% year-to-date and adding $275 billion in market cap and 16% to its share price after announcing earnings, Nvidia’s price-to-earnings (P/E) ratio declined from over 200 times trailing earnings last summer to around 75 in February.17 If we use earnings estimates for 2024, Nvidia trades at a P/E of around 35 times. Similarly, Amazon and Meta are not cheap stocks with trailing P/E ratios of about 60 and 33, respectively, but these multiples are among their lower valuations of the last several years as they have consistently delivered good growth.18,19 Investors have also been more discerning with their rewards: Tesla is down nearly 20% year-to-date, and Apple and Google are down 3% and 1% year-to-date, respectively, due to poorer-than-expected earnings announcements.20,21,22 Finally, the narrow leadership that historically has been a hallmark of top-heavy markets may be beginning to broaden out. The equal-weighted S&P 500 rose 3.0% over February, ending the month only 0.1% below its all-time high. Small caps rallied in the last week of February, climbing 3% to produce a solid 5.7% for the month.
However, it may not all be smooth sailing. Even though more of the market is enjoying strong returns, the breadth of this rally remains a concern. Only four names (Nvidia, Microsoft, Meta, and Amazon) have driven more than 50% of the S&P 500’s 7.1% gains for the year. In U.S. small cap stocks, one company (Supermicro Computer; a U.S. information technology company) was responsible for nearly all of the Russell 2000’s year-to-date gains of 1.5%. Supermicro Computer ended February up more than 200% year-to-date. Further, the timing and magnitude of interest rate cuts remain uncertain. Federal Open Market Committee (FOMC) meeting minutes show that while the Fed still expects to cut interest rates in 2024, committee members are wary of cutting too soon.23 Three cuts have already been priced out for this year, and higher interest rates continue to affect several key areas of the market. Mortgage rates ended February back above 7% for the first time since December, and average credit card interest rates remain elevated, at 21.5%.24 Rising oil prices have led to higher average gasoline prices across the U.S., with the national average for regular gasoline rising by 7% over the past month.24
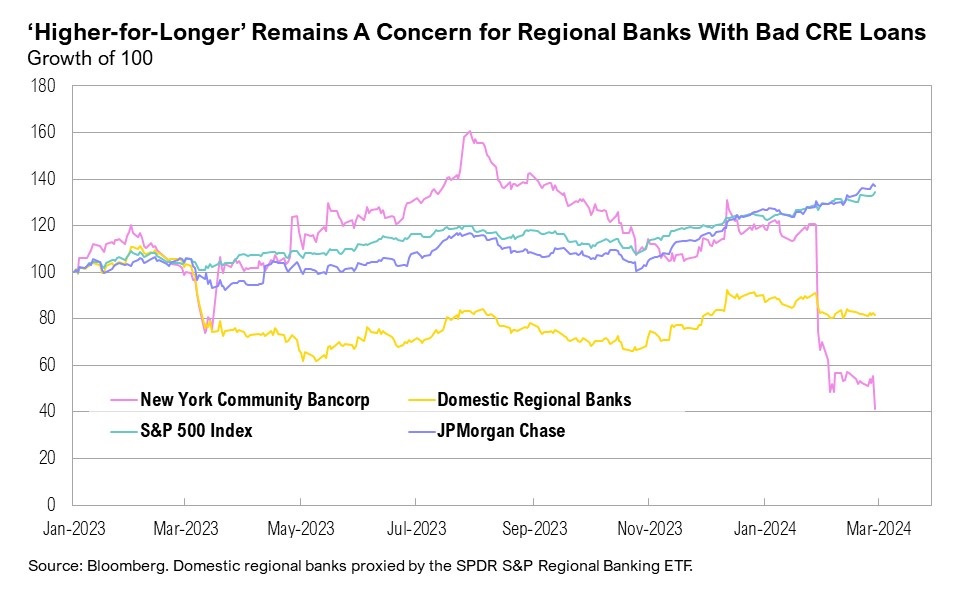
Commercial loan delinquency rates are also worrying. Commercial real estate coverage ratios (or loss reserves to delinquent loans) declined to the lowest levels in more than seven years as the value of delinquent loans has more than doubled over the past year, from $11.2 billion to $24.3 billion.25 Banks may lose as much as $60 billion on bad commercial real estate loans in the next five years, almost double the $31 billion currently held in loan loss reserves.26 For instance, New York Community Bank (NYCB) is down more than 70% this year and just received a one-billion-dollar cash infusion. The bank announced in late January that it was anticipating significantly higher loan losses due in part to its exposure to commercial real estate.27 The story worsened at the end of February when the company disclosed weaknesses in its internal controls and a tenfold increase in its fourth-quarter loss, hitting $2.7 billion.27 Before its precipitous fall, NYCB was a top-ten position in the SPDR S&P Regional Banking ETF (KRE) and had a market cap of $7.5 billion. NYCB now has a market cap of $2.5 billion.
Further, more than $480 billion has been added to total government debt since the start of 2024, compared to the $108 billion in the first two months of 2023. In early February, the Congressional Budget Office projected that the U.S. budget deficit would likely rise from $1.6 trillion to $2.6 trillion over the next decade.28 Unrestrained government spending is counteracting the Fed’s efforts to tighten monetary policy, which may force the Fed to keep interest rates higher for longer.
The challenge investors face while navigating this bull market was perhaps best captured by JP Morgan Chase CEO Jamie Dimon, speaking at a conference in Miami at the end of the month:
“Confidence is up. There’s more M&A chatter. [The] equity market’s open a little bit. Spreads are getting close to historical lows, which means there’s a lot of money chasing a high-yield deal. Markets are high and people feel it. So far, so good. [But] the way I look at it, remember in 1972, you felt great too, and before any crash, you felt great, and then some things changed. I do think there are things out there which are concerning; we’ve got to keep an eye on them.”29
Markets
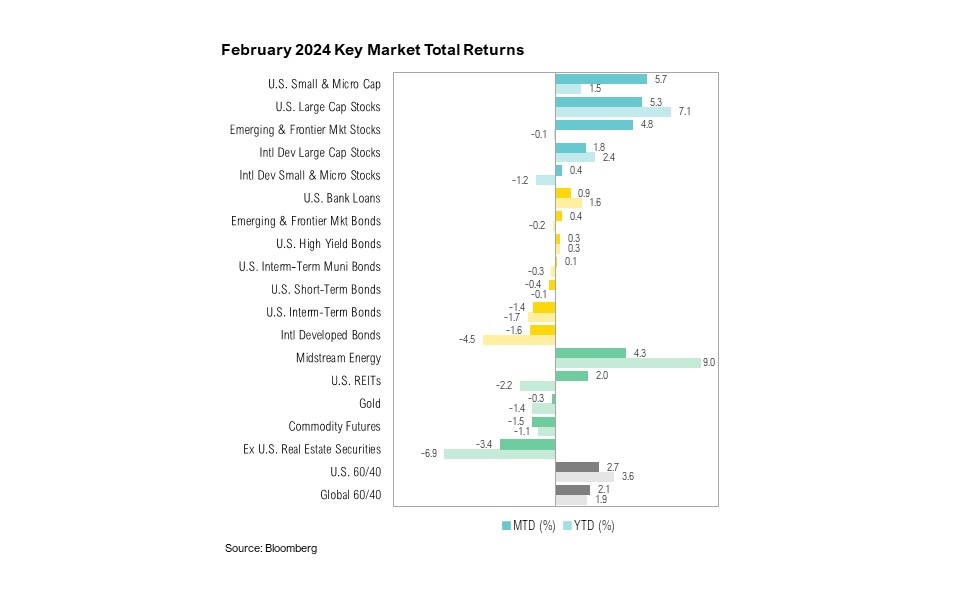
Returns were mixed across asset classes in February. As discussed above, U.S. small cap stocks marginally outperformed U.S. large cap stocks. The former rose 5.7%, and the latter gained 5.3% over the month. Emerging and frontier market stocks also had a good month, ending February up 4.8%. U.S. intermediate-term bonds ended the month down 1.4%, while the 10-year Treasury yield ended the month up 40 basis points, rising to 4.25%. Gold remained above $2,000 per ounce throughout February, yet ended the month roughly flat, down 0.3%. West Texas Intermediate (WTI) crude oil rose by 6% over February, closing the month at $78.3 per barrel, its highest price since November 2023. Midstream energy ended the month up 4.3%. After climbing by 42% over the month, bitcoin ended February only 7% away from its all-time high.
Looking Forward
Inflation and policy dynamics are becoming increasingly intricate. Stickier inflation challenges the economic outlook by potentially leading to fewer rate cuts, higher bond yields, lower equity multiples, and subdued real growth. It also places further stress on regional banks, who have come under scrutiny as commercial real estate loan portfolios struggle under the higher interest rate environment. Further, while the Fed may be forced to keep rates high for longer, rampant fiscal spending is more than counteracting their attempts to rein in inflation.
Fiscal spending appears to be on an unsustainable trend. The reality of continued elevated Treasury issuance and the resulting increase in net interest outlays suggests a looming challenge for bond markets and underscores the risks of a “higher-for-longer” interest rate environment. As policymakers grapple with the dual objectives of managing national liabilities and sustaining government spending, the importance of diversifying investment portfolios becomes ever more important.
On the equities front, persistently high valuations since 2016 raise questions about the future of equity returns. If the valuation trends of the last decade represent a new norm, investors might expect forward returns near, albeit slightly below, long-term averages. However, if historical averages over the last century are more indicative of what normal is, equity returns could be considerably lower. While equity valuations are a key concern, we find ourselves more focused on fixed income and credit markets for signs that either the economy is slowing in earnest or bond investors are no longer willing to fund uncontrolled government spending at current interest rates.
We continue to believe that there will be volatility in equity and fixed income markets in the coming year. The Federal Reserve remains focused on their dual mandate of ensuring lower levels of inflation while also targeting full employment. Investors are focused on when the Fed will begin cutting rates and with inflation remaining sticky, expectations for the first cut have been pushed to early summer. We continue to pay special attention to trends in earnings, as we feel earnings will be a key driver of equity returns for this year. The upcoming U.S. election and its potential effects on future fiscal policy will also be a key focus for markets in the coming months as the campaigning picks up steam.
We continue to favor both high-quality stocks and bonds, rather than being overly aggressive with opportunities in lower quality assets. Short-term bonds remain attractive, but investors should be prepared for changes to the yield curve over the next 12 months. We believe that a high-quality diversified asset allocation remains the best approach to navigate uncertainty in the coming year. During uncertain times, the key to successful investing is often remaining committed to long-term investment plans.
Citations
1. Barron’s: https://www.barrons.com/articles/s-p-500-index-record-high-cb2af6fe
2. BLS: https://www.bls.gov/cpi/
3. BLS: https://www.bls.gov/ppi/
4. BLS: https://www.bls.gov/cps/
5. Federal Reserve: https://www.federalreserve.gov/newsevents/speech/waller20240222a.htm
6. Federal Reserve: https://www.federalreserve.gov/newsevents/speech/jefferson20240222a.htm
7. Bloomberg: https://www.bloomberg.com/news/articles/2024-02-06/mester-says-fed-should-gain-confidence-to-cut-later-this-year
8. AAII: https://www.aaii.com/sentimentsurvey
9. FactSet: https://advantage.factset.com/hubfs/Website/Resources%20Section/Research%20Desk/Earnings%20Insight/EarningsInsight_030124.pdf
10. Bloomberg: https://www.bloomberg.com/news/articles/2024-02-20/walmart-wmt-offers-muted-earnings-guidance-seeing-consumer-caution
11. Marriott: https://news.marriott.com/news/2024/02/13/marriott-international-reports-strong-fourth-quarter-and-full-year-2023-results
12. Yahoo Finance: https://finance.yahoo.com/news/royal-caribbean-group-reports-strong-175736529.html
13. Federal Reserve Bank of San Francisco: https://www.frbsf.org/research-and-insights/publications/economic-letter/2024/02/rise-and-fall-pandemic-excess-wealth/
14. Wall Street Journal: https://www.wsj.com/finance/stocks/nvidia-stock-price-bubble-worries-73d7b8d1
15. Wall Street Journal: https://www.wsj.com/finance/stocks/is-there-an-ai-bubble-the-nifty-fifty-show-it-isnt-that-simple-11a0f07a
16. Fortune: https://fortune.com/2024/02/28/is-there-ai-stock-bubble-lessons-from-dot-com-crash-stock-valuations/
17. YCharts: https://ycharts.com/companies/NVDA/pe_ratio
18. YCharts: https://ycharts.com/companies/AMZN/pe_ratio
19. YCharts: https://ycharts.com/companies/META/pe_ratio
20. Barron’s: https://www.barrons.com/livecoverage/tesla-q4-earnings-report-stock-price
21. CNBC: https://www.cnbc.com/2024/01/30/alphabet-googl-q4-earnings-report-2023.html
22. CNBC: https://www.cnbc.com/2024/02/01/apple-aapl-earnings-report-q1-2024.html
23. Federal Reserve: https://www.federalreserve.gov/monetarypolicy/files/fomcminutes20240131.pdf
24. FRED: https://fred.stlouisfed.org/series/TERMCBCCALLNS
25. AAA: https://gasprices.aaa.com/
26. Financial Times: https://www.ft.com/content/4114454c-a924-4929-85f4-5360b2b871c6
27. New York Times: https://www.nytimes.com/2024/03/01/business/new-york-community-bank.html
28. Financial Times: https://www.ft.com/content/b6693fee-cd97-4ea9-895d-036aae6eefaf
29. CNBC: https://www.cnbc.com/2024/02/26/jamie-dimon-is-cautious-about-everything-as-he-sees-risks-to-a-soft-landing.html
Index Definitions
The S&P 500 Index is widely regarded as the best single gauge of the United States equity market. It includes 500 leading companies in leading industries of the U.S. economy. The S&P 500 focuses on the large cap segment of the market and covers approximately 75% of U.S. equities.
The Bloomberg Barclays U.S. Aggregate Index represents securities that are SEC-registered, taxable, and dollar denominated. The index covers the U.S. investment grade fixed rate bond market, with index components for government and corporate securities, mortgage pass-through securities, and asset-backed securities. Duration is roughly 5 years.
The Bloomberg U.S. Corporate High Yield Bond Index measures the USD-denominated, high yield, fixed-rate corporate bond market. Securities are classified as high yield if the middle rating of Moody’s, Fitch and S&P is Ba1/BB+/BB+ or below. Bonds from issuers with an emerging markets country of risk, based on the indices’ EM country definition, are excluded.
The Russell 1000® Value Index measures the performance of the large-cap value segment of the U.S. equity universe. It includes those Russell 1000 companies with lower price-to-book ratios and lower expected and historical growth rates.
The Russell 1000® Growth Index measures the performance of the large- cap growth segment of the US equity universe. It includes those Russell 1000 companies with relatively higher price-to-book ratios, higher I/B/E/S forecast medium term (2 year) growth and higher sales per share historical growth (5 years).
The Russell 2000® Index measures the performance of the small-cap segment of the US equity universe. It includes approximately 2000 of the smallest US equity securities in the Russell 3000 Index based on a combination of market capitalization and current index membership. The Russell 2000 Index represents approximately 10% of the total market capitalization of the Russell 3000 Index. Because the Russell 2000 serves as a proxy for lower quality, small cap stocks, it provides an appropriate benchmark for RMB Special Situations.
MSCI EAFE Index*: an equity index which captures large and mid-cap representation across 21 of 23 Developed Markets countries around the world, excluding the U.S. and Canada. With 926 constituents, the index covers approximately 85% of the free float-adjusted market capitalization in each country.
The MSCI Emerging Markets Index* measures equity market performance in the global emerging markets universe. It covers over 2,700 securities in 21 markets that are currently classified as EM countries. The MSCI EM Index universe spans large, mid and small cap securities and can be segmented across all styles and sectors.
The U.S. Dollar Index is used to measure the value of the dollar against a basket of six foreign currencies: the euro, Swiss franc, Japanese yen, Canadian dollar, British pound, and Swedish krona.
The Deutsche Bank EM FX Equally Weighted Spot Index, an equal-weighted basket of 21 emerging market currencies.
MSCI U.S. REIT Index is a free float-adjusted market capitalization weighted index that is comprised of equity Real Estate Investment Trusts (REITs). The index is based on the MSCI USA Investable Market Index (IMI), its parent index, which captures the large, mid and small cap segments of the USA market. With 150 constituents, it represents about 99% of the US REIT universe and securities are classified under the Equity REITs Industry (under the Real Estate Sector) according to the Global Industry Classification Standard (GICS®), have core real estate exposure (i.e., only selected Specialized REITs are eligible) and carry REIT tax status.
*Source: MSCI.MSCI makes no express or implied warranties or representations and shall have no liability whatsoever with respect to any MSCI data contained herein. The MSCI data may not be further redistributed or used as a basis for other indexes or any securities or financial products. This report is not approved, endorsed, reviewed or produced by MSCI. None of the MSCI data is intended to constitute investment advice or a recommendation to make (or refrain from making) any kind of investment decision and may not be relied on as such.
Performance Disclosures
All market pricing and performance data from Bloomberg, unless otherwise cited. Asset class and sector performance are gross of fees unless otherwise indicated.
The opinions and analyses expressed in this newsletter are based on Curi RMB Capital, LLC’s (“Curi RMB”) research and professional experience are expressed as of the date of our mailing of this newsletter. Certain information expressed represents an assessment at a specific point in time and is not intended to be a forecast or guarantee of future results, nor is it intended to speak to any future time periods. Curi RMB makes no warranty or representation, express or implied, nor does Curi RMB accept any liability, with respect to the information and data set forth herein, and Curi RMB specifically disclaims any duty to update any of the information and data contained in this newsletter. The information and data in this newsletter does not constitute legal, tax, accounting, investment or other professional advice. Returns are presented net of fees. An investment cannot be made directly in an index. The index data assumes reinvestment of all income and does not bear fees, taxes, or transaction costs. The investment strategy and types of securities held by the comparison index may be substantially different from the investment strategy and types of securities held by your account. RMB Asset Management is a division of Curi RMB Capital.