


Key Takeaways
- Markets continued their hot streak in July, and the S&P 500 posted its fifth consecutive month of positive returns, ending the month up 3.2%.
- With more than 85% of S&P 500 companies having already reported, Q2 2023 will likely be the third consecutive quarter of corporate earnings contraction.
- The day after Treasury issued its substantially higher borrowing estimates for Q3, ratings agency Fitch downgraded the U.S. from AAA to AA+, citing concerns of fiscal governance and a growing government debt burden.
- Poor fiscal dynamics are unlikely to abate any time soon as many of the factors driving higher deficits appear to be structural.
Overview
The markets continued their hot streak in July. Historically, July has been one of the top-performing months for U.S. large cap stocks, and this year proved no different. Over the past 100 years, U.S. large cap stocks have posted an average return of 1.98% in July, compared to the average 0.96% for the other eleven months of the year. The S&P 500 ended July up 3.2%.
With over 85% of S&P 500 companies having already reported, Q2 2023 will likely be the third consecutive quarter of corporate earnings contraction. S&P 500 earnings estimates for 2023 and 2024 are down 4.7% and 2.5%, respectively, since the start of the year.1 Furthermore, despite nearly 80% of companies reporting a positive earnings-per-share surprise (well above the 10-year average of 73%) and 65% of companies reporting a positive revenue surprise (also above the 10-year average of 63%), investors reacted more negatively to positive surprises than they have since 2011.1 The share prices of companies that reported positive earnings declined on average about 0.5% in the two days before and two days after announcing their earnings—well below the 1% price increase that is the historical average for the same window.1
Market reactions to earnings calls have also varied and have seemed primarily focused on guidance about the future. Despite beating estimates, Apple’s share price dropped by 4% after it announced earnings. The company’s sales declined in Q2, and management yet again provided no guidance. In fact, Apple hasn’t provided guidance since Q1 2020, repeatedly citing uncertainty.2 Apple lost $130 billion in market cap in the 48 hours after announcing earnings—a value equivalent to the market cap of IBM.4 Amazon, which also beat estimates, saw its share price jump by a scorching 7.5% after management announced solid earnings and provided upbeat guidance.3
In contrast to the heat of the markets, inflation stayed cooler. July’s 3.2% year-over-year reading was a slight uptick from 3.0% in June. Core inflation, which excludes the volatile food and energy components, dropped below 5.0% in June for the first time since November 2021 and ticked lower to 4.7% year-over-year in July (from 4.8% in June).5 Despite signs that overall inflation is easing meaningfully, base effects will likely become more challenging in the months ahead as the worst of the monthly inflation readings from 2022 fall out of the 12-month reference period. The labor market remains resilient. The U.S. economy added 187,000 new jobs in July, and the unemployment rate continues to hover near fifty-year lows, at 3.5%.6
But is warming inflation on the horizon? The 5-year, 5-year forward inflation expectation rate (an estimate of inflation expectations for the five years that start five years from the present) rose to 2.47% on July 31—the highest level since August 2014.7
The Federal Reserve hiked interest rates by 25 basis points at the July 26 FOMC meeting. The FOMC is now on “summer break” and will not meet again until September 19, allowing Fed officials to assess the delayed impacts of increased interest rates.8 Before the September FOMC meeting, two more reports on CPI and employment will be available, which will further inform their rate decisions. Several Fed officials have made it clear that they support at least one more rate hike this year. As Fed Governor Christopher Waller put it ahead of the July meeting:
“I see two more 25-basis-point hikes in the target range over the four remaining meetings this year as necessary to keep inflation moving toward our target… From there, I will need to see how the data come in.”9
On July 31, Treasury announced a sweltering third-quarter borrowing estimate of $1 trillion (up from a previous estimate of $733 billion). The jump in borrowing estimates is attributed to lower revenues and increased outlays. In its Fiscal Year 2023 Q3 Report, Treasury highlighted some challenges. Tax receipts in the April to May 2023 period were 40% lower than last year’s record level, declining by $282 billion.10 This is partly due to deferred tax payments from California because of storms and flooding earlier this year. California accounts for nearly 15% of all U.S. personal taxes paid and an even larger share of corporate taxes.11 Decreased tax receipts also appear to be driven by the employee retention credit (ERC), a refundable tax credit designed to provide relief for businesses and employees affected by the pandemic. Thus far, nearly $400 billion in business tax refunds (mainly in the form of ERC) have been given back to business owners since January 2022, which has significantly boosted consumer spending.12 Businesses have until April 2025 to claim ERC for 2020 and 2021.13
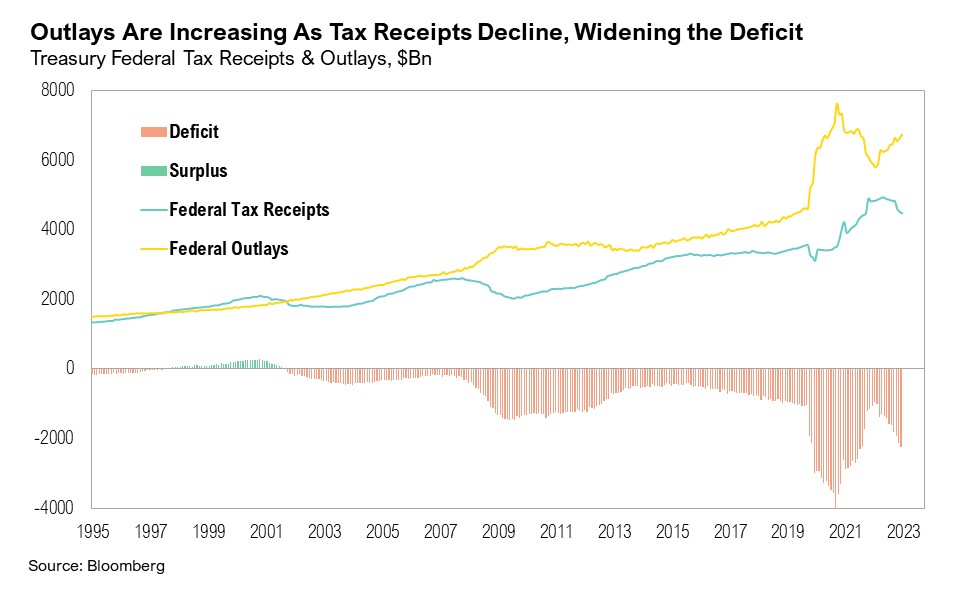
Furthermore, this year’s 8.7% Social Security cost-of-living adjustment (compared to 5.7% in 2022), combined with an increasing number of Social Security beneficiaries and higher Medicare costs, together accounted for $181 billion in additional spending this year.10 Interest on public debt is 25% higher, or $131 billion, more than a year ago due to higher interest rates. The banking sector crisis and the collapse of five U.S. banks earlier this year increased FDIC outlays by $52 billion.10 Excluding the $4 trillion borrowed in 2020 for the pandemic response, 2023’s expected $2.7 trillion issuance will set a record. On 1 August, the day after Treasury issued its substantially higher borrowing estimates for Q3, ratings agency Fitch downgraded the U.S. from AAA to AA+, citing concerns of fiscal governance and a growing government debt burden.14 While reactions from government officials and industry experts ranged from dismissive to defensive to outright negative, the Fitch downgrade sheds light on the U.S. government’s staggering national debt burden, which has long-term implications for economic growth.
Under President Biden, major programs such as the American Families Plan (2021), the Inflation Reduction Act (IRA) and the CHIPS and Science Act of 2022 have been rolled out, with proposed collective outlays of over $1 trillion, $400 billion, and $300 billion, respectively.15,16 However, those numbers may understate the final cost of these programs, which hints at Fitch’s fiscal governance concerns. For instance, according to the Penn Wharton Budget Model, due to the way instructions were written, the cost of the IRA is running three times greater than the amount appropriated by Congress.17

Hot Streak
U.S. large cap stocks continued to bask in the sunshine throughout July, and the Magnificent Seven gained a respectable 3.6%, outperforming the S&P 500 again. Despite the gains, investors greeted the companies’ earnings reports with mixed emotions. This year’s “Summer Slowdown”—a seasonal phenomenon where the stock market tends to exhibit lower trading volumes and price volatility during the summer months—was reflected in the CBOE Volatility Index (or VIX), which measures market expectations for volatility, reaching some of its lowest levels since the pandemic. Over the past five years, the VIX has averaged around 21.5, whereas its average in July was 13.9 (the lowest-ever VIX reading was 9.5, on September 29, 2017).
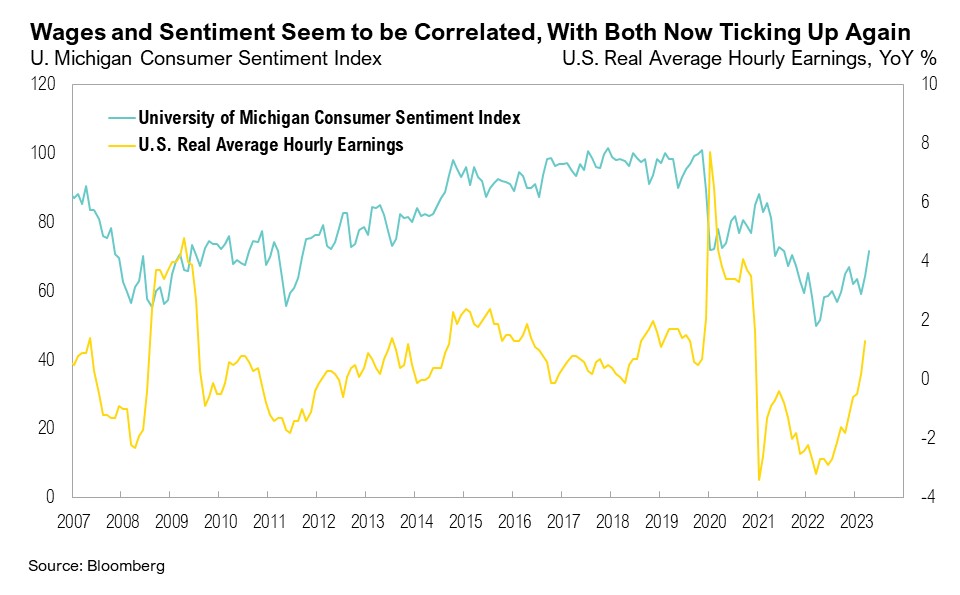
After 24 consecutive months of negative growth, real wages also turned positive for the first time in June, as wages outpaced inflation for the first time since 2021.18 Recently, wages and consumer sentiment have been strongly correlated. Real wage growth turned negative in March 2021, and consumer sentiment (as measured by the University of Michigan Consumer Sentiment Index) started to decline in April 2021. Both real wage growth and sentiment bottomed out in June 2022 and have both been steadily ticking up since then. The University of Michigan Consumer Sentiment Index printed at 71.6 in July, the highest since October 2021, as consumers were buoyed by lower inflation, a resilient labor market and higher stock prices.19
Globally, July was the hottest month on record.20 Pumping air conditioners across the U.S. sent demand for gas skyrocketing, and natural gas powerplants in the U.S. recorded all-time high levels of demand. On July 27, a record-breaking 52 billion cubic feet of natural gas was used.21 Other commodities were also on a hot streak in July. West Texas Intermediate crude oil prices ended July back above $81 per barrel for the first time since April, rallying by more than 20% since the end of June. Gasoline prices also surged in the last ten days of July, rallying by 6.3% and pushing national average prices to the highest levels since November 2022. Already-low refinery capacity, driven even lower by heatwaves, combined with announcements of output cuts by OPEC, led to the rally in oil prices.22
Casting Shade
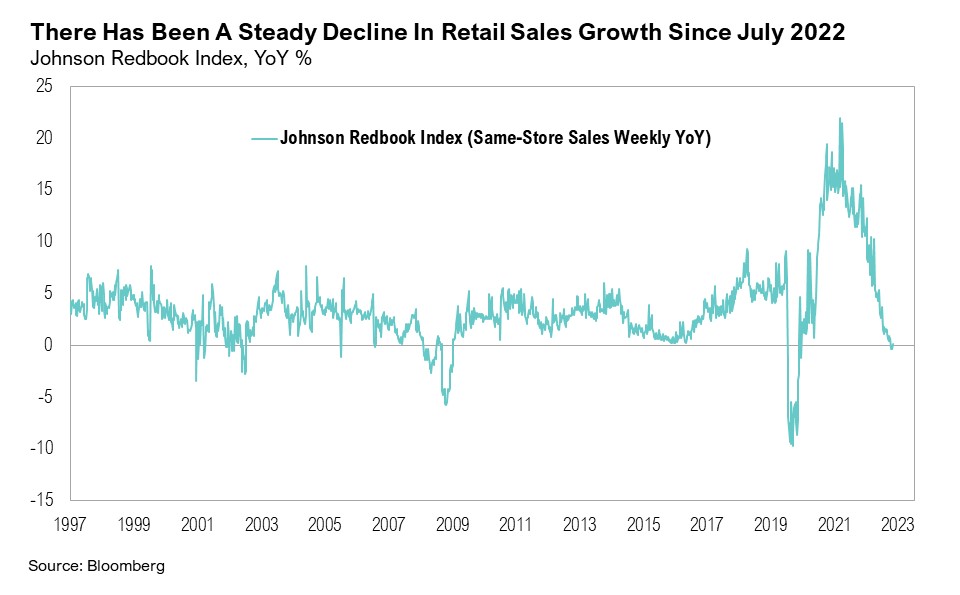
While headline data suggests the sun is still shining for many, it is evident that consumers are starting to feel the burn from higher rates. Consumer spending was a top contributor to Q2 2023 GDP growth, generating nearly half of the 2.4% quarter-over-quarter growth.23 The personal savings rate (as a percentage of disposable personal income) ticked down to 4.3% in June, from 4.6% the month prior, and it remains well below the historical average of 8.9%, as measured since 1952.24 The Johnson Redbook Index, a weekly measure of retail sales growth year-over-year, has been steadily declining since December 2021.25 It recorded three consecutive negative weekly readings throughout July. Apart from the pandemic in 2020 and the Global Financial Crisis, this is the first time that the Johnson Redbook Index has recorded a negative reading since 2006. However, consumer spending appears to have made a strong start to the third quarter with month over month US retail sales reported for July rising more than forecasts. It’s too soon to conclude that spending growth is reaccelerating but July was a positive start.
Revolving consumer credit (credit card debt) balances have surpassed $1 trillion for the first time ever, reflecting ongoing consumer spending alongside elevated inflation.26 Total outstanding consumer credit expanded by $17.8 billion in June, hitting $4.9 trillion.27 Non-revolving consumer credit (such as personal loans and vehicle loans), which had been slowing over the past few months, rebounded sharply from 0.3% in May to 6% in June—its highest since October 2022.27
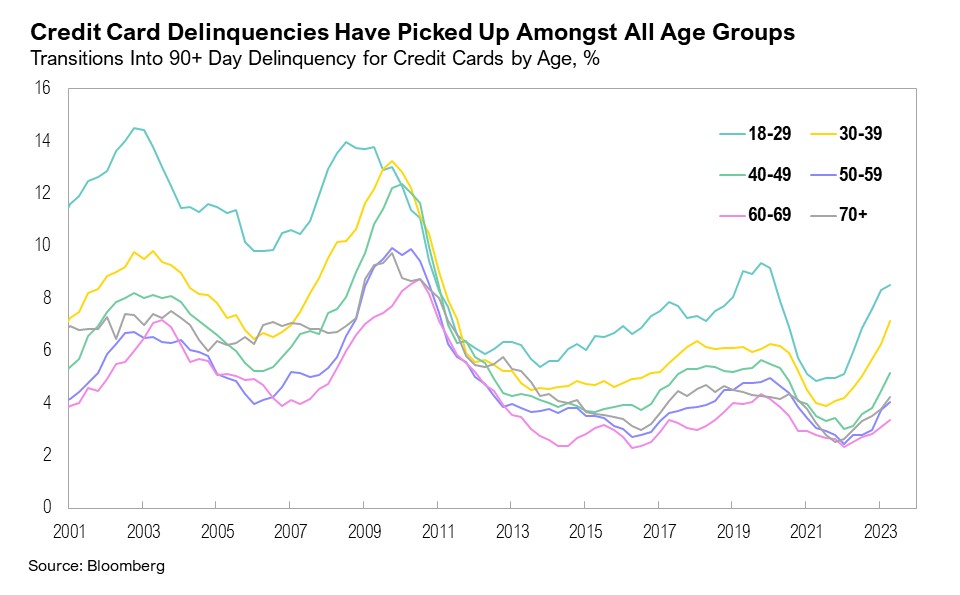
Credit card delinquencies have started to increase amongst all age groups, but most prominently among consumers between ages 18 to 40—the largest age cohort, consisting of more than 89 million of the 332 million people in the U.S. population.28 Credit card delinquencies for 90+ days have ticked up to 8.5% for those between the ages of 18 to 29 and 7.1% for those aged 30 to 39.26 For those aged 30 to 39, this is the highest level since 2011. The rapid increase in delinquencies is unsurprising, given that the average interest rate on consumer credit cards ranges between record-high levels of 20.9% and 24.7%.29,30 The 18-to-40-year age group also has the largest outstanding student loan debt.31 Rising credit card balances and high interest rates may start to place pressure on consumers, as the resumption of student loan payments in the coming months may place additional financial strain on those already feeling the heat.
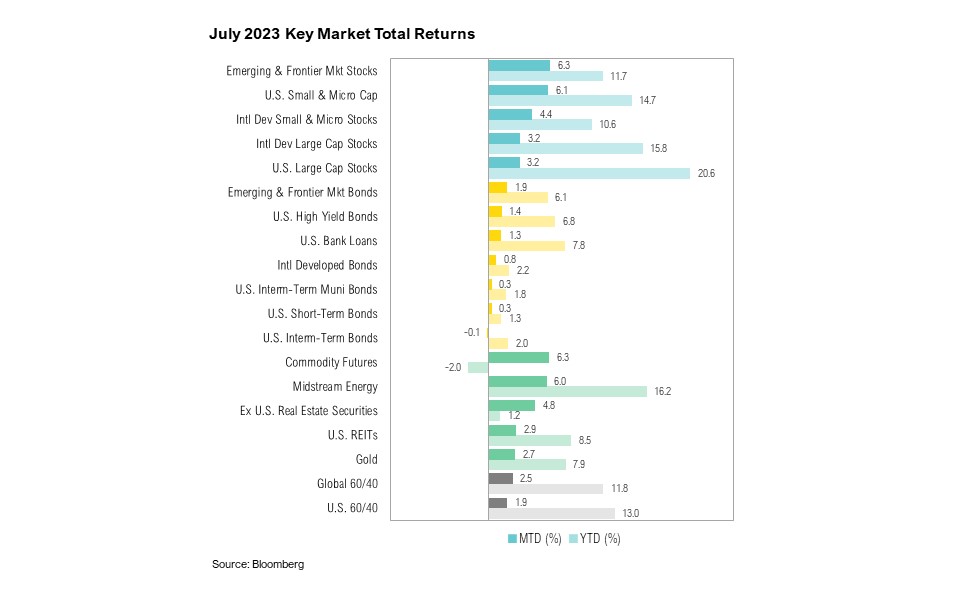
Markets
July was another strong month in the markets, and only one asset class ended the month with marginally negative returns. U.S. small cap stocks ended the month up 6.1%, outpacing U.S. large cap stocks, which gained 3.2%. Equity markets elsewhere in the world also had a good month. The MSCI EAFE ended July up 3.2%, while emerging and frontier market stocks gained 6.3%. Fixed income had a muted, yet still largely positive, month. U.S. high yield bonds gained 1.4% throughout the month, while the Bloomberg U.S. Aggregate Bond Index, the only asset class with a negative return in July, ended the month down a marginal 0.1%.
Like dipping a toe into a swimming pool, the Bank of Japan seems to be testing the water by introducing more flexibility into its monetary policy. On July 27, the BoJ announced a tweak in its yield curve control policy to allow interest rates to move more freely, regarding the prior 0.5% cap on 10-year Japanese government bonds now as “the range of references, not as rigid limits” in market operations.32 At 4.2%, core inflation in Japan remains near forty-year highs. Inflation in the United Kingdom unexpectedly dipped lower to 7.9% in June, from 8.7% year-over-year in May. The Bank of England has hiked rates to 5.25% but expects inflation will not return to its 2.0% target until Q2 2025.33 China has officially slipped into deflationary territory for the first time in two years, driven by weak domestic demand and rising economic and geopolitical concerns.34 Youth unemployment in China has reached a record-level high of 21.3%.34
Apart from Japan, earnings growth across major global markets seems to be shrouded in shade at least for Q2. Globally, headline aggregate earnings growth for Q2 is 8.8% lower compared to a year ago. Earnings growth is down more than 14% for both emerging markets and Europe, and in the U.S. aggregate earnings fell 4.5% year-over-year in Q2. Japan is the lone positive standout. Its headline earnings growth was 10.9% higher than a year ago.35
Looking Forward
Although higher government debt levels could significantly hinder long-term economic growth, the short-term impact on economic growth is positive. For the U.S., poor fiscal dynamics are unlikely to abate any time soon since many of the factors driving higher deficits appear structural. So, although the summer’s hot weather streak will undoubtedly cool, the streak of record or near-record Treasury issuance may not. This will carry with it both opportunities and risks that span shorter and longer-term time periods.
Even with these major concerns, the investment implications stemming from headline-grabbing situations like a U.S. credit downgrade are often paradoxical as all the bad news may be fully accounted for in existing bond prices (and inversely, their yields). As such, we may be nearing a point where bonds could outperform other asset classes. Either way, we think it is a mistake to believe this is the start of an endless summer for the economy, and we expect more bumps in the road ahead.
At RMB, we believe there will be continued volatility in both equity and fixed income markets, as the Federal Reserve continues to focus on mitigating above average inflation as the U.S. economy and markets grapple with mixed economic data. We advise caution as both bull and bear market scenarios are possible from this point. Stocks might continue to shrug off higher rates for several more quarters and emerge even higher one year from now. However, we can also see a situation in which stocks head lower given recent market strength, growing optimism, and rising real interest rates. Our goal is to be prepared for either outcome. During volatile times, we believe the key to successful investing is remaining committed to long-term investment plans.
- FactSet: https://insight.factset.com/sp-500-earnings-season-update-august-4-2023
- Yahoo Finance: https://finance.yahoo.com/news/apple-inc-nasdaq-aapl-q2-160746928.html
- Fortune: https://fortune.com/2023/08/04/apple-below-3-trillion-market-cap-earnings-declining-sales/
- Amazon: https://s2.q4cdn.com/299287126/files/doc_financials/2023/q2/Q2-2023-Amazon-Earnings-Release.pdf
- BLS: https://www.bls.gov/cpi/
- BLS: https://www.bls.gov/charts/employment-situation/civilian-unemployment-rate.htm
- FRED: https://fred.stlouisfed.org/series/T5YIFR
- Federal Reserve: https://www.federalreserve.gov/monetarypolicy/fomccalendars.htm
- Federal Reserve: https://www.federalreserve.gov/newsevents/speech/waller20230713a.htm
- Treasury: https://home.treasury.gov/system/files/221/TreasuryPresentationToTBACQ32023.pdf
- McClellan Financial Publications: https://www.mcoscillator.com/learning_center/weekly_chart/california_is_going_to_drop_a_liquidity_bomb_on_the_stock_market/
- QI/Danielle DiMartino Booth: https://twitter.com/DiMartinoBooth/status/1686353962184712192
- Yahoo Finance: https://finance.yahoo.com/news/employee-retention-credit-deadline-business-224500417.html
- Fitch: https://www.fitchratings.com/research/sovereigns/fitch-downgrades-united-states-long-term-ratings-to-aa-from-aaa-outlook-stable-01-08-2023
- New York Times: https://www.nytimes.com/2021/04/28/us/politics/biden-american-families-plan.html
- McKinsey: https://www.mckinsey.com/industries/public-sector/our-insights/the-chips-and-science-act-heres-whats-in-it
- Penn Wharton: https://budgetmodel.wharton.upenn.edu/estimates/2023/4/27/update-cost-climate-and-energy-inflation-reduction-act
- CNBC: https://www.cnbc.com/2023/06/22/amid-lower-inflation-buying-power-rose-for-first-time-in-2-years.html
- University of Michigan: https://data.sca.isr.umich.edu/
- World Meteorological Organization: https://public.wmo.int/en/media/news/copernicus-confirms-july-2023-was-hottest-month-ever-recorded
- Washington Post: https://www.washingtonpost.com/climate-environment/2023/07/28/natural-gas-heat-waves-climate/
- CNN: https://edition.cnn.com/2023/08/04/business/gas-prices-extreme-heat/index.html
- BEA: https://www.bea.gov/news/2023/gross-domestic-product-second-quarter-2023-advance-estimate
- FRED: https://fred.stlouisfed.org/series/PSAVERT
- Redbook Research: https://www.redbookresearch.com/8702.html
- New York Fed: https://www.newyorkfed.org/microeconomics/hhdc
- Federal Reserve: https://www.federalreserve.gov/releases/g19/current/
- Statista: https://www.statista.com/statistics/241488/population-of-the-us-by-sex-and-age/
- CreditCards.com: https://www.creditcards.com/news/rate-report/
- Forbes: https://www.forbes.com/advisor/credit-cards/average-credit-card-interest-rate/
- Bank of America: https://business.bofa.com/content/dam/flagship/bank-of-america-institute/economic-insights/consumer-checkpoint-june-2023.pdf
- CNBC: https://www.cnbc.com/2023/07/28/bank-of-japan-boj-to-guide-yield-curve-control-with-greater-flexibility.html
- BoE: https://www.bankofengland.co.uk/-/media/boe/files/monetary-policy-summary-and-minutes/2023/monetary-policy-summary-and-minutes-august-2023.pdf
- WSJ: https://www.wsj.com/articles/china-slips-into-deflation-in-warning-sign-for-world-economy-bbefb179
- The Daily Shot: https://thedailyshot.com/2023/08/07/temp-employment-continues-to-decline/
Index Definitions
The S&P 500 Index is widely regarded as the best single gauge of the United States equity market. It includes 500 leading companies in leading industries of the U.S. economy. The S&P 500 focuses on the large cap segment of the market and covers approximately 75% of U.S. equities.
The Bloomberg Barclays U.S. Aggregate Index represents securities that are SEC-registered, taxable, and dollar denominated. The index covers the U.S. investment grade fixed rate bond market, with index components for government and corporate securities, mortgage pass-through securities, and asset-backed securities. Duration is roughly 5 years.
The Bloomberg U.S. Corporate High Yield Bond Index measures the USD-denominated, high yield, fixed-rate corporate bond market. Securities are classified as high yield if the middle rating of Moody’s, Fitch and S&P is Ba1/BB+/BB+ or below. Bonds from issuers with an emerging markets country of risk, based on the indices’ EM country definition, are excluded.
The Russell 1000® Value Index measures the performance of the large-cap value segment of the U.S. equity universe. It includes those Russell 1000 companies with lower price-to-book ratios and lower expected and historical growth rates.
The Russell 1000® Growth Index measures the performance of the large- cap growth segment of the US equity universe. It includes those Russell 1000 companies with relatively higher price-to-book ratios, higher I/B/E/S forecast medium term (2 year) growth and higher sales per share historical growth (5 years).
The Russell 2000® Index measures the performance of the small-cap segment of the US equity universe. It includes approximately 2000 of the smallest US equity securities in the Russell 3000 Index based on a combination of market capitalization and current index membership. The Russell 2000 Index represents approximately 10% of the total market capitalization of the Russell 3000 Index. Because the Russell 2000 serves as a proxy for lower quality, small cap stocks, it provides an appropriate benchmark for RMB Special Situations.
MSCI EAFE Index*: an equity index which captures large and mid-cap representation across 21 of 23 Developed Markets countries around the world, excluding the U.S. and Canada. With 926 constituents, the index covers approximately 85% of the free float-adjusted market capitalization in each country.
The MSCI Emerging Markets Index* measures equity market performance in the global emerging markets universe. It covers over 2,700 securities in 21 markets that are currently classified as EM countries. The MSCI EM Index universe spans large, mid and small cap securities and can be segmented across all styles and sectors.
The U.S. Dollar Index is used to measure the value of the dollar against a basket of six foreign currencies: the euro, Swiss franc, Japanese yen, Canadian dollar, British pound, and Swedish krona.
The Deutsche Bank EM FX Equally Weighted Spot Index, an equal-weighted basket of 21 emerging market currencies.
MSCI U.S. REIT Index is a free float-adjusted market capitalization weighted index that is comprised of equity Real Estate Investment Trusts (REITs). The index is based on the MSCI USA Investable Market Index (IMI), its parent index, which captures the large, mid and small cap segments of the USA market. With 150 constituents, it represents about 99% of the US REIT universe and securities are classified under the Equity REITs Industry (under the Real Estate Sector) according to the Global Industry Classification Standard (GICS®), have core real estate exposure (i.e., only selected Specialized REITs are eligible) and carry REIT tax status.
*Source: MSCI.MSCI makes no express or implied warranties or representations and shall have no liability whatsoever with respect to any MSCI data contained herein. The MSCI data may not be further redistributed or used as a basis for other indexes or any securities or financial products. This report is not approved, endorsed, reviewed or produced by MSCI. None of the MSCI data is intended to constitute investment advice or a recommendation to make (or refrain from making) any kind of investment decision and may not be relied on as such.
Performance Disclosures
All market pricing and performance data from Bloomberg, unless otherwise cited. Asset class and sector performance are gross of fees unless otherwise indicated.
The opinions and analyses expressed in this newsletter are based on RMB Capital Management, LLC’s (“RMB Capital”) research and professional experience are expressed as of the date of our mailing of this newsletter. Certain information expressed represents an assessment at a specific point in time and is not intended to be a forecast or guarantee of future results, nor is it intended to speak to any future time periods. RMB Capital makes no warranty or representation, express or implied, nor does RMB Capital accept any liability, with respect to the information and data set forth herein, and RMB Capital specifically disclaims any duty to update any of the information and data contained in this newsletter. The information and data in this newsletter does not constitute legal, tax, accounting, investment or other professional advice. Returns are presented net of fees. An investment cannot be made directly in an index. The index data assumes reinvestment of all income and does not bear fees, taxes, or transaction costs. The investment strategy and types of securities held by the comparison index may be substantially different from the investment strategy and types of securities held by your account. RMB Asset Management is a division of RMB Capital Management.