


Key Takeaways
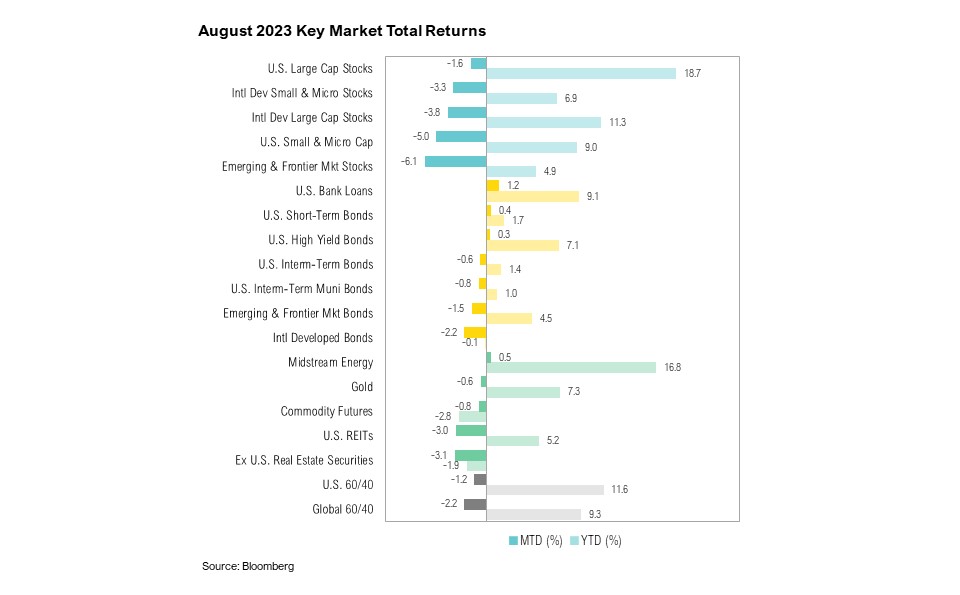
- The S&P 500 experienced a 1.6% decline in August but remains 18.7% higher on the year, while the Bloomberg Aggregate Bond Index is up a paltry 1.4% for the year to date.
- During his Jackson Hole speech, Jerome Powell reaffirmed the Fed’s commitment to a 2% inflation target, solidifying its “higher for longer” stance on interest rates.
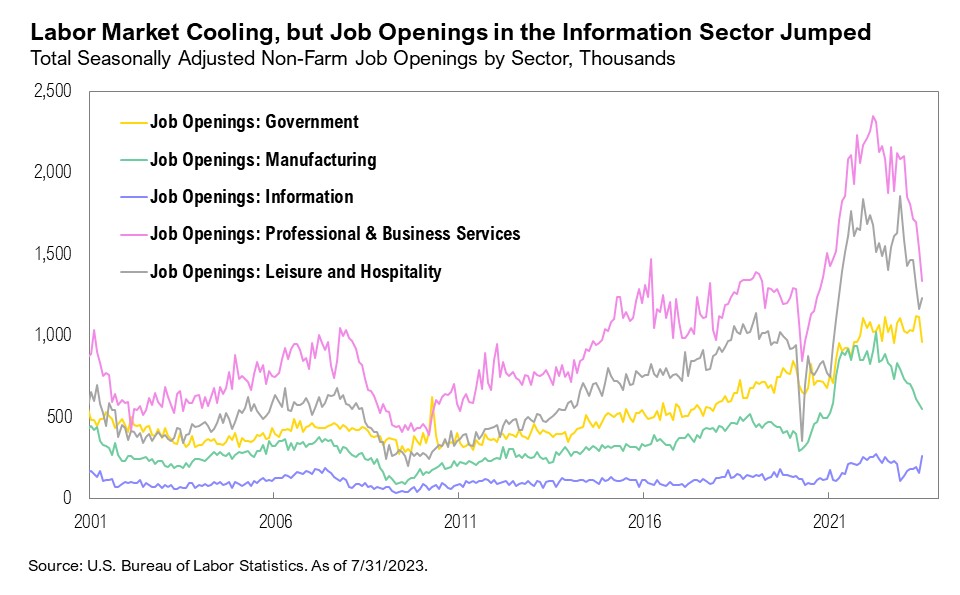
- Job openings softened, albeit from exceptionally tight levels, and consumer confidence declined as elevated inflation continued to frustrate consumers.
- Congress returned from recess at the end of August and is already gearing up for another showdown as a potential government shutdown looms.
Overview
The S&P 500 ended August with negative monthly returns for the first time since February. Despite being down 1.6% on the month, the S&P 500 is still up 18.7% year to date. It has not been an easy year for bonds. The Bloomberg Aggregate Bond Index is up only 1.4% year to date, and for the month of August, it was down 0.6%. Since 1976, the Bloomberg Aggregate Bond Index has averaged just two months per year when its monthly returns fell below -0.6%, yet this has happened 11 times since the start of 2022. As of the end of August, 10-year Treasuries were on pace to experience their third consecutive year of negative returns, an occurrence that has not happened in U.S. history.1
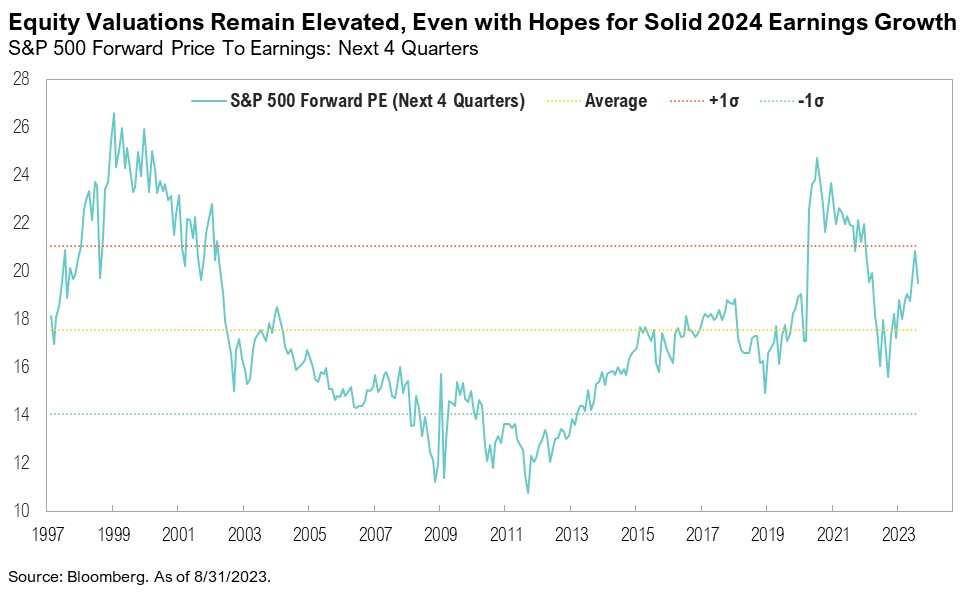
As summer comes to an end, so does the second-quarter earnings season. With 99% of companies reporting, the blended year-over-year earnings for S&P 500 companies shows that earnings declined by 4.1%, the third consecutive quarter of decline.2 This growth rate is well below both the five-year average of 12.0% and the ten-year average earnings growth rate of 8.5%.2 For the full-year 2023, year-over-year earnings estimates are up slightly, reaching 1.2% at the end of August, compared to 0.5% at the end of June.2 The forward price-to-earnings (P/E) for the S&P 500 is currently 18.8, which is just above the five-year average of 18.7 and 10-year average of 17.5.2
Although the Federal Open Market Committee (FOMC) did not meet in August, Federal Reserve Chair Jerome Powell’s speech at the annual Jackson Hole Economic Symposium provided insights into the Fed’s plans through 2024. Powell reiterated the Fed’s “higher for longer” message and confirmed its commitment to a 2% inflation target.3 He also put any rumors the Fed was contemplating a higher inflation target solidly to rest.4
“It is the Fed’s job to bring inflation down to our 2% goal, and we will do so. We have tightened policy significantly over the past year. Although inflation has moved down from its peak—a welcome development—it remains too high. We are prepared to raise rates further if appropriate…”3
Crude oil inventories have dropped below 2022 levels and the U.S. strategic petroleum reserve (SPR) was increased by 3.6 million barrels over the past four weeks, a small start in the attempt to replenish the 247-million-barrel drawdown authorized by the Biden administration to keep oil prices contained since the Russian invasion of Ukraine.5,6,7 Overall, U.S. crude oil inventories, including SPR, have dropped to 46 days’ worth of supply—well below the average since 1980 of 65 days’ worth.8 Combined with a steady decline in rig counts since December 2022, West Texas Intermediate (WTI) crude oil prices have been increasing since July 2022, reaching $83 at the end of August. Given their significance to the average consumer, gas prices are often viewed as a proxy for inflation, which remains a key issue for voters. As such, gas prices have historically had an inverse relationship with presidential approval ratings, and 2023 is following that trend. Biden’s approval rating is once again declining and near the lowest of his term, which came in June and July 2022 when national gas prices reached a high of $5.02 per gallon.9,10 This dynamic serves as a reminder of the intertwining of markets and politics, which will increasingly come into focus for investors given next year’s election.
The labor market shows some signs of cooling down. U.S. job openings dropped to 8.8 million in July, dipping below 9 million for the first time since March 2021, despite still being well above pre-pandemic levels.11 Voluntary resignations (or quits) have dropped back to pre-pandemic levels, and the average U.S. quit rate sits at around 2.3%.11 The largest decline in job openings was in business and professional services (-198,000 from June to July) and government (-155,000 from June to July).11 In contrast, job openings in information industries shot up by 101,000, an all-time high, begging the question of whether generative AI is already starting to influence the labor market.
Underpinning the impact of rising gas prices and the cooling labor market, the Conference Board’s Consumer Confidence survey dropped by 7.9 points to 106.1—its largest month-to-month decline in two years. Consumers cited rising prices (particularly groceries and gasoline) and the tighter job market as the primary reasons for the dip.12
The personal savings rate (as a percentage of disposable personal income) ticked down to 3.5% in July from 4.3% in June and is now well below the historical average of 8.9% as measured since 1952.13 The Johnson Redbook Index, a weekly measure of retail sales growth year over year, has steadily declined since December 2021, dipping into negative territory in July. However, it rebounded in August to levels last seen in early April.14 The Federal Reserve’s Beige Book (a publication recording current economic conditions across the 12 Federal Districts) points to a slowdown in spending on certain retail categories, especially non-essential items.15 Districts also reported that excess savings have likely been exhausted, which has been corroborated by research by JP Morgan and the San Francisco Federal Reserve.15,16,17 Interestingly, the number of mentions of “recession” in the Beige Book increased to 15, up from the three mentions in July.15 In contrast, an increasing number of FOMC committee members no longer believe that a recession will occur in 2023/24.18
Congress returned from its annual month-long recess at the end of August and is already squaring off for another government shutdown fight. Even though the debt ceiling debate is settled until after the November 2024 elections, another fiscal debate is now looming. Congress needs to pass 12 appropriation bills to fund all government agencies and federal programs before September 30.19 If Congress cannot pass these bills by October 1 (the start of the government’s fiscal year), a “continuing resolution” will need to be passed to temporarily extend funding. Without an agreement or a continuing resolution, a government shutdown may be inevitable.19 Unlike the recent debt ceiling agreement, this is likely just a case of political posturing before the election and is unlikely to cause any major issues for the economy.
Markets
The hot streak that markets had been on over the summer took a pause, and most asset classes ended August with negative returns. U.S. large cap stocks fared better than their international counterparts. The S&P 500 fell 1.6%, and the MSCI EAFE ended August down 3.8%. After outperforming the S&P 500 by 3.7% in 2022, the MSCI EAFE now trails the S&P 500 by 7.4% year to date. U.S. small and micro-cap stocks fared worse than their international counterparts. The Russell 2000 ended August down 5.0%, and the MSCI EAFE Small Cap ended the month down 3.3%. Emerging and frontier market stocks were the worst-performing asset class in August.
Fixed income posted poor returns in August, as international developed market bonds ended the month down 2.2%. Japan’s bonds fared worst, followed by Israel and Sweden. Midstream energy ended August up 0.5% and remains the second-best performing asset class year to date after U.S. large cap stocks.
In foreign markets, the Chinese government announced on August 28 that the stamp duty on securities trading would be halved in an effort to restore investor confidence after international investors dumped a record $12 billion of Chinese stocks in August due to the country’s deteriorating economic outlook.20,21 This is the first change to the stamp duty on Chinese stock trading since 2008.22
On August 31, following guidance from the People’s Bank of China, several major Chinese cities, including Shanghai and Beijing, announced eased mortgage requirements for some homebuyers in an effort to revive the country’s beleaguered property sector. People will now be allowed to take preferential loans for first-home purchases regardless of credit records, and minimum downpayments will be cut to between 20% and 30% (from 30% to 40% previously).23,24
Japan is facing a set of increasingly complex challenges. The yen’s buying power has dropped to a 53-year low, and the Bank of Japan’s real effective exchange rate (a measure of a currency’s strength relative to a basket of other currencies) dropped to 74.3.25 The Bank of Japan continues to purchase staggering amounts of Japanese government bonds, totaling almost $3 trillion in purchases since 2020.26
Looking Forward
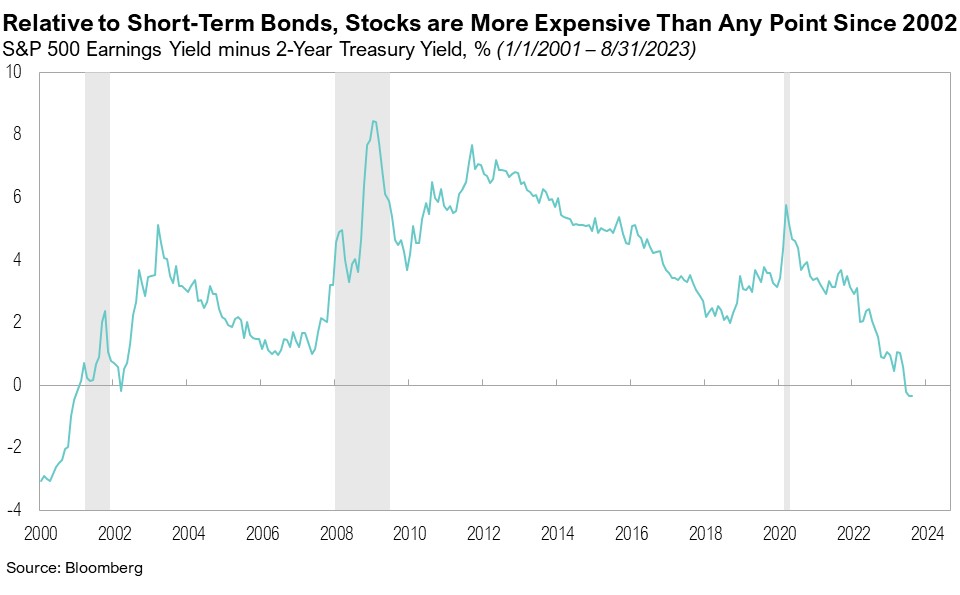
Despite the recent pick up in retail spending and general resilience in the economy, we do not want to lose sight of the big picture: history strongly suggests that after aggressive rate-hiking cycles, risky assets produce sub-par outcomes. This seems especially likely given that equities already enjoyed high valuations and considerable allocations at the start of the rate-hiking period. Given that forward price-to-earnings multiples for the S&P 500 are at the higher end of historical ranges, stocks aren’t cheap in isolation. Further, relative to short-term bonds, which now sport a substantial yield premium, they are more expensive than at any point since 2002. Further, in light of recent high returns for the S&P 500 and improving sentiment, allocations to stocks have drifted up to some of their highest levels in history.27
We believe there will be continued volatility in equity and fixed income markets, as the Federal Reserve shoots for their soft-landing goal while the U.S. economy and markets grapple with mixed economic data. We advise caution as both bull and bear market scenarios are possible from this point. Stocks might continue to shrug off higher rates and emerge even higher one year from now. However, stocks could decline given recent market strength, growing optimism, and a potential Fed pivot. Our goal is to be prepared for either outcome. During volatile times, we believe the key to successful investing is to remain committed to long-term investment plans.
Citations
- Bank of America: https://rsch.baml.com/access?q=XyjJRZXQ-EI
- FactSet: https://advantage.factset.com/hubfs/Website/Resources%20Section/Research%20Desk/Earnings%20Insight/EarningsInsight_090123.pdf
- Federal Reserve: https://www.federalreserve.gov/newsevents/speech/powell20230825a.htm
- WSJ: https://www.wsj.com/economy/central-banking/how-hard-should-the-fed-squeeze-to-reach-2-inflation-77dbf56f
- Reuters: https://www.reuters.com/markets/commodities/oil-prices-hover-near-10-month-high-supply-concerns-2023-09-13/
- EIA: https://www.eia.gov/petroleum/supply/weekly/
- EIA: https://www.eia.gov/dnav/pet/hist/LeafHandler.ashx?n=PET&s=WCSSTUS1&f=W
- Bank of America via Barchart: https://twitter.com/Barchart/status/1700320322346483858/photo/1
- FiveThirtyEight: https://projects.fivethirtyeight.com/biden-approval-rating/
- GasBuddy: https://www.gasbuddy.com/charts
- Bureau of Labor Statistics: https://www.bls.gov/news.release/jolts.nr0.htm
- Conference Board: https://www.conference-board.org/topics/consumer-confidence
- FRED: https://fred.stlouisfed.org/series/PSAVERT
- Trading Economics: https://tradingeconomics.com/united-states/redbook-index
- Federal Reserve: https://www.federalreserve.gov/monetarypolicy/files/BeigeBook_20230906.pdf
- Yahoo Finance: https://finance.yahoo.com/news/consumers-spent-excess-savings-pandemic-203001683.html
- San Francisco Federal Reserve: https://www.frbsf.org/our-district/about/sf-fed-blog/excess-no-more-dwindling-pandemic-savings/
- FOMC Minutes: https://www.federalreserve.gov/monetarypolicy/files/fomcminutes20230726.pdf
- Charles Schwab Asset Management: https://www.schwabassetmanagement.com/content/another-potential-shutdown-looms-over-fall-session
- The Ministry of Finance of the People’s Republic of China: http://szs.mof.gov.cn/zhengcefabu/202308/t20230827_3904226.htm
- Financial Times: https://www.ft.com/content/8a6d78e1-fa95-4e7c-aade-47b33f658468
- CNN: https://www.cnn.com/2023/08/28/investing/china-stock-stamp-duty-cut-intl-hnk/index.html
- Reuters: https://www.reuters.com/world/china/chinese-cities-ease-mortgage-rules-revive-property-sector-2023-08-31/
- CNN: https://www.cnn.com/2023/09/01/economy/china-mortgage-stimulus-intl-hnk/index.html
- Nikkei Asia: https://asia.nikkei.com/Business/Markets/Currencies/Yen-s-buying-power-sinks-to-53-year-low-after-decades-of-stagnation
- The Japan Times: https://www.japantimes.co.jp/business/2023/08/21/bank-of-japan-government-bonds/
- AAII: https://www.aaii.com/assetallocationsurvey
Index Definitions
The S&P 500 Index is widely regarded as the best single gauge of the United States equity market. It includes 500 leading companies in leading industries of the U.S. economy. The S&P 500 focuses on the large cap segment of the market and covers approximately 75% of U.S. equities.
The Bloomberg Barclays U.S. Aggregate Index represents securities that are SEC-registered, taxable, and dollar denominated. The index covers the U.S. investment grade fixed rate bond market, with index components for government and corporate securities, mortgage pass-through securities, and asset-backed securities. Duration is roughly 5 years.
The Bloomberg U.S. Corporate High Yield Bond Index measures the USD-denominated, high yield, fixed-rate corporate bond market. Securities are classified as high yield if the middle rating of Moody’s, Fitch and S&P is Ba1/BB+/BB+ or below. Bonds from issuers with an emerging markets country of risk, based on the indices’ EM country definition, are excluded.
The Russell 1000® Value Index measures the performance of the large-cap value segment of the U.S. equity universe. It includes those Russell 1000 companies with lower price-to-book ratios and lower expected and historical growth rates.
The Russell 1000® Growth Index measures the performance of the large- cap growth segment of the US equity universe. It includes those Russell 1000 companies with relatively higher price-to-book ratios, higher I/B/E/S forecast medium term (2 year) growth and higher sales per share historical growth (5 years).
The Russell 2000® Index measures the performance of the small-cap segment of the US equity universe. It includes approximately 2000 of the smallest US equity securities in the Russell 3000 Index based on a combination of market capitalization and current index membership. The Russell 2000 Index represents approximately 10% of the total market capitalization of the Russell 3000 Index. Because the Russell 2000 serves as a proxy for lower quality, small cap stocks, it provides an appropriate benchmark for RMB Special Situations.
MSCI EAFE Index*: an equity index which captures large and mid-cap representation across 21 of 23 Developed Markets countries around the world, excluding the U.S. and Canada. With 926 constituents, the index covers approximately 85% of the free float-adjusted market capitalization in each country.
The MSCI Emerging Markets Index* measures equity market performance in the global emerging markets universe. It covers over 2,700 securities in 21 markets that are currently classified as EM countries. The MSCI EM Index universe spans large, mid and small cap securities and can be segmented across all styles and sectors.
The U.S. Dollar Index is used to measure the value of the dollar against a basket of six foreign currencies: the euro, Swiss franc, Japanese yen, Canadian dollar, British pound, and Swedish krona.
The Deutsche Bank EM FX Equally Weighted Spot Index, an equal-weighted basket of 21 emerging market currencies.
MSCI U.S. REIT Index is a free float-adjusted market capitalization weighted index that is comprised of equity Real Estate Investment Trusts (REITs). The index is based on the MSCI USA Investable Market Index (IMI), its parent index, which captures the large, mid and small cap segments of the USA market. With 150 constituents, it represents about 99% of the US REIT universe and securities are classified under the Equity REITs Industry (under the Real Estate Sector) according to the Global Industry Classification Standard (GICS®), have core real estate exposure (i.e., only selected Specialized REITs are eligible) and carry REIT tax status.
*Source: MSCI.MSCI makes no express or implied warranties or representations and shall have no liability whatsoever with respect to any MSCI data contained herein. The MSCI data may not be further redistributed or used as a basis for other indexes or any securities or financial products. This report is not approved, endorsed, reviewed or produced by MSCI. None of the MSCI data is intended to constitute investment advice or a recommendation to make (or refrain from making) any kind of investment decision and may not be relied on as such.
Performance Disclosures
All market pricing and performance data from Bloomberg, unless otherwise cited. Asset class and sector performance are gross of fees unless otherwise indicated.
The opinions and analyses expressed in this newsletter are based on RMB Capital Management, LLC’s (“RMB Capital”) research and professional experience are expressed as of the date of our mailing of this newsletter. Certain information expressed represents an assessment at a specific point in time and is not intended to be a forecast or guarantee of future results, nor is it intended to speak to any future time periods. RMB Capital makes no warranty or representation, express or implied, nor does RMB Capital accept any liability, with respect to the information and data set forth herein, and RMB Capital specifically disclaims any duty to update any of the information and data contained in this newsletter. The information and data in this newsletter does not constitute legal, tax, accounting, investment or other professional advice. Returns are presented net of fees. An investment cannot be made directly in an index. The index data assumes reinvestment of all income and does not bear fees, taxes, or transaction costs. The investment strategy and types of securities held by the comparison index may be substantially different from the investment strategy and types of securities held by your account. RMB Asset Management is a division of RMB Capital Management.