


Key Takeaways
- Bond markets continued lower and the Bloomberg Aggregate Bond Index ended October down 1.6%, marking the longest stretch of negative bond returns since the 18th century.
- The U.S. GDP grew by 4.9% on an annualized basis in the third quarter, primarily driven by robust consumer spending and likely enhanced by pandemic-related financial relief programs.
- The U.S. government added $532 billion in debt outstanding in October, while facing future budget strains due to a record (and growing) $659 billion in interest outlays, signaling additional challenges for government spending productivity and overall fiscal health.
Overview
In October, financial markets reached several key milestones. Notably, October 12 marked the one-year anniversary of the 2022 bear market low. While the S&P 500 ended October down 2.1%, it is up 10.1% over the past twelve months. Bond markets continued their decline in October, and the Bloomberg Aggregate Bond Index ended the month down 1.6%. 2023 marks the third consecutive year of negative bond returns, a trend not seen since the Declaration of Independence was signed, making it the most extended bond drawdown in history.1 When adjusted for inflation, the return on the 10-year Treasury bond ended October down 36.2% since its peak in July 2020.
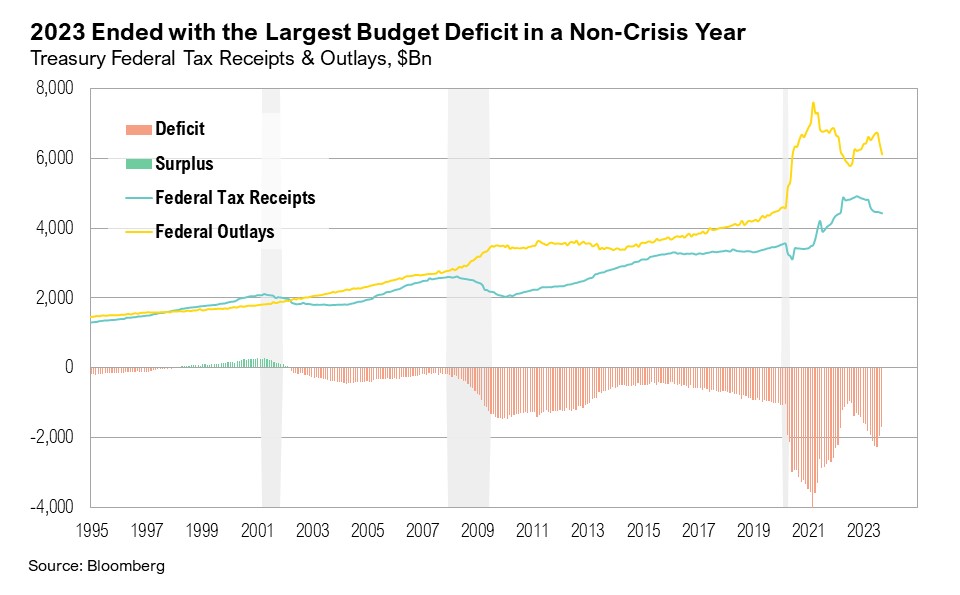
October also ushered in the new fiscal year for the United States, which ended the 2023 fiscal year with a notable deficit of $1.7 trillion—by far the largest deficit in a year without a recession or global crisis.2 On average, annual deficits since 2002 have hovered around $0.9 trillion. The Treasury's issuance announcements for the fourth quarter of 2023 and projections for the first quarter of 2024 suggest that the deficit may not be an anomaly but rather a continuation of the trend. Borrowing for the last quarter of 2023 is expected to reach $776 billion and an estimated $816 billion in the first quarter of 2024.3 The forecast for the first quarter alone exceeds the annual borrowing average of $721 billion since the turn of the millennium. Moreover, the government's debt outstanding increased by $532 billion in October, which is $256 billion more than the same period in the previous fiscal year.4
‘G’ is for Government
On October 26, preliminary estimates showed that U.S. real Gross Domestic Product (GDP) grew at an annualized rate of 4.9% in the third quarter, propelled by vigorous consumer spending. Nominal GDP growth, which does not adjust for inflation, rose 8.5% (annualized quarterly rate).5 Outside of the COVID-19 pandemic, this level of growth has only occurred three times since the Global Financial Crisis (GFC)—twice in 2014 and once in 2019.6
GDP is the sum of several parts: personal consumption (‘C’), business investment (‘I’), government spending (‘G’), and the balance of exports and imports (‘X-M’). ‘G’ represents the government’s role in an economy as a consumer and investor. In times of conflict or crisis, such as the GFC and the more recent COVID-19 pandemic, ‘G’ has historically taken a central role in stabilizing and boosting economic activity through spending, tax credits, and stimulus checks.
Personal consumption, or 'C,' continues to be a powerhouse for the U.S. economy, comprising 68% of the latest quarter's GDP and surpassing the usual 65%.7 This uptick underscores consumers' resilience despite higher interest rates. The strength of consumer spending owes much to lingering pandemic-era programs, notably the federal student loan repayment moratorium, which has provided over $260 billion in payment suspensions, and the employee retention credit, which has delivered more than $230 billion through a refundable tax credit to businesses and employees in the past two years. These programs have played a dual role: keeping funds in consumers' wallets and actively replenishing them.8,9,10 Although these efforts bolstered personal consumption, they did not show up as an increase in government spending.
'G' represented 17% of U.S. GDP in the third quarter, which, perhaps surprisingly, is below the historical average of 20%.7 Arguably more important than the level of government spending relative to the total economy is how much of that is covered by tax receipts and how productive that spending is. To understand why the 2023 deficit ballooned to such an extent, we must examine several factors.
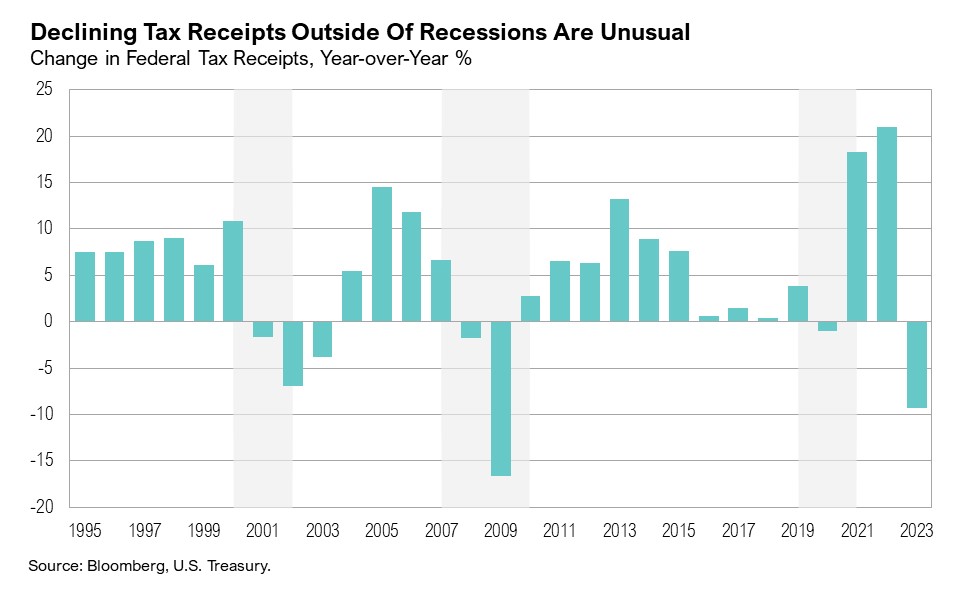
Federal tax receipts experienced a rare 9.3% year-over-year decline. Such a drop in tax revenue outside of a recession has not been observed since the Global Financial Crisis. Additionally, the Social Security Administration (SSA) delivered an 8.7% cost-of-living adjustment (COLA) for 2023, the largest in 40 years. As a result, SSA outlays increased to $1.4 trillion, an increase of more than $100 billion from the previous year. The COLA for 2024 will be 3.2%.11,12
Due to the banking crisis earlier this year, outlays of the Federal Deposit Insurance Corporation (FDIC) were $94 billion more in 2023 than in 2022.12,13 The FDIC, an agency responsible for the stability of the U.S. financial system, reported that recoveries associated with failed banks have been slower than projected and have added to the higher-than-expected outlays.13
By law, the Federal Reserve returns its profits after covering operating expenses to the Treasury. The Fed’s aggressive rate-hiking cycle and subsequent higher short-term interest rates have raised the Fed’s interest expenses, which has cut into the amount of money it hands back to Treasury. The Fed returned $581 million to Treasury in the 2023 fiscal year, far below the $76 billion handed back in 2022.12,14
The Department of Defense spent $54 billion more in the 2023 fiscal year than during the 2022 fiscal year.12 Further, the Biden administration recently asked Congress for $106 billion in military aid for Ukraine and Israel, as well as additional funding for the U.S. southern border and defense in the Pacific area to deter a third war breaking out in Taiwan.15,16 As renowned U.S. investor Stanley Druckenmiller recently pointed out, it may be necessary for the U.S. to spend this money on defense now to prevent a Russia-China-Iran axis because,
“Do you know how much we’re going to have to spend if Putin wins Ukraine?”17
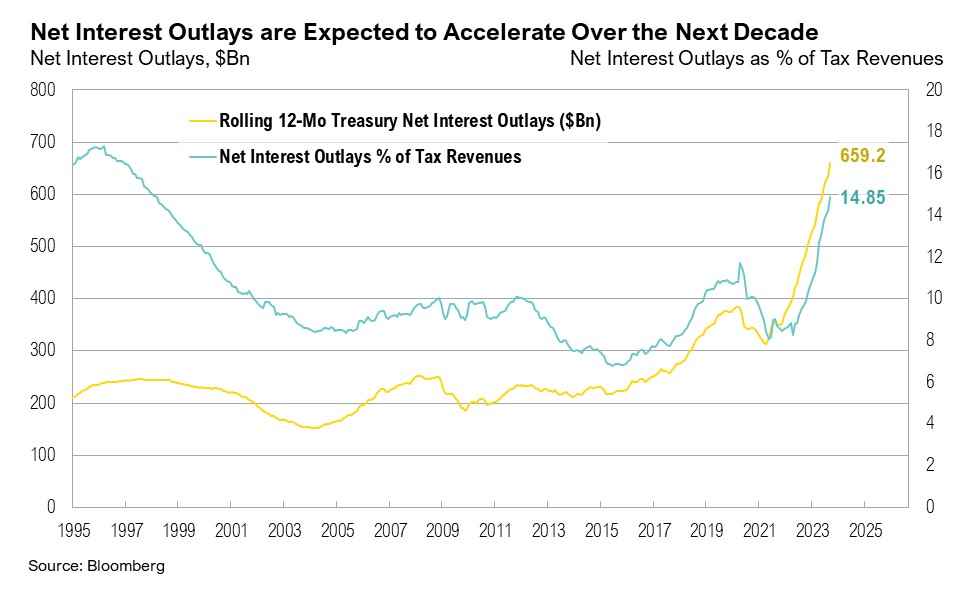
As government debt continues to mount, so do the government’s debt payments. For the 2023 fiscal year, net interest outlays (the amount of interest the government pays on outstanding debt) reached a record high of $659 billion. Net interest outlays are already a major contributor to the growth of total deficits in the U.S., and the Congressional Budget Office estimates that the government will spend at least $10 trillion over the next 10 years on interest payments alone.18 For context, the average net interest payments over the past 10 years have been $298 billion per fiscal year. Even if government spending as a percentage of GDP appears stable, the actual productivity of such spending is at risk of declining as debt service consumes a larger portion of the budget.
In essence, we believe the critical issue with 'G' is not its current share of GDP, but the mounting deficit amidst rising interest rates—particularly in a non-recessionary period. Additionally, the uptick in consumer spending, in part a result of generous government support during the pandemic, raises questions about its sustainability as these programs wind down, inflation persists, and personal savings diminish.
Markets
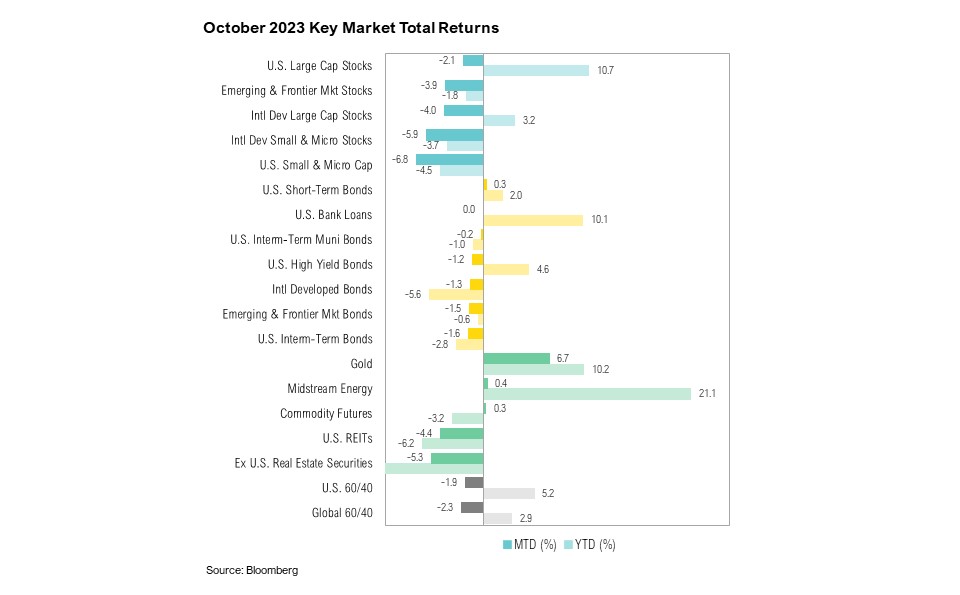
Nearly all asset classes ended October with negative returns. Gold was the only standout performer, which ended the month up 6.7%, due to strong returns largely fueled by the war in the Middle East. U.S. small cap stocks, as proxied by the Russell 2000 Index, continued their decline throughout October, ending the month down 6.8%. In fact, U.S. small cap stocks dropped into negative territory for the year, ending October down 4.5% year-to-date. Non-U.S. equities continue to trail U.S. equities, and the MSCI EAFE ended the month down 4.0%. International bonds ended October down 1.3%.
Third quarter earnings season kicked off in October. As of the end of October, 81% of S&P 500 companies had reported actual results, and earnings growth for the third quarter hit a lackluster 3.7%.19 Third quarter earnings growth estimates improved over the month, rising from -0.3% at the end of September to 3.7% at the end of October. Despite this modest improvement, full-year 2023 earnings growth is expected to be just 0.6% after fourth quarter earnings estimates were cut by 3.9% in October, the largest such cut since the second quarter of 2020.19
On November 2, the Japanese government approved an economic stimulus package worth approximately $113 billion in an effort by Japanese Prime Minister Fumio Kishida to lessen the impact of inflation on Japanese consumers, which reached a 40-year high earlier this year and remains near these levels.20,21 Part of the package includes income and residential tax cuts, as well as subsidies for lower income households.21 This would be the equivalent of a $680 billion economic stimulus package for the U.S. economy. Japanese equities are up 7.7% year-to-date, narrowly trailing the U.S. (up 10.7% year-to-date), and they continue to be one of the top-performing countries, ranking in seventh place.
In similar news, on October 25, China announced a fiscal stimulus plan to boost new areas of the Chinese economy, such as advanced manufacturing and renewable energy.22 This follows an initial announcement on October 17 that the Chinese government would issue $137 billion in sovereign debt, as well as raise the budget-deficit ratio.22 In contrast to Japan, Chinese equities are down 10% year-to-date and the country ranks as one of the worst performers in 2023.
Looking Forward
The net result of lower tax receipts and unbridled spending over the past few years is plain to see. At the end of fiscal year 2019, the U.S. national debt was $22.7 trillion. Currently, the U.S. national debt is $33.7 trillion—an $11 trillion jump (nearly 50%) in approximately four years. Higher interest rates mean that an increasing proportion of government spending will be consumed with debt service payments, and we question whether the government can continue to take such a heavy-handed role in the economy directly, as well as through indirect support of the consumer.
For this and other reasons, we anticipate heightened market volatility in the quarters ahead. The delayed impact of the Federal Reserve's aggressive rate-hiking cycle, higher long-term interest rates, the unfolding of two wars, and the upcoming U.S. presidential election all have the potential to disrupt markets. The U.S. economy has been gradually slowing and recession risks remain elevated through 2024. The Federal Reserve is still aiming for their soft-landing goal while the U.S. economy and markets grapple with mixed economic data. We continue to favor high quality stocks and bonds, rather than being overly aggressive with opportunities in lower quality assets. Short-term bonds remain attractive, but investors should be prepared for changes to the yield curve over the next 12 months
We believe that a high-quality diversified asset allocation remains the best approach to navigate uncertainty in the coming year. During volatile times, the key to successful investing is often remaining committed to long-term investment plans.
Citations
- Bank of America: https://rsch.baml.com/access?q=XyjJRZXQ-EI
- U.S. Treasury: https://www.fiscal.treasury.gov/files/reports-statements/mts/mts0923.pdf
- U.S. Treasury: https://home.treasury.gov/news/press-releases/jy1851
- U.S. Treasury: https://fiscaldata.treasury.gov/datasets/debt-to-the-penny/debt-to-the-penny
- FRED: https://fred.stlouisfed.org/series/GDP
- FRED: https://fred.stlouisfed.org/series/GDPC1#
- FRED: https://fred.stlouisfed.org/graph/?g=RIC
- Liberty Street Economics: https://libertystreeteconomics.newyorkfed.org/2023/10/borrower-expectations-for-the-return-of-student-loan-repayment/
- Yahoo Finance: https://finance.yahoo.com/video/one-tax-credit-may-fueling-215840010.html
- Wall Street Journal: https://www.wsj.com/politics/policy/irs-shuts-door-on-new-pandemic-tax-credit-claims-until-at-least-2024-e06bdef
- Social Security Administration: https://www.ssa.gov/oact/cola/colasummary.html
- U.S. Treasury: https://home.treasury.gov/system/files/136/Outlays-by-Agency-2023.pdf
- U.S. Treasury: https://fiscaldata.treasury.gov/datasets/daily-treasury-statement/operating-cash-balance
- Reuters: https://www.reuters.com/business/finance/fed-rising-income-costs-cut-funds-handed-back-treasury-last-year-2023-03-24/
- Reuters: https://www.reuters.com/world/white-house-asks-congress-106-billion-ukraine-israel-2023-10-20/
- NPR: https://www.npr.org/2023/10/20/1206301577/biden-ukraine-israel-congress-funding-request
- CNBC: https://www.cnbc.com/2023/11/01/stanley-druckenmiller-says-government-needs-to-stop-spending-like-drunken-sailors-cut-entitlements.html
- Congressional Budget Office: https://www.cbo.gov/system/files/2023-02/58848-Outlook.pdf
- FactSet: https://insight.factset.com/sp-500-earnings-season-update-november-3-2023
- Trading Economics: https://tradingeconomics.com/japan/inflation-cpi
- Wall Street Journal: https://www.wsj.com/world/asia/japan-cabinet-approves-113-billion-stimulus-to-ease-impact-of-inflation-7a715a82
- Bloomberg: https://www.bloomberg.com/news/articles/2023-10-25/china-stimulus-plan-to-make-big-impact-ex-pboc-official-says
Index Definitions
The S&P 500 Index is widely regarded as the best single gauge of the United States equity market. It includes 500 leading companies in leading industries of the U.S. economy. The S&P 500 focuses on the large cap segment of the market and covers approximately 75% of U.S. equities.
The Bloomberg Barclays U.S. Aggregate Index represents securities that are SEC-registered, taxable, and dollar denominated. The index covers the U.S. investment grade fixed rate bond market, with index components for government and corporate securities, mortgage pass-through securities, and asset-backed securities. Duration is roughly 5 years.
The Bloomberg U.S. Corporate High Yield Bond Index measures the USD-denominated, high yield, fixed-rate corporate bond market. Securities are classified as high yield if the middle rating of Moody’s, Fitch and S&P is Ba1/BB+/BB+ or below. Bonds from issuers with an emerging markets country of risk, based on the indices’ EM country definition, are excluded.
The Russell 1000® Value Index measures the performance of the large-cap value segment of the U.S. equity universe. It includes those Russell 1000 companies with lower price-to-book ratios and lower expected and historical growth rates.
The Russell 1000® Growth Index measures the performance of the large- cap growth segment of the US equity universe. It includes those Russell 1000 companies with relatively higher price-to-book ratios, higher I/B/E/S forecast medium term (2 year) growth and higher sales per share historical growth (5 years).
The Russell 2000® Index measures the performance of the small-cap segment of the US equity universe. It includes approximately 2000 of the smallest US equity securities in the Russell 3000 Index based on a combination of market capitalization and current index membership. The Russell 2000 Index represents approximately 10% of the total market capitalization of the Russell 3000 Index. Because the Russell 2000 serves as a proxy for lower quality, small cap stocks, it provides an appropriate benchmark for RMB Special Situations.
MSCI EAFE Index*: an equity index which captures large and mid-cap representation across 21 of 23 Developed Markets countries around the world, excluding the U.S. and Canada. With 926 constituents, the index covers approximately 85% of the free float-adjusted market capitalization in each country.
The MSCI Emerging Markets Index* measures equity market performance in the global emerging markets universe. It covers over 2,700 securities in 21 markets that are currently classified as EM countries. The MSCI EM Index universe spans large, mid and small cap securities and can be segmented across all styles and sectors.
The U.S. Dollar Index is used to measure the value of the dollar against a basket of six foreign currencies: the euro, Swiss franc, Japanese yen, Canadian dollar, British pound, and Swedish krona.
The Deutsche Bank EM FX Equally Weighted Spot Index, an equal-weighted basket of 21 emerging market currencies.
MSCI U.S. REIT Index is a free float-adjusted market capitalization weighted index that is comprised of equity Real Estate Investment Trusts (REITs). The index is based on the MSCI USA Investable Market Index (IMI), its parent index, which captures the large, mid and small cap segments of the USA market. With 150 constituents, it represents about 99% of the US REIT universe and securities are classified under the Equity REITs Industry (under the Real Estate Sector) according to the Global Industry Classification Standard (GICS®), have core real estate exposure (i.e., only selected Specialized REITs are eligible) and carry REIT tax status.
*Source: MSCI.MSCI makes no express or implied warranties or representations and shall have no liability whatsoever with respect to any MSCI data contained herein. The MSCI data may not be further redistributed or used as a basis for other indexes or any securities or financial products. This report is not approved, endorsed, reviewed or produced by MSCI. None of the MSCI data is intended to constitute investment advice or a recommendation to make (or refrain from making) any kind of investment decision and may not be relied on as such.
Performance Disclosures
All market pricing and performance data from Bloomberg, unless otherwise cited. Asset class and sector performance are gross of fees unless otherwise indicated.
The opinions and analyses expressed in this newsletter are based on RMB Capital Management, LLC’s (“RMB Capital”) research and professional experience are expressed as of the date of our mailing of this newsletter. Certain information expressed represents an assessment at a specific point in time and is not intended to be a forecast or guarantee of future results, nor is it intended to speak to any future time periods. RMB Capital makes no warranty or representation, express or implied, nor does RMB Capital accept any liability, with respect to the information and data set forth herein, and RMB Capital specifically disclaims any duty to update any of the information and data contained in this newsletter. The information and data in this newsletter does not constitute legal, tax, accounting, investment or other professional advice. Returns are presented net of fees. An investment cannot be made directly in an index. The index data assumes reinvestment of all income and does not bear fees, taxes, or transaction costs. The investment strategy and types of securities held by the comparison index may be substantially different from the investment strategy and types of securities held by your account. RMB Asset Management is a division of RMB Capital Management.