


Overview
When compared to the whirlwind year thus far, November was relatively quiet. Not a single major asset class ended the month with a negative return. The U.S. midterm elections wrapped up with no major disruptions, and while economic growth is slowing, evidence from recent economic reports suggests that inflation in the U.S. is also tapering off. In terms of economic releases, November produced mixed results. The U.S. economy added another 263,000 jobs, even as the unemployment rate slowly ticked up.1 Core inflation levels have dropped from the recent four-decade highs, yet the Federal Reserve continued to tighten monetary policy.
After the Federal Open Market Committee (FOMC) raised rates by another 75 basis points in early November, Fed Chair Jerome Powell indicated that a slowing in the pace of rate hikes could come ‘soon’—along with a recession.2 On December 14th, the FOMC raised rates by 50 basis points, slower than the more recent 75 basis point increases. Third-quarter earnings season is wrapping up, and 2022 calendar-year earnings expectations dropped only 4% from their peak in January 2022, while earnings expectations for the 2023 calendar year have come down by 8%—far from historical average recessionary declines, which generally fall by 22%.3 The unemployment rate also ticked up from 3.5% to 3.7% in November.
Core inflation (which excludes the more volatile food and energy components) dropped from its 40-year high in November to the lowest levels since January 2022, slowing to 7.7% on a year-over-year basis. The November retail sales report highlighted the resilience of consumers, despite uncertain economic conditions.4 Many consumers are still benefitting from robust nominal wage growth and legacy cash balances resulting from post-COVID-19 stimulus checks (including one-time tax refunds in California, which gave back as much as $1,000 for some households).5 The Personal Consumption Expenditures (PCE) Price Index, the Fed’s favored indicator for gauging inflation, rose 0.2% in October, and is up 5% relative to this time last year. This is a slight cooling since September and serves as another reminder that price increases are tapering off.6
China: A Fork in the Road
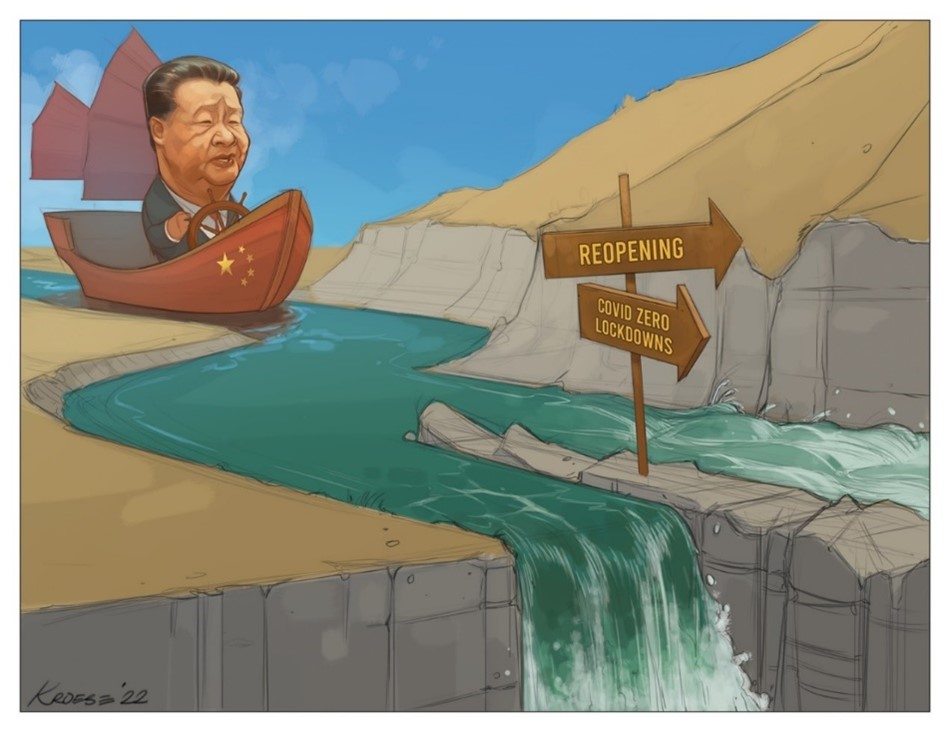
While November has been a relatively quiet month in the U.S., it has been a decidedly less peaceful month abroad. On November 2nd, a rumor circulated that the Chinese government would announce plans to end its stringent COVID-zero strategy.7 While unverified, the news caused a 5.5% one-day rally (equal to about $450 billion in market capitalization) in the Hang Seng China Enterprises Index as markets jumped at the possibility of China reopening after nearly three years of lockdowns.7 However, since the announcement, China has seen a spike in new COVID-19 cases, with record-high levels being reported.8 On November 25, widespread protests erupted in several major Chinese cities, as frustrations from living through nearly three years of lockdowns and stringent restrictions reached a boiling point.9 Then, a few days later, state media reports hinted at the rapid unwinding of lockdowns, and for the first time, officials downplayed the severity of the Omicron variant.10 Although the government has taken its first steps towards ending COVID-zero, new cases have never been higher. Though Chinese Communist Party (CCP) leader, President Xi Jinping, has tried to steer China through the pandemic, he has now reached an important fork in the road—and a test to his authoritarian approach.
In 2018, China’s leaders voted to remove the two-term presidential limit that had been in place since the 1990s, opening up the opportunity in October of this year for Xi Jinping to secure his third term as China’s president.11 President Xi’s rule is a clear shift away from that of his predecessors, who pursued rapid economic development and welcomed international businesses.12 Instead, Xi has favored more authoritarian rule, overseeing new restrictions on individual freedoms, increased media censorship, regulatory crackdowns in several sectors, and a reining in on the expansion of many big businesses.13 Under Xi’s rule, the Chinese government’s grip on Hong Kong has also tightened and expressed renewed interest in the self-ruled island of Taiwan. Xi Jinping has also adopted a more personality-driven approach, inserting his ‘Xi Jinping Thought’ into the country’s education system and constitution.14
Soon after the virus broke out in December 201915, China began implementing President Xi’s strict COVID-zero strategy, which he championed as the only means to steer the country through the pandemic.16 With this targeted approach, local authorities oversaw strict social distancing rules, isolation regulations, mass testing requirements, and residential lockdowns.17 However, as the months and years progressed and as new variants emerged, the social and economic costs of COVID-zero have become increasingly difficult to ignore.
A resolute determination to stick to policy has put the CCP in a quandary. It has been a challenging three years for China. Since the start of the pandemic, the country has been beleaguered by a rapid slowdown in economic growth, weak consumption, a collapsing property market, vast capital outflows, and rising public dissent against the consequences of the government’s ongoing strict COVID-zero strategy—all while the rest of the world reopened.
Three years of ongoing lockdowns have severely hampered China’s growth, as evidenced by the country’s most recently released data. China’s third-quarter 2022 gross domestic product grew by 3.9% from the year prior. The reported third-quarter growth brings year-to-date growth to 3%—well below the Chinese government’s official growth target of 5.5% for 2022.18 China’s exports shrank in October, with exports to the U.S. (China’s largest trade partner on a single-country basis) declining for a third straight month, falling 12.6% from the previous year.19 China’s global exports of household appliances, shoes, and toys declined by 20%, 11%, and 18%, respectively, when compared to October 2021.19
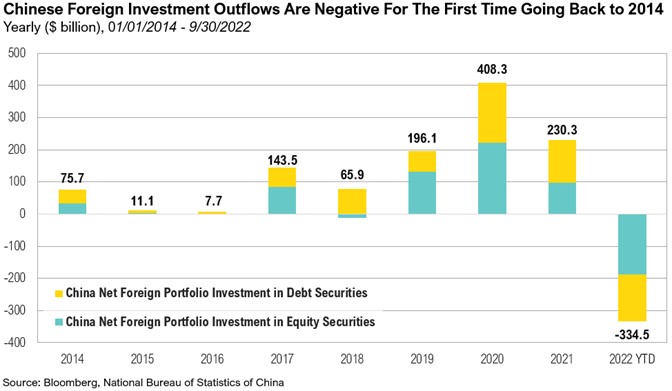
The uncertainty surrounding the Chinese government’s path forward has begun to weigh on investor sentiment, leading to a selloff of yuan-denominated assets. Outflows from Chinese stocks and bonds have accelerated throughout 2022, as the war broke out in Ukraine and Xi Jinping’s strict COVID-zero strategy continued. Since 2014 China Net Foreign Portfolio (a yuan-denominated index that is calculated using the People’s Bank of China Domestic Renminbi Financial Assets Held by Overseas Entities report) had never seen negative outflows of both debt securities and equity securities. Year-to-date, there has been more than $334.5 billion in outflows from mainland China.
It has been more than a year since Chinese property developer Evergrande made global headlines for defaulting on its debt, an event that highlighted fundamental difficulties in the Chinese property market. Today, the country’s real estate market remains troubled. The Evergrande liquidity crisis led to other major property developers scrambling to seek protection from creditors, and in turn construction on many pre-sold housing projects were suspended or delayed indefinitely.20 Angry homeowners, forced to pay mortgages on unfinished homes, protested in July of this year, and authorities have since encouraged banks to increase loan support so that developers could complete unfinished projects.21
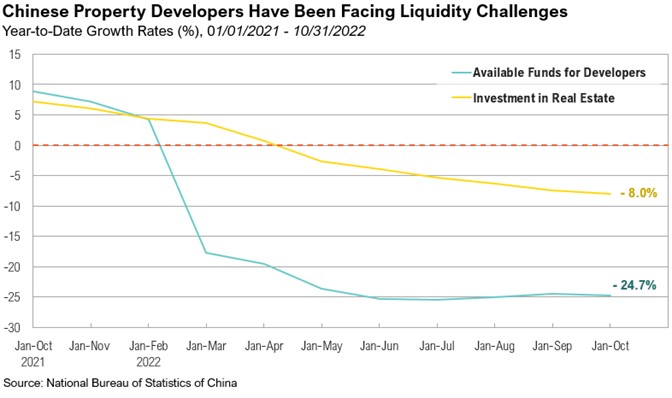
Estimates show that Chinese property developers only delivered around 60% of homes pre-sold between 2013 and 2020, but over the same period, the country’s outstanding mortgage loans increased by 26.3 trillion yuan ($3.9 trillion).22 Further pushed down by continued lockdowns and muted consumer spending, real estate prices in China have tumbled as authorities now must try to reign in high debt levels in the sector.23 Home prices in China have declined for thirteen consecutive months, and funds raised by Chinese property developers to complete unfinished projects or start new projects are down 24.7%, compared to the previous year.23 Investment into the Chinese real estate market has also declined 8% year-over-year.24
For decades, China’s Communist Party pledged prosperity for its people in exchange for certain freedoms. Past leaders welcomed the expansion of international businesses in China and promoted rapid economic development. Under the leadership of President Xi Jinping, the government’s social contract has changed. The CCP has started to assume a more prominent role in all aspects of society, clamping down on individual freedom and curbing the rapid growth of big businesses. Yet the COVD-zero strategy brought more limitations on freedoms, along with slower economic growth, and it became increasingly unclear whether the CCP would deliver the prosperity it promised.
At the end of November, following historic nationwide protests, the government announced widespread easing of several strict COVID-zero policy measures, including ending blanket testing rules and lifting lockdowns. Although it’s unclear whether the government will continue to ease restrictions and reopen its borders or if it will perform a sudden about-turn, the CCP must now face the aftermath of three undeniably difficult years.
Markets
November saw positive returns across the board. International markets outperformed the U.S. The MSCI Emerging Markets Index posting a distinguished 14.8% return for the month, and the MSCI EAFE Index ended up 11.3%. The S&P 500 rose 5.6% over November. The November rally in international markets was largely driven by an apparent shift towards cyclical stocks, which tend to align with the trajectory of global economic growth.25 The strength of the U.S. dollar also eased in November, adding to the outperformance of international markets compared to U.S. markets. Midstream energy remains one of the only asset classes to post positive returns for the year, returning 37.4% year-to-date.
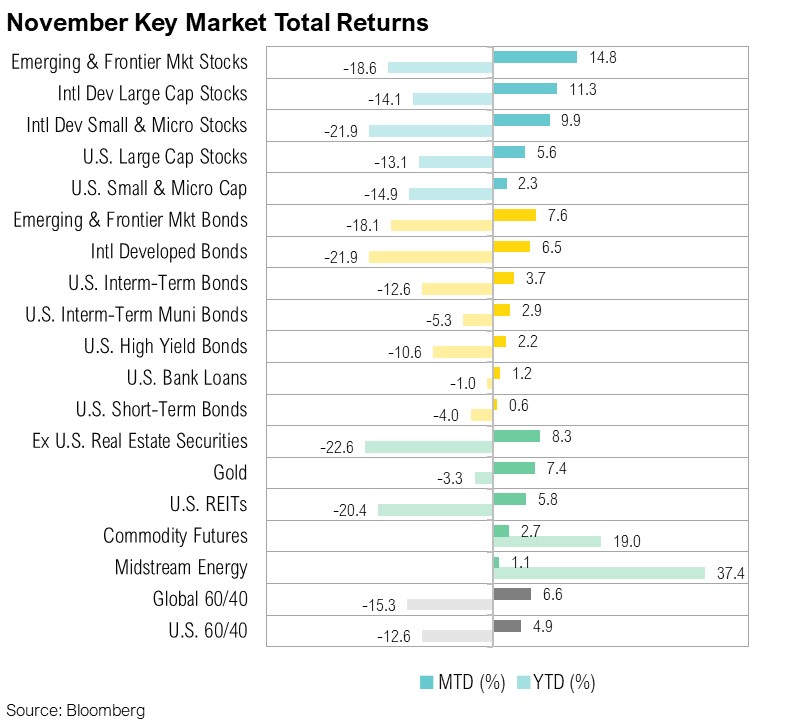
Inflation in the Eurozone eased slightly in November, dropping to 10% from record-high levels of 10.1% in October. The decline in headline inflation is the first drop since June 2021.26 U.K. inflation reached a new 41-year high, jumping to 11.1% in October. Domestic gas prices in the United Kingdom are more than double the price in October 2021, and the price of food has jumped 16.4% over the past 12 months.27
The 10-year minus 2-year Treasury yield curve (a common indicator of economic growth) remained inverted throughout November. By the end of the month, this Treasury curve measure was at the most inverted level since the 1980s at -0.77%.28 Both emerging market bonds and developed market bonds posted positive gains for November. Emerging market bonds were up 7.6% and developed market bonds were up 6.5%. U.S. bonds intermediate-term bonds posted a positive 3.7% gain for the month.
Even if not significant for traditional asset markets, another notable event that occurred in November was the high-profile cryptocurrency firm FTX filing for bankruptcy. Prominent celebrities (including star quarterback Tom Brady, former supermodel Gisele Bündchen, and ‘Seinfeld’ creator Larry David) joined the ranks of key regulators and well-respected private equity firms who endorsed—and financially backed—FTX and its founder, Sam Bankman-Fried, who ran a questionable business and in turn lost several billion dollars that weren’t his to lose.29
Looking Forward
As much as China’s president Xi Jinping is facing a fork in the road, so too is Federal Reserve Chairman Jerome Powell. As of the last week in November, the negative impact of China’s COVID restrictions on the economy was up to 25.1% of its total GDP, indicating that China’s economy has a long way to go to fully recover.30 President Xi must make some challenging choices on how to safely commandeer his country through to the other side of COVID-zero. His choices will also affect the U.S. economy since a broad and sustained re-opening in China could ease global supply chain issues and in turn reduce certain pricing pressures, but it could simultaneously create more demand for commodities, such as oil, and put upward pressure on those prices.
On the other hand, Powell must decide how much further to tighten monetary policy and potentially push the U.S. economy into a recession. U.S. economic data indicates that the economy is at a crucial juncture. Economic activity and earnings growth are slowing, but so is inflation. The speed of the slowing in economic growth relative to inflation will dictate whether the U.S. enters a recession and when policymakers may be able to reverse, rather than just slow the pace of the tightening pressure they are applying to the economy. As it stands, growth is slowing faster than inflation, which keeps the Federal Reserve in a bind. As inflation sits several percent above its mandate of 2%, the Fed noted the following in its November meeting minutes:
“The staff, therefore continued to judge that the risks to the baseline projection for real activity were skewed to the downside and viewed the possibility that the economy would enter a recession sometime over the next year as almost as likely as the baseline.” 31
Adding intrigue and complexity to this situation is the fact that the two countries facing these forks in the road are two of the most economically important countries in the world. Critical decisions will be made by two of the world’s most powerful policymakers, who will chart their paths in isolation and in pursuit of their own country’s best interests.
As has been the case for most of the year, ongoing elevated inflation levels and central bank interest rate policy remained a top worry for investors. While the Federal Reserve raised interest rates by another 0.75% in November, a below consensus inflation reading gave investors hope that inflation may be peaking and that the Federal Reserve could slow tightening from here. Another below expectation inflation reading on December 13th further spurred strong equity markets and declines fixed income yields. Despite being only 50 basis points, the FOMC rate increase on December 14th slowed the recent momentum in markets. Investors will continue to look to Fed policy and inflation readings as key indicators on where markets go from here.
At RMB, we believe there will be continued volatility in both equity and fixed income markets, as the Federal Reserve continues with their plan to increase interest rates in order to mitigate high inflation. This environment of decades high inflation and rising interest rates are putting pressure on global growth. Leading economic indicators have recently turned negative and odds of recession in the next 12 months have increased significantly. The labor market has thus far remained resilient and inflation will probably continue to be sticky for longer than the Fed would like.
We continue to believe that strong fundamentals should help markets over the longer term and that the income component of our client’s investment portfolios – the interest paid from owning bonds and stock dividends – will be a more important factor of investment returns going into the new year. While we think that the longer-term outlook will continue to improve as yields rise and stocks get cheaper, we would caution that 2023 could be another challenging year for stocks globally. Core fixed income remains a key component of client asset allocations to provide diversification and an income component, which can be used as dry powder to tactically take advantage of market opportunities during volatile times. To help weather the short-term volatility we are likely to experience in the coming months, we continue to recommend that clients stick to their long-term investment allocation targets and use the market volatility to their benefit, by taking advantage of rebalancing opportunities to selectively make changes within portfolios. We remain optimistic that the strategies we have in place for our clients will drive long-term success despite the volatility we are currently experiencing.
Citations
1. Bureau of Labor Statistics: https://www.bls.gov/news.release/empsit.toc.html
2. Fed November Minutes: https://www.federalreserve.gov/monetarypolicy/fomccalendars.html
3. T. Rowe Price: https://www.troweprice.com/financial-intermediary/us/en/insights/articles/2022/q3/a-fall-in-earnings-estimates-could-worsen-sell-off.html
4. Bloomberg: https://www.bloomberg.com/news/articles/2022-11-16/us-consumers-stay-resilient-to-fed-hikes-battering-other-sectors#xj4y7vzkg
5. Reuters: https://www.reuters.com/markets/us/us-consumer-spending-solid-october-weekly-jobless-claims-fall-2022-12-01/
6. CNBC: https://www.cnbc.com/2022/12/01/key-inflation-measure-that-the-fed-follows-rose-0point2percent-in-october-less-than-expected-.html
7. Bloomberg: https://www.bloomberg.com/news/articles/2022-11-02/how-a-mysterious-china-screenshot-spurred-a-450-billion-rally#xj4y7vzkg
8. Our World in Data: https://ourworldindata.org/explorers/coronavirus-data-explorer?time=2022-10-31..latest&facet=none&Metric=Confirmed+cases&Interval=7-day+rolling+average&Relative+to+Population=true&Color+by+test+positivity=false&country=~CHN
9. CNN: https://edition.cnn.com/2022/11/26/china/china-protests-xinjiang-fire-shanghai-intl-hnk/index.html
10. CNBC: https://www.cnbc.com/2022/12/01/china-signals-slight-covid-policy-easing-without-any-major-change.html
11. BBC: https://www.bbc.com/news/world-asia-china-43361276
12. NYT: https://www.nytimes.com/2002/11/11/opinion/IHT-chinas-leadership-jiangs-model-for-success.html
13. WSJ: https://www.wsj.com/articles/xi-jinpings-leadership-style-micromanagement-that-leaves-underlings-scrambling-11639582426
14. Bloomberg: https://www.bloomberg.com/news/articles/2022-05-24/xi-s-covid-policy-crosses-a-line-with-invasive-home-disinfection
15. WHO: https://www.who.int/news/item/27-04-2020-who-timeline---covid-19 dec ‘19
16. Bloomberg: https://www.bloomberg.com/news/newsletters/2022-10-17/china-president-xi-jinping-doubles-down-on-covid-zero
17. BBC: https://www.bbc.com/news/59882774
18. CNBC: https://www.cnbc.com/2022/10/24/china-third-quarter-gdp.html
19. CNBC: https://www.cnbc.com/2022/11/07/chinas-exports-shrink-in-october-badly-missing-expectations-for-growth.html
20. CNN: https://edition.cnn.com/2022/11/14/investing/china-real-estate-crisis-over-rescue-plan-intl-hnk/index.html
21. Reuters: https://www.reuters.com/breakingviews/china-property-bailouts-leave-most-out-cold-2022-11-30/
22. CNN: https://edition.cnn.com/2022/07/14/economy/china-property-crisis-homebuyers-bad-debt-intl-hnk
23. Bloomberg: https://www.bloomberg.com/news/articles/2022-10-24/china-home-prices-fall-for-13th-month-as-property-woes-persist#xj4y7vzkg
24. National Bureau of Statistics of China: http://www.stats.gov.cn/english/PressRelease/202211/t20221116_1890350.html
25. CNBC: https://www.cnbc.com/2020/12/01/world-stocks-outperform-the-us-in-bumper-november.html
26. CNBC: https://www.cnbc.com/2022/11/30/euro-zone-inflation-rate-eases-to-10percent-in-november-as-energy-prices-slow.html
27. CNBC: https://www.cnbc.com/2022/11/16/uk-inflation-hits-new-41-year-high-as-food-and-energy-prices-continue-to-soar.html
28. FRED: https://fred.stlouisfed.org/series/T10Y2Y
29. Reuters: https://www.reuters.com/markets/currencies/exclusive-least-1-billion-client-funds-missing-failed-crypto-firm-ftx-sources-2022-11-12/
30. CNBC: https://www.cnbc.com/2022/12/06/chinas-covid-lockdowns-are-having-a-lessening-impact-on-its-economy.html
31. Federal Reserve: FOMC Minutes, November 1-2, 2022 (federalreserve.gov)
Performance Disclosures
All market pricing and performance data from Bloomberg, unless otherwise cited. Asset class and sector performance are gross of fees unless otherwise indicated.
Index Definitions
The S&P 500 Index is widely regarded as the best single gauge of the United States equity market. It includes 500 leading companies in leading industries of the U.S. economy. The S&P 500 focuses on the large cap segment of the market and covers approximately 75% of U.S. equities.
The Bloomberg Barclays U.S. Aggregate Index represents securities that are SEC-registered, taxable, and dollar denominated. The index covers the U.S. investment grade fixed rate bond market, with index components for government and corporate securities, mortgage pass-through securities, and asset-backed securities. Duration is roughly 5 years.
The Bloomberg U.S. Corporate High Yield Bond Index measures the USD-denominated, high yield, fixed-rate corporate bond market. Securities are classified as high yield if the middle rating of Moody’s, Fitch and S&P is Ba1/BB+/BB+ or below. Bonds from issuers with an emerging markets country of risk, based on the indices’ EM country definition, are excluded.
The Russell 1000® Value Index measures the performance of the large-cap value segment of the U.S. equity universe. It includes those Russell 1000 companies with lower price-to-book ratios and lower expected and historical growth rates.
The Russell 1000® Growth Index measures the performance of the large- cap growth segment of the US equity universe. It includes those Russell 1000 companies with relatively higher price-to-book ratios, higher I/B/E/S forecast medium term (2 year) growth and higher sales per share historical growth (5 years).
The Russell 2000® Index measures the performance of the small-cap segment of the US equity universe. It includes approximately 2000 of the smallest US equity securities in the Russell 3000 Index based on a combination of market capitalization and current index membership. The Russell 2000 Index represents approximately 10% of the total market capitalization of the Russell 3000 Index. Because the Russell 2000 serves as a proxy for lower quality, small cap stocks, it provides an appropriate benchmark for RMB Special Situations.
MSCI EAFE Index*: an equity index which captures large and mid-cap representation across 21 of 23 Developed Markets countries around the world, excluding the U.S. and Canada. With 926 constituents, the index covers approximately 85% of the free float-adjusted market capitalization in each country.
The MSCI Emerging Markets Index* measures equity market performance in the global emerging markets universe. It covers over 2,700 securities in 21 markets that are currently classified as EM countries. The MSCI EM Index universe spans large, mid and small cap securities and can be segmented across all styles and sectors.
The U.S. Dollar Index is used to measure the value of the dollar against a basket of six foreign currencies: the euro, Swiss franc, Japanese yen, Canadian dollar, British pound, and Swedish krona.
The Deutsche Bank EM FX Equally Weighted Spot Index, an equal-weighted basket of 21 emerging market currencies.
MSCI U.S. REIT Index is a free float-adjusted market capitalization weighted index that is comprised of equity Real Estate Investment Trusts (REITs). The index is based on the MSCI USA Investable Market Index (IMI), its parent index, which captures the large, mid and small cap segments of the USA market. With 150 constituents, it represents about 99% of the US REIT universe and securities are classified under the Equity REITs Industry (under the Real Estate Sector) according to the Global Industry Classification Standard (GICS®), have core real estate exposure (i.e., only selected Specialized REITs are eligible) and carry REIT tax status.
*Source: MSCI.MSCI makes no express or implied warranties or representations and shall have no liability whatsoever with respect to any MSCI data contained herein. The MSCI data may not be further redistributed or used as a basis for other indexes or any securities or financial products. This report is not approved, endorsed, reviewed or produced by MSCI. None of the MSCI data is intended to constitute investment advice or a recommendation to make (or refrain from making) any kind of investment decision and may not be relied on as such.
All market pricing and performance data from Bloomberg, unless otherwise cited. Asset class and sector performance are gross of fees unless otherwise indicated.
The opinions and analyses expressed in this newsletter are based on RMB Capital Management, LLC’s (“RMB Capital”) research and professional experience are expressed as of the date of our mailing of this newsletter. Certain information expressed represents an assessment at a specific point in time and is not intended to be a forecast or guarantee of future results, nor is it intended to speak to any future time periods. RMB Capital makes no warranty or representation, express or implied, nor does RMB Capital accept any liability, with respect to the information and data set forth herein, and RMB Capital specifically disclaims any duty to update any of the information and data contained in this newsletter. The information and data in this newsletter does not constitute legal, tax, accounting, investment or other professional advice. Returns are presented net of fees. An investment cannot be made directly in an index. The index data assumes reinvestment of all income and does not bear fees, taxes, or transaction costs. The investment strategy and types of securities held by the comparison index may be substantially different from the investment strategy and types of securities held by your account. RMB Asset Management is a division of RMB Capital Management.