


Overview
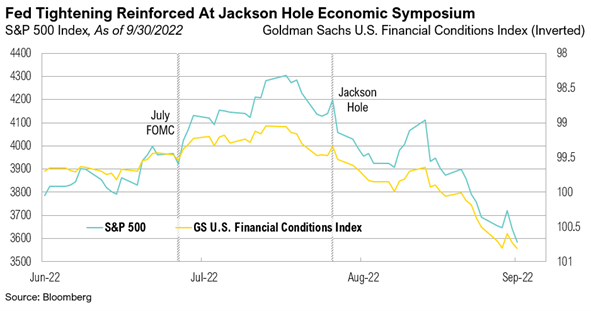
The third quarter was defined by volatile economic data and markets. It began with a furious bear market rally that resulted in the S&P 500 gaining 17% from June 16 to August 16. But the market eventually rolled over and hit new lows to close out the quarter, falling 17% from the mid-August high of the bear market rally that started in June. The Bloomberg U.S. Aggregate Bond Index followed a similar path, gaining 5.6% from June 14 to August 1, before falling 8.1% and making new lows just before the end of the quarter on September 27.
Perhaps more than anything, the event most responsible for the market’s reversal and decline to new lows was the Federal Reserve’s Jackson Hole Economic Symposium, an annual conference that hosts central bankers, policymakers, academics, and economists from around the world to discuss economic issues, implications, and policy options.1 Fed Chair Jerome Powell’s topic this year was supposed to be “reassessing constraints on the economy and policy.” His original speech addressed just that. However, on the heels of rallying markets, easing financial conditions, and increased inflation expectations for July and much of August—the opposite result from what the Fed had been seeking—Powell tore up his original speech and decided to be blunt.2 His 1,301-word speech on August 26 was by far the shortest by a Fed Chair at the Symposium since at least 2010.3 His point hit home—the Fed would not be pivoting on monetary policy anytime soon:
“The Federal Open Market Committee's overarching focus right now is to bring inflation back down to our 2 percent goal. Restoring price stability will take some time and requires using our tools forcefully to bring demand and supply into better balance. While higher interest rates, slower growth, and softer labor market conditions will bring down inflation, they will also bring some pain to households and businesses.” 4
The final sentence from Powell’s quote not only sums up the Fed’s current no-win situation, but it is starkly at odds with the calming voice that markets are used to hearing from central banks during times of turmoil. Nonetheless, it was absolutely necessary as the market rally was further jeopardizing the Fed’s ability to return inflation back to their mandate, and further risking their credibility.
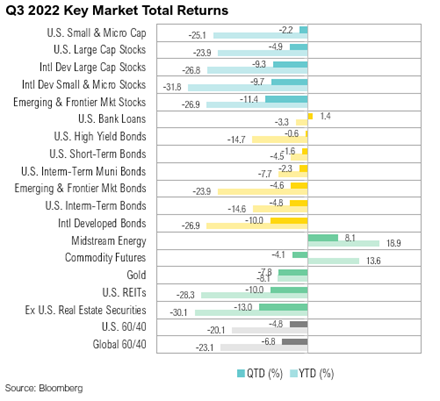
The Fed is attacking inflation with three mallets: raising interest rates, reversing quantitative easing (selling bonds it acquired during its years of quantitative easing), and using its words intentionally. Taken together, these tools are designed to whack asset prices—stocks, bonds, and housing—to create a negative wealth effect, curtail demand, and hopefully bring inflation down. Year-to-date, U.S. stocks are down 24%, and U.S. bonds are down 15%, their worst year ever after posting their fourth worst in 2021. Foreign stocks and bonds are in even worse shape, as global central banks are almost all pursuing similar policies.
Whac-A-Mole
Whac-A-Mole is an arcade game, invented by Kazuo Yamada and first played in Japan in 1975, interestingly, at a time when U.S. inflation averaged a whopping 9.1%.5 A Whac-A-Mole machine consists of a waist-level cabinet with a play area and display screen, as well as a whacking mallet. Five holes in the play area are filled with small, plastic, cartoonish moles, which pop up at random. Points are scored by whacking each mole as it appears. The faster the reaction, the higher the score.6
Initially, the Fed was slow to deal with inflation and passed it off as transitory. But as high inflation has continued, the Fed has been pushed to act more aggressively.7 For now, it appears content to whack stocks and bonds lower, slow the housing market, and weaken the labor market all to win the fight against elevated inflation and restore its credibility. So far, there has been little tangible progress in terms of the labor market or inflation. The unemployment rate currently sits at a fifty-year low of 3.5%.8 The September reading of the Consumer Price Index (“CPI”) shows inflation up 8.2% year-over-year and only down slightly from a high of 9.0% in June. Core CPI, which excludes volatile food and energy components, popped and is now up 6.6%.9 This represents a new cycle high for Core CPI, which means the Fed will keep playing Whac-A-Mole.
The roots of the current inflation trace back to the August 2020 Jackson Hole Economic Symposium. Inflation had remained below the Fed’s stated target for more than a decade (from the Global Financial Crisis in 2008 through the emergence from the COVID-19 crisis). At that meeting, Jerome Powell formally stated that the Fed was moving away from its mandate of a 2% inflation target in favor of average inflation targeting:
“Inflation that is persistently too low can pose serious risks to the economy. We will seek to achieve inflation that averages 2 percent over time. Therefore, following periods when inflation has been running below 2 percent, appropriate monetary policy will likely aim to achieve inflation moderately above 2 percent for some time. Our approach could be viewed as a flexible form of average inflation targeting. The revisions to our statement add up to a robust updating of our monetary policy framework.”10
This was not the first time a Chair of the Fed lamented structurally low inflation. At her final news conference as Fed Chair in December 2017, Janet Yellen made the following statement:
“What’s on my ‘undone’ list, you ask? We have a 2 percent symmetric inflation objective, and, for a number of years now, inflation has been running under 2 percent. And I consider it an important priority to make sure that inflation doesn’t chronically undershoot our 2 percent objective, and I want to see it move up to 2 percent. So most of my colleagues and I do believe that it’s being held down by transitory factors, but there’s work undone there, in the sense—we need to see it move up in line with our objective.”11
To counteract these low levels of inflation, the Fed kept interest rates at 0% and allowed its quantitative easing (QE) program to double in size to $8.4 trillion worth of U.S. Treasury bonds and mortgage-backed securities.12 Even though QE had been in place since the 2008 financial crisis, it was used to an exponentially greater degree to handle the financial consequences of the pandemic, including crashing markets and massive deficits. These asset purchases help ease financial conditions, improve liquidity, and support economic growth via higher asset prices.13
The Fed was slow to react to elevated inflation, which it viewed as transitory. As a result, it maintained its extraordinary accommodation plan into 2022, even when CPI rose to nearly 7% on a year-over-year basis, a thirty-year high, in November 2021. By the time the Fed raised interest rates by 25 basis points in March 2022, CPI had risen to nearly 8%.5 In June, the Fed then introduced quantitative tightening (QT), a reversal of its widescale bond purchases. To date, however, the Fed’s balance sheet has only been trimmed by $158 billion (or 2%), and it remains higher than it was at the start of the year.12 Interest rates have now reached 3.25%, and additional increases are expected.14 As a result of the Fed’s rapid and significant policy shifts, this has now become one of the most aggressive tightening cycles in history.
The Fed has also used its rhetoric strategically this year, especially since the July FOMC meeting. In that meeting’s press conference, what was either a miscommunication by Powell due to an unscripted response or a misunderstanding from a market desperately reaching for good news, a powerful rally materialized that was fueled by hopes that the Fed was close to changing its policy stance.
“I’d start by saying we’ve been saying we would move expeditiously to get to the range of neutral. And I think we’ve done that now. We’re at 2.25 to 2.5 percent, and that’s right in the range of what we think is neutral.” 15
But this was not what the Fed wanted. A rally in risky assets meant that commodity prices went higher, credit markets eased, and growth expectations drifted up, all factors that would intensify, rather than alleviate, inflation. Powell had inadvertently given markets hope that the Fed would pivot more quickly than it intended to. Soon after, Fed officials tried to disabuse investors of their hopes. In an interview with the New York Times two days after Powell’s July FOMC press conference, Minneapolis Fed President Neel Kashkari responded:
“I’m surprised by markets’ interpretation. The committee is united in our determination to get inflation back down to 2 percent, and I think we’re going to continue to do what we need to do until we are convinced that inflation is well on its way back down to 2 percent — and we are a long way away from that. I don’t know what the bond market is looking at in reaching that [pivot] conclusion.” 16
At that point, the Fed could not afford for financial conditions to ease when it was trying diligently to lower inflation. Nonetheless, stocks and bonds continued to rally into August. While the risk-on environment ended just before Jackson Hole, markets turned decidedly lower after the no-pivot speech by Powell on August 26. The Fed had not been pleased by the market rally, and it welcomed the market downturn, as Kashkari emphasized soon after Jackson Hole:
“I certainly was not excited to see the stock market rallying after our last Federal Open Market Committee meeting, because I know how committed we all are to getting inflation down. And I somehow think the markets were misunderstanding that. So, I was actually happy to see how Chair Powell’s Jackson Hole speech was received, people now understand the seriousness of our commitment to getting inflation back down to 2%.” 17
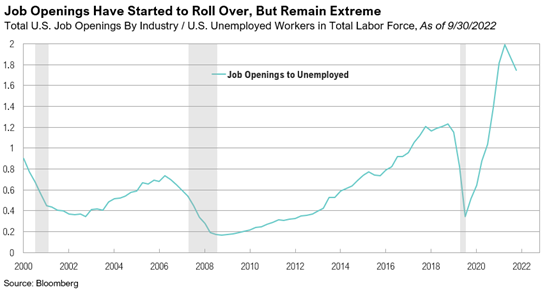
The Fed is still in a box. The backwards-looking labor market is tight, and the tools at its disposal are blunt because they can only impact demand. The Fed cannot print more workers, houses, or gasoline. It can only address inflation by reducing demand. In particular, the Fed is trying to bring labor supply and demand back into balance, according to Powell’s comments in March:
“Well, if you take a look at today’s labor market, what you have is 1.7 plus job openings for every unemployed person. So that’s a very, very tight labor market tight to an unhealthy level, I would say.”18
Signs indicate that the Fed may be making modest progress on whacking the labor market. Last month, job openings decreased by 1.1 million. Moves of that size are not common. Since 2000, drops of more than 1 million job openings occurred only twice—in March and April of 2020.19 However, given that the unemployment rate today sits at 3.5% and is barely off its historic lows, the Fed has more work yet to do.
The Bank of England’s Pivot
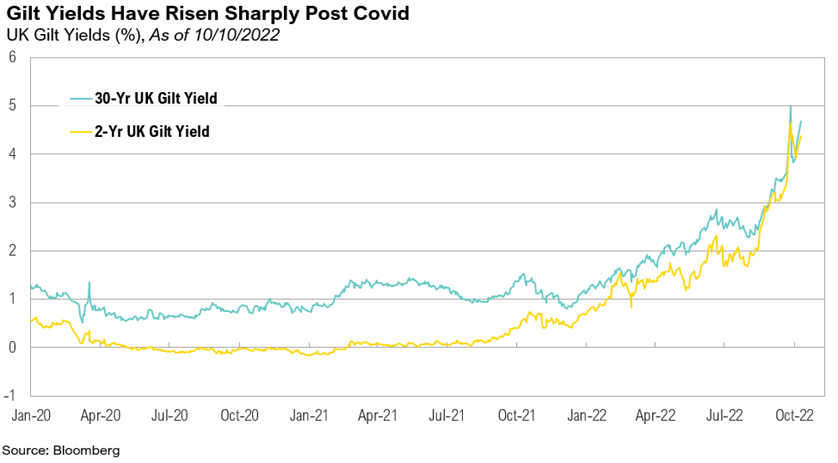
While in the U.S., the Fed has attempted to stay the course, the UK has been recently forced into a different approach. The Bank of England (BoE) needed to pivot on its monetary policy due to an ill-timed policy blunder. For most of the quarter, the BoE had been acting similarly to the Fed and sought to tighten monetary policy to deal with inflation. The BoE started raising interest rates earlier than the Fed but hadn’t hiked rates as aggressively. Then, on September 23, the British government announced its largest tax cut plan in 50 years.20 The cuts would be funded primarily by government borrowing and were projected to cost over £150 billion, equivalent to $167 billion, over several years. The government said it would borrow £72.4 billion in the short term, but overall borrowing in the next five years was estimated to reach approximately £300 billion.20 The news caused anxiety in the UK government bond (gilts) markets over concerns about the impact on inflation and interest rates as well as the longer-term sustainability of UK finances. On September 26 and 27, the first two trading days after the announcement, the thirty-year gilt yield rose 95 basis points to 4.99%, a stunning move for what is supposed to be a low-risk government bond.
The surge in yields forced pension funds, who hold large, and often-leveraged portions of both gilts themselves and swaps on their yields, to raise cash in order to post collateral on the swaps. As gilts are some of the largest positions held by these funds and are more liquid than most investments, these funds had to sell gilts to raise cash, forcing the prices even further downward in a self-reinforcing cycle.21
To stop that cycle and prevent pensions from defaulting, the BoE stepped in on September 28, announcing that it would make temporary purchases of long-dated gilts at an “urgent pace on whatever scale is necessary to… restore orderly market conditions.” The comments acknowledged that “were dysfunction in this market to continue or worsen, there would be a material risk to UK financial stability.” 22 After the announcement, thirty-year gilt yields dropped 106 basis points on September 28 to 3.93%. Through early October, thirty-year gilt yields have climbed back up to 4.91%.
In response to the turmoil in the UK, Fed officials remained undeterred. On October 6, Fed Governor Christopher Waller debunked myths that U.S. rate hikes might soon be halted:
“In considering what might happen to alter my expectations about the path of policy, I've read some speculation recently that financial stability concerns could possibly lead the FOMC to slow rate increases or halt them earlier than expected. Let me be clear that this is not something I'm considering or believe to be a very likely development.” 23
On the same day, Minneapolis Fed President Neel Kashkari reiterated his support for higher interest rates, even if they hurt the broader economy:
“I fully expect that there are going to be some losses and there are going to be some failures around the global economy as we transition to a higher-interest rate environment, and that’s the nature of capitalism.” 24
Markets
The S&P 500 Index fell 4.9% in the third quarter, sending the index back into bear market territory. From a style perspective, large cap value stocks outperformed large cap growth stocks, as the Russell 1000 Value Index fell 3.6% while the Russell 1000 Growth Index fell 5.6%. Small cap outperformed large cap, with the Russell 2000 returning -2.2%, largely driven by small cap growth outperforming small cap value, +0.2% versus -4.6%.
From a sector perspective, energy was among the only bright spots, returning 2.3%, despite West Texas Intermediate crude oil falling from $108 to $79 per barrel over the quarter. Real estate continued to struggle in the rising interest rate environment, losing 11% over the quarter. Communication services was the only sector to perform worse, down 12.7%. Despite this dramatic market sell-off, valuations for the S&P 500 are still not cheap compared to history. The Shiller Price/Earnings Ratio, a commonly referenced measure of valuation, measured 28.5 at the end of September, which is at the 74th percentile over the last twenty years and above the twenty-year median of 25.9.25
Stocks outside of the U.S. trailed their U.S. counterparts during the quarter, primarily because of the strong U.S. dollar, which gained 7.1% over the quarter. Foreign developed market equity returns, as measured by the MSCI EAFE Index, fell 9.7% in U.S. dollar terms. The MSCI Emerging Markets Index fared even worse, down 11.4% in U.S. dollar terms.
Within fixed income, U.S. taxable bonds—as proxied by the Bloomberg U.S. Aggregate Bond Index—again failed to offer meaningful diversification over the quarter, losing 4.8%. The 10-Year Treasury yield peaked at 3.95% on June 27, its highest yield since April 2010. Credit spreads narrowed throughout the quarter, leading high-yield bonds to outperform their investment-grade counterparts, which were down 0.6%, as proxied by the Bloomberg U.S. High Yield Bond Index. The option-adjusted spread for the high yield index dropped from 587 at the beginning of the quarter to 543 basis points by the end. Due to both the strengthening U.S. dollar and European bond market turmoil, developed market bonds underperformed, down 10% over the quarter, as measured by the S&P International Sovereign ex-U.S. Bond Index.
Looking Forward
While void of fun for most markets, 2022 has had all of the frantic movement and mallet hits of an arcade game. Throughout the turmoil, one theme has remained dominant—global inflation is much too high and has yet to show signs of meaningfully receding. It is important to remember the lag between monetary policy changes and their intended effects. As a result, inflation may in fact be on the decline, but it remains unclear how quickly it will recede and how low it will go. The answers to these questions will have dramatic implications for the markets. Outlooks must acknowledge a great deal of uncertainty, especially as long as central bankers wield their mallets.
While we remain cautious, we increasingly believe that attractive investment opportunities could pop up at any moment. We are also cognizant that the Fed has a mandate to support financial stability, and, like the Bank of England, it could change course to pursue this objective. This might seem unlikely since stocks aren’t even near trough valuations and credit spreads remain tame, however, should the Fed intervene for financial stability reasons, it would change the rules of the game and would significantly affect markets:
“Promoting financial stability is a key element in meeting the Federal Reserve’s dual mandate for monetary policy regarding full employment and stable prices. In an unstable financial system, adverse events are more likely to result in severe financial stress and disrupt the flow of credit, leading to high unemployment and great financial hardship.”26
At RMB, we believe there will be continued volatility in both equity and fixed income markets, as the Federal Reserve continues with their plan to increase interest rates in order to mitigate high inflation. We feel that fundamentals will be a key driver of markets over the longer term but the risks in the short-term are continuing to rise. While earnings growth estimates remain positive, we are starting to see signs of that growth slowing down, as companies are grappling with continued headwinds such as high inflation, supply chain disruptions, and labor. We continue to believe that the income component of our client investment portfolios – the interest paid from owning bonds and stock dividends – will be a more important factor of investment returns going forward. To help weather the on-going volatility we are likely to experience in the coming months, we continue to recommend that clients stick to their long-term investment allocation targets and use the market volatility to their benefit by taking advantage of relative value and rebalancing opportunities to selectively make changes within portfolios. During volatile times, the key to successful investing is often remaining calm and committed to long-term investment plans. We remain optimistic that the strategies we have in place for our clients will drive long-term success, despite the volatility we are currently experiencing.
Citations
1. Kansas City Fed: https://www.kansascityfed.org/research/jackson-hole-economic-symposium/
2. WSJ: https://www.wsj.com/articles/jerome-powell-inflation-volcker-fed-11663595217
3. WSJ: https://www.wsj.com/livecoverage/stock-market-news-today-08-26-2022/card/powell-s-speech-was-shortest-jackson-hole-address-since-at-least-2010-oYztL509bDqHQMQODQPc
4. Jackson Hole 2022: https://www.federalreserve.gov/newsevents/speech/powell20220826a.htm
5. FRED: https://fred.stlouisfed.org/series/CPIAUCSL#
6. Wikipedia: https://en.wikipedia.org/wiki/Whac-A-Mole
7. Forbes: https://www.forbes.com/advisor/investing/transitory-inflation/#:~:text=Transitory%20inflation%20is%20a%20term,the%20Covid%2D19%20economic%20crisis
8. U.S. Bureau of Labor Statistics: https://www.bls.gov/news.release/empsit.nr0.htm
9. U.S. Bureau of Labor Statistics: https://www.bls.gov/news.release/cpi.nr0.htm
10. Jackson Hole 2020: https://www.federalreserve.gov/newsevents/speech/powell20200827a.htm
11. Yellen Conference: https://www.federalreserve.gov/mediacenter/files/fomcpresconf20171213.pdf
12. Federal Reserve: https://www.federalreserve.gov/monetarypolicy/bst_recenttrends.htm
13. Federal Reserve: https://www.federalreserve.gov/monetarypolicy/monetary-policy-what-are-its-goals-how-does-it-work.htm
14. CME Group: https://www.cmegroup.com/trading/interest-rates/countdown-to-fomc.html
15. Federal Reserve: https://www.federalreserve.gov/mediacenter/files/FOMCpresconf20220727.pdf
16. NY Times: https://www.nytimes.com/2022/07/29/business/economy/neel-kashkari-federal-reserve.html
17. Bloomberg: https://www.bloomberg.com/news/articles/2022-08-29/neel-kashkari-happy-to-see-the-stock-market-s-reaction-to-jackson-hole
18. Federal Reserve: https://www.federalreserve.gov/mediacenter/files/FOMCpresconf20220316.pdf
19. FRED: https://fred.stlouisfed.org/series/JTSJOL#0
20. WSJ: https://www.wsj.com/articles/u-k-announces-package-of-sweeping-tax-cuts-11663926079?mod=article_inline
21. Financial Times: https://www.ft.com/content/f4a728a5-0179-48bd-b292-f48e30f8603c?location=https%3A%2F%2Fwww.ft.com&multistepRegForm=multistep
22. Bank of England: https://www.bankofengland.co.uk/news/2022/september/bank-of-england-announces-gilt-market-operation
23. Waller Comments: https://www.federalreserve.gov/newsevents/speech/waller20221006a.htm
24. Kashkari Gilts:https://www.bloomberg.com/news/articles/2022-10-06/kashkari-says-fed-has-more-work-to-do-to-bring-inflation-down
25. Yale: http://www.econ.yale.edu/~shiller/data.htm
26. Federal Reserve: https://www.federalreserve.gov/publications/2022-may-financial-stability-report-purpose.htm
Index Definitions
The S&P 500 Index is widely regarded as the best single gauge of the United States equity market. It includes 500 leading companies in leading industries of the U.S. economy. The S&P 500 focuses on the large cap segment of the market and covers approximately 75% of U.S. equities.
The Bloomberg Barclays U.S. Aggregate Index represents securities that are SEC-registered, taxable, and dollar denominated. The index covers the U.S. investment grade fixed rate bond market, with index components for government and corporate securities, mortgage pass-through securities, and asset-backed securities. Duration is roughly 5 years.
The Bloomberg U.S. Corporate High Yield Bond Index measures the USD-denominated, high yield, fixed-rate corporate bond market. Securities are classified as high yield if the middle rating of Moody’s, Fitch and S&P is Ba1/BB+/BB+ or below. Bonds from issuers with an emerging markets country of risk, based on the indices’ EM country definition, are excluded.
The Russell 1000® Value Index measures the performance of the large-cap value segment of the U.S. equity universe. It includes those Russell 1000 companies with lower price-to-book ratios and lower expected and historical growth rates.
The Russell 1000® Growth Index measures the performance of the large- cap growth segment of the US equity universe. It includes those Russell 1000 companies with relatively higher price-to-book ratios, higher I/B/E/S forecast medium term (2 year) growth and higher sales per share historical growth (5 years).
The Russell 2000® Index measures the performance of the small-cap segment of the US equity universe. It includes approximately 2000 of the smallest US equity securities in the Russell 3000 Index based on a combination of market capitalization and current index membership. The Russell 2000 Index represents approximately 10% of the total market capitalization of the Russell 3000 Index. Because the Russell 2000 serves as a proxy for lower quality, small cap stocks, it provides an appropriate benchmark for RMB Special Situations.
MSCI EAFE Index*: an equity index which captures large and mid-cap representation across 21 of 23 Developed Markets countries around the world, excluding the U.S. and Canada. With 926 constituents, the index covers approximately 85% of the free float-adjusted market capitalization in each country.
The MSCI Emerging Markets Index* measures equity market performance in the global emerging markets universe. It covers over 2,700 securities in 21 markets that are currently classified as EM countries. The MSCI EM Index universe spans large, mid and small cap securities and can be segmented across all styles and sectors.
The U.S. Dollar Index is used to measure the value of the dollar against a basket of six foreign currencies: the euro, Swiss franc, Japanese yen, Canadian dollar, British pound, and Swedish krona.
The Deutsche Bank EM FX Equally Weighted Spot Index, an equal-weighted basket of 21 emerging market currencies.
MSCI U.S. REIT Index is a free float-adjusted market capitalization weighted index that is comprised of equity Real Estate Investment Trusts (REITs). The index is based on the MSCI USA Investable Market Index (IMI), its parent index, which captures the large, mid and small cap segments of the USA market. With 150 constituents, it represents about 99% of the US REIT universe and securities are classified under the Equity REITs Industry (under the Real Estate Sector) according to the Global Industry Classification Standard (GICS®), have core real estate exposure (i.e., only selected Specialized REITs are eligible) and carry REIT tax status.
*Source: MSCI.MSCI makes no express or implied warranties or representations and shall have no liability whatsoever with respect to any MSCI data contained herein. The MSCI data may not be further redistributed or used as a basis for other indexes or any securities or financial products. This report is not approved, endorsed, reviewed or produced by MSCI. None of the MSCI data is intended to constitute investment advice or a recommendation to make (or refrain from making) any kind of investment decision and may not be relied on as such.
Performance Disclosures
All market pricing and performance data from Bloomberg, unless otherwise cited. Asset class and sector performance are gross of fees unless otherwise indicated.