


Key Takeaways
- The S&P 500 ended September down 3.3%, reinforcing September’s reputation as the worst month of the year for stocks.
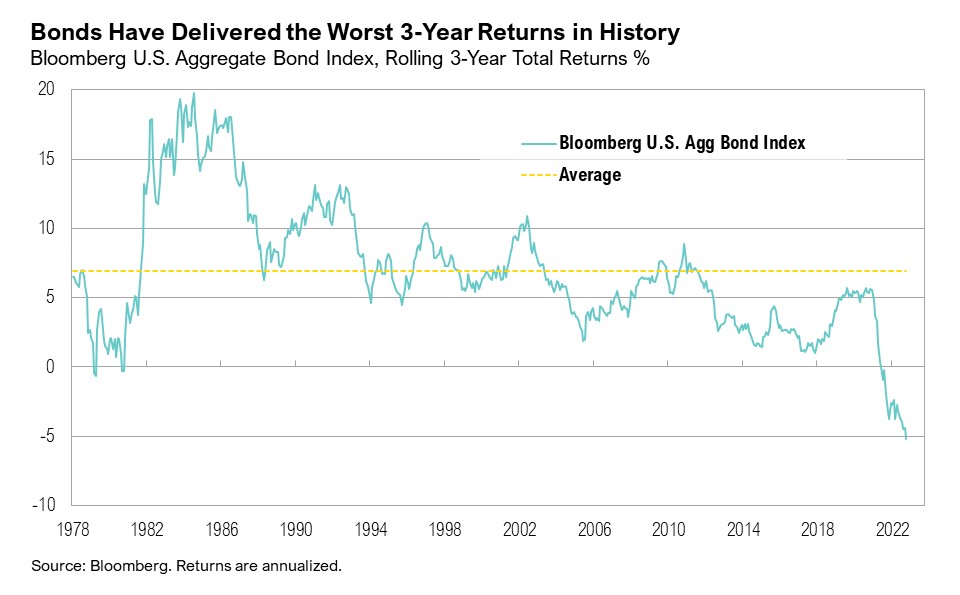
- The Bloomberg U.S. Aggregate Bond Index, which ended the quarter down 3.2%, is down 15% over the past three years in the largest three-year decline in history.
- Strategic Petroleum Reserve inventories are at a 40-year low, the U.S. government deficit is swelling, and household pandemic-related savings are drained for most households, hinting at economic challenges ahead.
- Looking forward, the good news is that interest rates are higher and opportunities are emerging, meaning investors do not need to stretch for reasonable returns.
Overview
The quarter started with a bang and ended with a whimper. The first and last months of the third quarter have historically been stand-out months when it comes to stock performance—albeit for different reasons. July, historically the best month of the year for stocks, followed suit this year and the S&P 500 Index ended up 3.2%. In contrast, in September, historically the worst month of the year for stocks, they declined 3.3%. The rally in the Magnificent Seven stocks (a collective term used to describe mega-cap tech companies Apple, Amazon, Microsoft, Nvidia, Meta, Tesla, and Alphabet) has carried the entire stock market in 2023. The S&P 500 is up an impressive 13.1% year to date, but without the Magnificent Seven, the so-called “S&P 493” is up only approximately 5%.1 Despite all of that, if the quarter is remembered for anything, it will be for the relentless rise in interest rates, which caused bonds to languish. The Bloomberg U.S. Aggregate Bond Index ended the quarter down 3.2% and is now down 1.2% for the year to date. The index is down 15.0% over the past three years—by far the largest three-year decline in history.
Drained
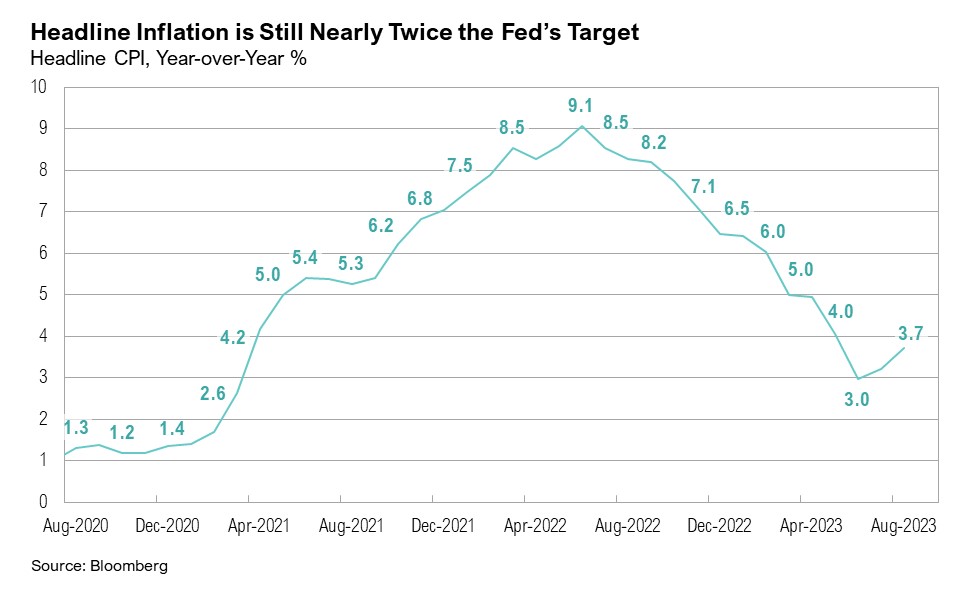
In a distinct positive for markets and the economy, headline inflation has subsided from a peak of 9.1% year-over-year in June 2022 to 3.7% year-over-year in August 2023. However, this does not mean inflation has been beaten. After bottoming at 3.0% year-over-year in June this year, headline CPI increased to 3.2% in July and ticked up again to 3.7% in August, suggesting the “easy-to-beat” inflation numbers may be behind us.2 The Federal Reserve remains stuck in a challenging predicament. To calm markets, the Fed hopes to drain excesses from the economy and ultimately bring inflation down to its 2% target, but this is not proving to be an easy task.
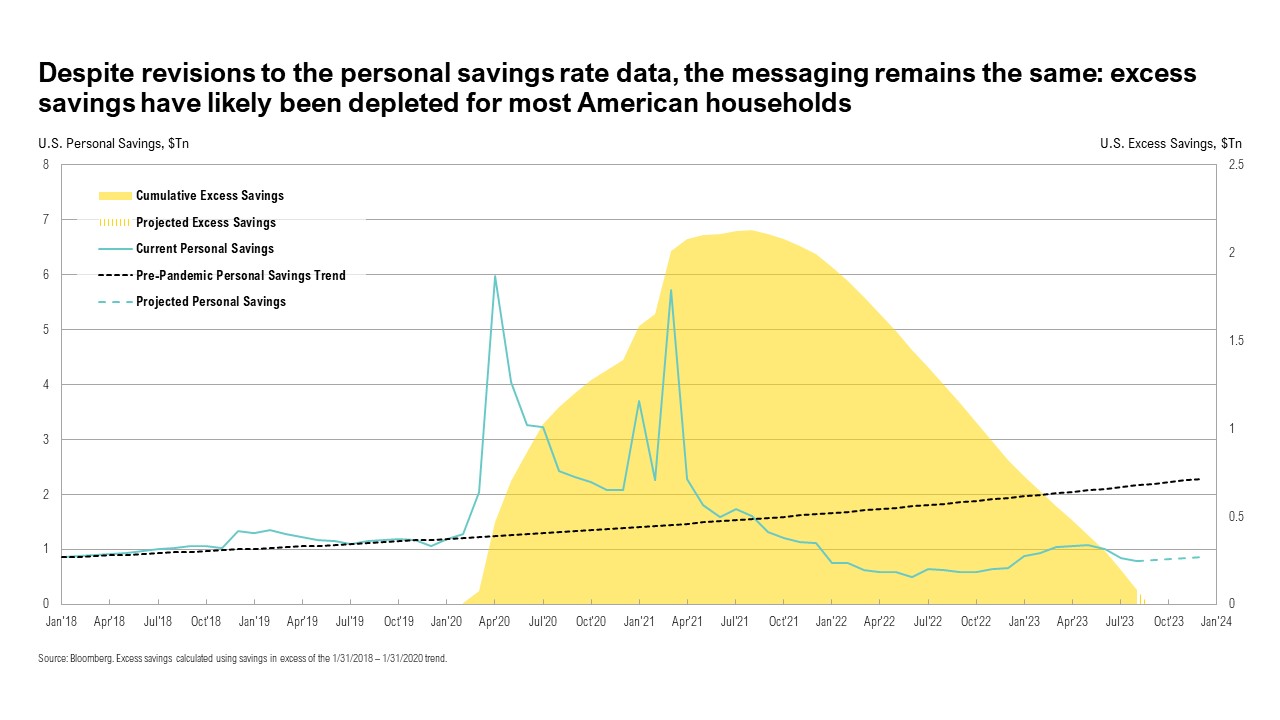
U.S. consumers remained resilient throughout the third quarter. Consumer spending increased by 5.5% year-over-year in August, and retail sales increased by 1.6% year-over-year in August.3,4 However, spending has been boosted by consumers draining their pandemic-related savings. This has been corroborated by studies from the San Francisco Fed, the Fed’s Beige Book report, and JP Morgan.5,6,7 Taken together, these estimates suggest that for the bottom 80% of U.S. households, real household savings are below March 2020 levels.8 Further evidence of the drained savings buffer of the average U.S. household can be found in the drop in the U.S. Savings Rate, which declined from 4.9% in June to 3.9% in August—well below the historical average of 8.9% since 1952.9 Another issue facing consumers is the resumption of loan payments on student debt in October after interest started accruing on September 1.10
There was a dramatic spike in bond yields last quarter to some of the highest levels of the past two decades. After starting the quarter at 3.8%, the 10-year Treasury yield ended the quarter at 4.6%, a level last reached in August 2007. Short-term Treasury yields also climbed to their highest levels since 2001. The 2-year Treasury yield started the quarter at 4.9% and finished the quarter marginally higher at 5.0%.
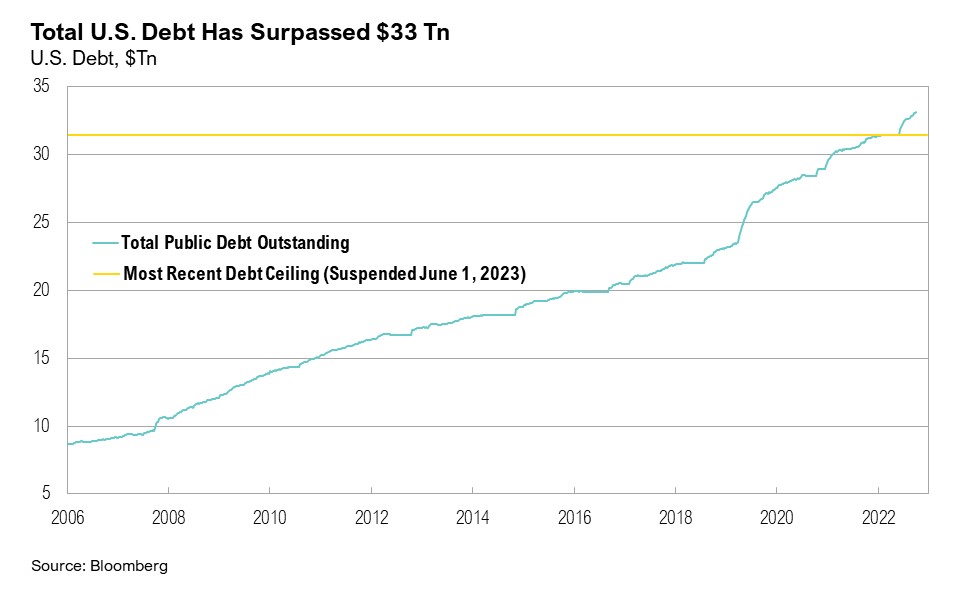
Although the modest reacceleration in inflation may have been a factor, the larger issue was likely the enormous jump in the supply of bonds needed to fund unrestrained fiscal spending. This has kept fiscal governance, or rather the lack thereof, in the spotlight. On August 1, ratings agency Fitch downgraded the U.S. from AAA to AA+, citing concerns about fiscal governance and a growing government debt burden.11 Through the first eleven months of fiscal year 2023 the U.S. deficit has risen to $1.52 trillion, already surpassing the $1.38 trillion deficit from the full twelve months of fiscal 2022.12
High levels of spending have been further exacerbated by large spending programs running ahead of budget. The Inflation Reduction Act, passed in August 2022, was aimed at reducing carbon emissions, lowering healthcare costs, and improving taxpayer compliance.13 According to the Penn-Wharton Budget Model, the cost of this piece of legislation is running almost three times greater than the amount appropriated by Congress.14 Similarly, the Employee Retention Credit (ERC), a refundable tax credit for businesses and employees affected during the pandemic that formed part of the March 2020 CARES Act, has been halted. After paying out more than $230 billion over the past two years, the IRS stopped issuing ERCs on September 14, citing rampant fraud.15,16,17
The net effect of high deficits and overspending has been a draining of government coffers. The U.S. Treasury Department issued a mammoth amount of debt approximately $1.0 trillion in the third quarter.18 Since the debt ceiling resolution on June 1, the Treasury has issued $1.3 trillion, and the Treasury is estimated to borrow an additional $852 billion over the fourth quarter of 2023.18 Total U.S. debt now surpasses $33 trillion.19 This exorbitant spending spree, while positive for growth (and corporate revenues) in the short term, has consequences for the future, and it could serve to hinder the government’s ability to step in to support the economy in the next recession.
Following a two-month hiatus, the Federal Open Market Committee (FOMC) met on September 20, keeping interest rates unchanged at 5.25% to 5.50%.18 Any lingering hopes of a possible rate cut before year end have also faded away. With inflation still nearly double the Fed’s target rate, the Federal Reserve and markets now anticipate the first rate cut only in mid-2024.20,21
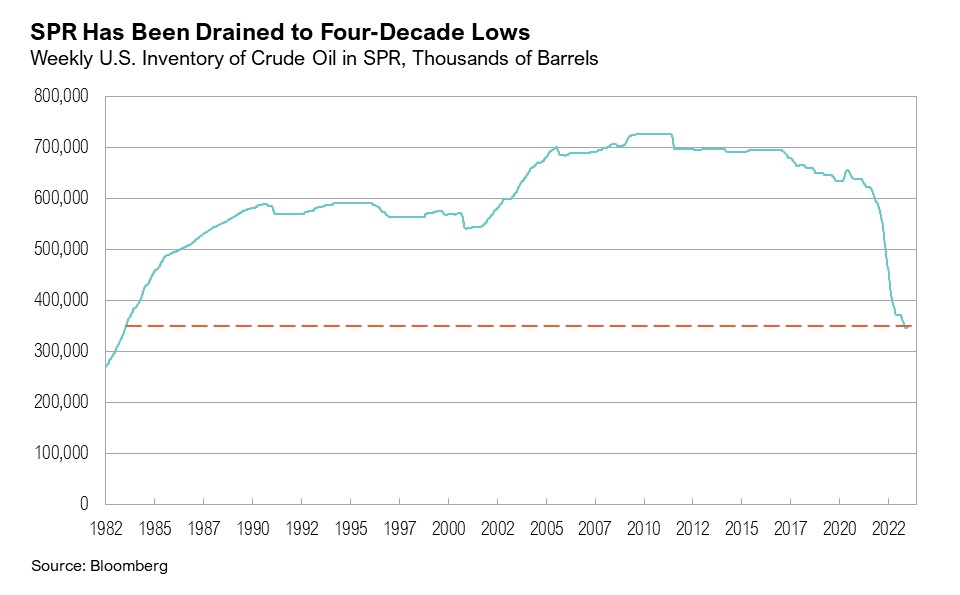
Since June 2022, declining oil prices (down 3.6% year-over-year in August) have played a major role in the decline in overall inflation. This decline was helped by the Biden Administration’s decision to release oil from the U.S. Strategic Petroleum Reserve (SPR).22 Since January 2022, 180 million barrels of crude oil have been taken out of the SPR, resulting in the largest-ever continuous release from the SPR without replenishment, draining SPR inventories to a four-decade low. By the end of the third quarter, the SPR held around 351 million barrels of crude oil, translating to about seventeen days’ worth of U.S. consumption, the lowest level since August 1983.23,24 At its peak in 2011, the SPR held more than 726 million barrels.23
The SPR plays an important role in U.S. energy security and the government’s ability to mitigate supply disruptions and price volatility. In January 2022, when the government started to gradually release oil from the SPR, the Biden administration’s initial plan had been to replenish the SPR when the global price of crude oil reached favorable levels.22 However, increased demand and low inventories have driven the price of West Texas Intermediate crude oil (WTI) higher recently. WTI ended September back above $90/barrel—the same level as August 2022. At current prices, it would cost the government about $21 billion to refill the SPR to the historically average levels of 600 million barrels since 1982.23 All else equal, these low levels of strategic reserves increase the risks of inflationary energy price shocks in the future.
In September, the average national gas prices reached the highest monthly level since 2019, hitting $3.85 per gallon on September 14.25 Elevated gas prices were one of the key factors of the strong August retail sales print, as spending on gas increased by more than 5.0% from July to August.26
Amid the interplay of positive and negative news, U.S. consumer optimism appears to be draining. This is evidenced by the Conference Board’s Consumer Confidence Index, which dipped to 103 in September, down from 109 in August, on concerns of higher prices and interest rates.27
Markets
Most asset classes ended the quarter down. Midstream energy was the top-performing asset class over the quarter, up 9.7%, followed by the Bloomberg Commodity Index, which ended the quarter up 4.7%. The worst performers were asset classes most tethered to rising yields. U.S. REITs plunged 7.0%, and international developed market bonds lost 5.5%. In a similar vein, rate-sensitive utility stocks declined 9.2% over the quarter, while the top-performing U.S. equity sector was energy, up 5.0%.
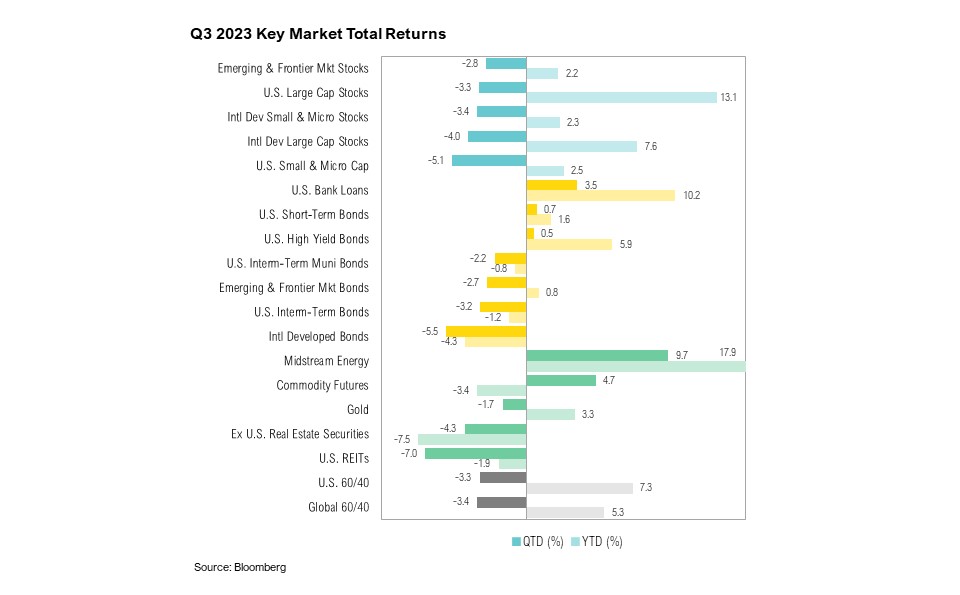
In foreign markets, a stronger dollar, surging U.S. yields, and China’s continued sluggish economic recovery all weighed on investor sentiment. Emerging and frontier market stocks ended the third quarter down 2.8%, wiping out most of their gains for the year. International developed market stocks fared worse than their U.S. counterparts, and the MSCI EAFE ended the quarter down 4.0%.
Looking Forward
Excessive levels of fiscal spending may have been desired by markets during pandemic shutdowns, but they are at best unnecessary and at worst irresponsible in an already overheated economy. While the short-term jolt to economic growth may feel helpful, the lingering inflationary pressure on the economy and increasingly negative market reaction to increased bond issuance may be offsetting any benefit. By stoking inflation, fiscal spending is forcing the Fed to keep short-term interest rates elevated for longer, and the increased Treasury issuance is putting upwards pressure on longer-term rates, too. It is this feedback loop that we think investors need to pay careful attention to in the coming quarters.
Though SPR inventories being at 40-year lows, swelling government deficits, and drained pandemic-related savings all hint at economic challenges ahead, the draining we are most concerned with is investors’ patience with the stock market. As of the end of September, it has been 635 days since the stock market hit a new high. Further, with the sharp move higher in interest rates, the allure of potentially higher returns from risky assets is being undermined by an increasingly competitive alternative. As of the end of September, a so-called “balanced portfolio” of 60% global stocks and 40% bonds yielded 3.3%, but that was still less than the yield of a 2-year Treasury at 5.1%.
The other aspect of the negative feedback loop from higher interest rates has to do with the relationship between interest rates and price-to-earnings multiples (the value assigned by investors to each dollar of earnings) for the stock market. Proxied by the S&P 500 Index, a dollar of earnings in the stock market at the end of 2021, when interest rates were near 0% and inflation was believed to be contained, was valued at around $24.7 (down from a peak of $30.8 in February 2021). But for a decade-long period in the 1970s, when inflation and bond yields were much higher, the same dollar of earnings was valued at an average of just $12.7.
Even though lower prices have made certain parts of the market more compelling and we have been actively looking for openings to reposition portfolios in response to shifting market opportunities, we still believe patience is crucial before significantly raising allocations to risky assets. Fortunately, investors continue to get paid to hold core fixed income investments, including short-term bonds and/or cash, while we wait to see how this all plays out in the coming months.
To clarify, we don’t view higher interest rates as inherently bad. In fact, we welcome them. For patient investors, higher rates may catalyze the unwinding of excesses across the economy and markets, laying the foundation for a more organic and sustainable economic expansion. To echo the words of Sheila Bair, former FDIC chair:
“Please review the last several decades and you will see stronger economic growth occurring when interest rates were higher than they are today. Low productivity, wealth inequality, increased corporate concentration, excessive leverage, financial instability, rampant speculation—these are all enabled by ultra-low rates… Truly promising innovations will attract capital. They always do. And with higher rates, they won’t have to compete with … “innovations” that have been able to attract investment dollars because of [zero interest rates].”28
We believe there will be continued volatility in equity and fixed income markets, as the US economy has been gradually slowing and recession risks remain elevated through 2024. The Federal Reserve is still aiming for their soft-landing goal while the U.S. economy and markets grapple with mixed economic data. Both stock and bond markets have recently been adjusting to expectations for inflation and interest rates to remain higher for longer. We continue to favor both high quality stocks and bonds, rather than being overly aggressive with opportunities in lower quality assets. Short-term bonds remain attractive, but investors should be prepared for changes to the yield curve over the next 12 months. We advise caution as both bull and bear market scenarios are possible from this point. Our goal is to be prepared for either outcome. During volatile times, we believe the key to successful investing is to remain committed to long-term investment plans. A high-quality diversified asset allocation remains the best approach to navigating uncertainty in the year ahead.
Citations
- Apollo Academy: https://apolloacademy.com/sp493-is-basically-flat-this-year/
- Bureau of Labor Statistics: https://www.bls.gov/cpi/
- FRED: https://fred.stlouisfed.org/series/PCE#0
- FRED: https://fred.stlouisfed.org/series/RSXFS
- San Franciso Federal Reserve: https://www.frbsf.org/our-district/about/sf-fed-blog/excess-no-more-dwindling-pandemic-savings/
- Federal Reserve: https://www.federalreserve.gov/monetarypolicy/files/BeigeBook_20230906.pdf
- JPMorgan via Yahoo Finance: https://finance.yahoo.com/news/consumers-spent-excess-savings-pandemic-203001683.html
- Bloomberg: https://www.bloomberg.com/news/articles/2023-09-25/only-richest-20-of-americans-still-have-excess-pandemic-savings
- FRED: https://fred.stlouisfed.org/series/PSAVERT
- CNBC: https://www.cnbc.com/2023/10/01/how-the-restart-of-student-loan-payments-could-shake-the-economy.html
- Fitch: https://www.fitchratings.com/research/sovereigns/fitch-downgrades-united-states-long-term-ratings-to-aa-from-aaa-outlook-stable-01-08-2023
- U.S. Treasury: https://fiscaldata.treasury.gov/americas-finance-guide/national-deficit/
- McKinsey: https://www.mckinsey.com/industries/public-sector/our-insights/the-inflation-reduction-act-heres-whats-in-it
- Penn Wharton: https://budgetmodel.wharton.upenn.edu/estimates/2023/4/27/update-cost-climate-and-energy-inflation-reduction-act
- IRS: https://www.irs.gov/coronavirus/employee-retention-credit
- Yahoo Finance: https://finance.yahoo.com/video/one-tax-credit-may-fueling-215840010.html
- Wall Street Journal: https://www.wsj.com/politics/policy/irs-shuts-door-on-new-pandemic-tax-credit-claims-until-at-least-2024-e06bdef
- U.S. Treasury: https://home.treasury.gov/news/press-releases/jy1662
- U.S. Treasury: https://fiscaldata.treasury.gov/americas-finance-guide/national-debt/
- Federal Reserve: https://www.federalreserve.gov/monetarypolicy/fomcpresconf20230920.htm
- CME FedWatch: https://www.cmegroup.com/markets/interest-rates/cme-fedwatch-tool.html
- American Petroleum Institute: https://www.api.org/news-policy-and-issues/blog/2023/06/29/the-road-to-refilling-the-strategic-petroleum-reserve
- EIA: https://www.eia.gov/dnav/pet/hist/LeafHandler.ashx?n=PET&s=WCSSTUS1&f=W
- Reuters: https://www.reuters.com/markets/global-markets-wrapup-1-2023-09-28/
- AAA: https://gasprices.aaa.com/
- Axios: https://www.axios.com/2023/09/14/august-retail-sales-consumer-spending
- Conference Board: https://www.conference-board.org/topics/consumer-confidence
- Sheila Bair via X: https://twitter.com/SheilaBair2013/status/1708913878711611712
Index Definitions
The S&P 500 Index is widely regarded as the best single gauge of the United States equity market. It includes 500 leading companies in leading industries of the U.S. economy. The S&P 500 focuses on the large cap segment of the market and covers approximately 75% of U.S. equities.
The Bloomberg Barclays U.S. Aggregate Index represents securities that are SEC-registered, taxable, and dollar denominated. The index covers the U.S. investment grade fixed rate bond market, with index components for government and corporate securities, mortgage pass-through securities, and asset-backed securities. Duration is roughly 5 years.
The Bloomberg U.S. Corporate High Yield Bond Index measures the USD-denominated, high yield, fixed-rate corporate bond market. Securities are classified as high yield if the middle rating of Moody’s, Fitch and S&P is Ba1/BB+/BB+ or below. Bonds from issuers with an emerging markets country of risk, based on the indices’ EM country definition, are excluded.
The Russell 1000® Value Index measures the performance of the large-cap value segment of the U.S. equity universe. It includes those Russell 1000 companies with lower price-to-book ratios and lower expected and historical growth rates.
The Russell 1000® Growth Index measures the performance of the large- cap growth segment of the US equity universe. It includes those Russell 1000 companies with relatively higher price-to-book ratios, higher I/B/E/S forecast medium term (2 year) growth and higher sales per share historical growth (5 years).
The Russell 2000® Index measures the performance of the small-cap segment of the US equity universe. It includes approximately 2000 of the smallest US equity securities in the Russell 3000 Index based on a combination of market capitalization and current index membership. The Russell 2000 Index represents approximately 10% of the total market capitalization of the Russell 3000 Index. Because the Russell 2000 serves as a proxy for lower quality, small cap stocks, it provides an appropriate benchmark for RMB Special Situations.
MSCI EAFE Index*: an equity index which captures large and mid-cap representation across 21 of 23 Developed Markets countries around the world, excluding the U.S. and Canada. With 926 constituents, the index covers approximately 85% of the free float-adjusted market capitalization in each country.
The MSCI Emerging Markets Index* measures equity market performance in the global emerging markets universe. It covers over 2,700 securities in 21 markets that are currently classified as EM countries. The MSCI EM Index universe spans large, mid and small cap securities and can be segmented across all styles and sectors.
The U.S. Dollar Index is used to measure the value of the dollar against a basket of six foreign currencies: the euro, Swiss franc, Japanese yen, Canadian dollar, British pound, and Swedish krona.
The Deutsche Bank EM FX Equally Weighted Spot Index, an equal-weighted basket of 21 emerging market currencies.
MSCI U.S. REIT Index is a free float-adjusted market capitalization weighted index that is comprised of equity Real Estate Investment Trusts (REITs). The index is based on the MSCI USA Investable Market Index (IMI), its parent index, which captures the large, mid and small cap segments of the USA market. With 150 constituents, it represents about 99% of the US REIT universe and securities are classified under the Equity REITs Industry (under the Real Estate Sector) according to the Global Industry Classification Standard (GICS®), have core real estate exposure (i.e., only selected Specialized REITs are eligible) and carry REIT tax status.
*Source: MSCI.MSCI makes no express or implied warranties or representations and shall have no liability whatsoever with respect to any MSCI data contained herein. The MSCI data may not be further redistributed or used as a basis for other indexes or any securities or financial products. This report is not approved, endorsed, reviewed or produced by MSCI. None of the MSCI data is intended to constitute investment advice or a recommendation to make (or refrain from making) any kind of investment decision and may not be relied on as such.
Performance Disclosures
All market pricing and performance data from Bloomberg, unless otherwise cited. Asset class and sector performance are gross of fees unless otherwise indicated.
The opinions and analyses expressed in this newsletter are based on RMB Capital Management, LLC’s (“RMB Capital”) research and professional experience are expressed as of the date of our mailing of this newsletter. Certain information expressed represents an assessment at a specific point in time and is not intended to be a forecast or guarantee of future results, nor is it intended to speak to any future time periods. RMB Capital makes no warranty or representation, express or implied, nor does RMB Capital accept any liability, with respect to the information and data set forth herein, and RMB Capital specifically disclaims any duty to update any of the information and data contained in this newsletter. The information and data in this newsletter does not constitute legal, tax, accounting, investment or other professional advice. Returns are presented net of fees. An investment cannot be made directly in an index. The index data assumes reinvestment of all income and does not bear fees, taxes, or transaction costs. The investment strategy and types of securities held by the comparison index may be substantially different from the investment strategy and types of securities held by your account. RMB Asset Management is a division of RMB Capital Management.