Overview
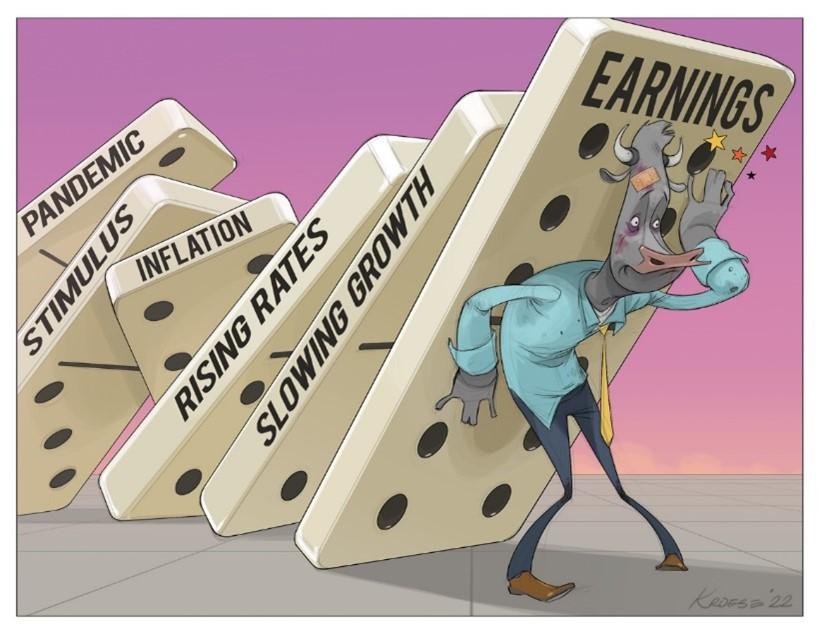
Merriam-Webster defines “domino effect” as “a cumulative effect produced when one event initiates a succession of similar events.”1 The term usually refers to something that is inevitable or at least very likely to happen, due to causal events that have already occurred. Given the series of historically significant—if not unprecedented—events that have transpired over the past few years, the “domino effect” seems particularly applicable to today’s most pressing economic question, a question that may stay front of mind through the remainder of the year. Is the U.S. economy headed for a recession?
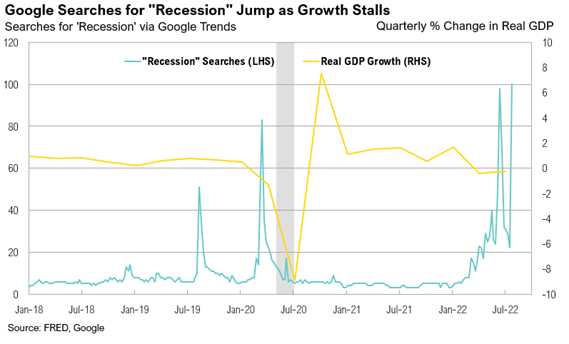
Recent concerns about a possible recession were triggered by news that U.S. real gross domestic product (GDP) growth declined by 0.9% in the second quarter, following a decline of 1.6% in the first quarter.2 Whether the National Bureau of Economic Research will officially label this a recession remains to be seen, but the data are clear: Real economic activity is slowing and very close to stalling out. With the benefit of hindsight, the individual dominos pointing to our economic malaise seem straightforward to line up: pandemic lockdowns caused portions of the economy to stall and severely curtailed production; this triggered a policy overaction, including massive fiscal and monetary stimulus. This in turn drove up demand, which—combined with the already constrained supply—brought about rapidly rising inflation, which was further exacerbated by a war and rising geopolitical tensions. Now, policymakers are scrambling to slow demand and raise interest rates, which in turn has slowed growth. When the Federal Reserve hiked interest rates in July by an additional 0.75% (bringing the Fed Funds rate to 2.25%-2.5%), it indicated that its future decisions would be based on incoming data. So, today we are left wondering if the combined impact of slowing growth, still-high inflation, and a wait-and-see Federal Reserve will drive the U.S. economy into an unmistakable, full-blown recession.
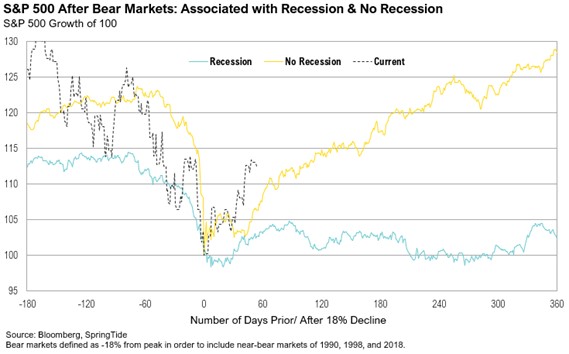
Recessions matter for a number of reasons, not least of which is their impact on corporate earnings and stock prices. Currently, markets are sitting at a fork in the road, which might be best assessed by examining previous bear markets—comparing those that were not associated with recessions to ones that were. The results are presented in the chart below. Recessions have historically caused two very different outcomes for the stock market. If, according to the ticker tape of history, the U.S. economy can skirt a recession, dips like the one this year should be bought. If, however, we enter recession, earnings will likely suffer, and more volatility may be ahead.
We’ve all experienced information overload this year as a steady stream of sensational news has disrupted our attention. During times like these, it may be helpful to focus on the core principles of investing. A stock, for instance, represents a claim on a potential stream of future earnings that may be paid out through dividends or reinvested in a business for future growth. Highly profitable businesses with high reinvestment rates can grow exponentially. Every multi-national behemoth, after all, began as a small company, sometimes in a garage.3 It was the dream—and later the realization—of profits that drove them to their current glory. Conversely, companies that fail to generate profits over the long term generally get penalized, sometimes through bankruptcy (although less so in recent years, as corporate bankruptcies hit a record low last year).4 While the wild gyrations over the past several years highlight that anything can happen in the short term, earnings still drive stock returns. According to data compiled by University of Yale Professor Robert Shiller, the stock market, as proxied by the S&P 500, has returned 7% annualized on an inflation-adjusted basis since 1871. Adjusted for dividends, that number falls to 4.7%, which is roughly in line with real earnings growth of 4.2% per year over the same period.5
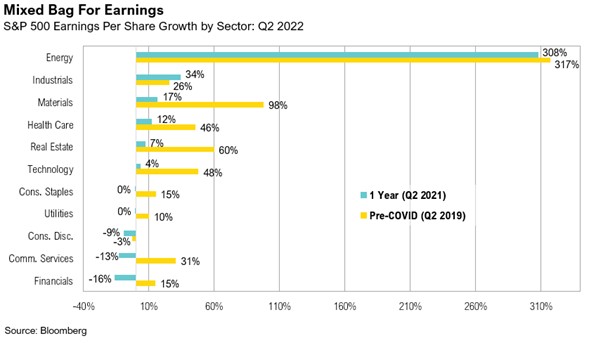
How are earnings holding up? Through August 5, 87% of companies in the S&P 500 had reported second-quarter earnings with a projected year-over-year growth rate of 6.7%, a modest increase from the 4% expected at the beginning of July.6 The largest contributor to this positive surprise was the energy sector, collectively reporting 308% earnings growth over that period. The two largest energy companies in the U.S., Exxon Mobil and Chevron, posted record profits of nearly $18 billion and $12 billion, respectively.7 Chevron more than doubled its capital expenditures from a year earlier while Exxon increased its production 4% compared to the first quarter. Despite this investment, Exxon and Chevron maintained dividend yields above 3%.8,9 Chevron’s stock price increased 9% overnight after the earnings announcement, while Exxon’s increased 4%. The average oil price over the quarter was $109 per barrel. Changes in oil prices are highly correlated with energy company earnings, so any decrease from these levels will translate to lower earnings and vice versa. Excluding the energy sector, the earnings of companies in the S&P 500 are expected to decline 3.7% relative to the same quarter last year.
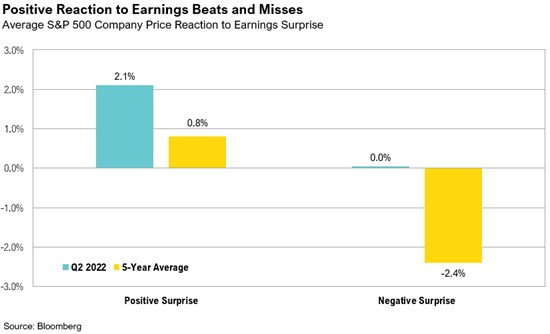
Despite relatively lackluster results overall, investors have reacted positively to earnings news, which clearly indicates that expectations were overly negative heading into reporting season. The average two-day price change in response to an earnings surprise for S&P 500 constituents was +2.1%, much higher than the 5-year average of +0.8%.10 Netflix, for example, beat earnings estimates by 8.8% despite reporting a loss of nearly one million subscribers, the largest decline in its history.11 The stock rose 7.3% in response suggesting even worse news had been expected and priced in. Co-CEO Reed Hastings summed it up best by describing their results as “less bad.”11
Additionally, the market has reacted relatively indifferently to earnings misses, returning 0% on average in the event of a miss.10 This is the first time the S&P 500 has not reacted negatively to negative earnings surprises since the first quarter of 2009. Microsoft, for example, missed analyst estimates by 3% due to a sharp slowdown in its cloud business, declining videogame sales, and the effects of a strong dollar.12 Despite this, the stock rallied 7% the following day after management said sales and operating income on a currency-adjusted basis should increase by a double-digit percentage in 2022.13 Microsoft’s earnings also highlight a surprising slowdown in big tech’s cloud operations. While the coveted segment is normally thought of as being both high growth and “recession-proof,” Amazon, Microsoft, and Google’s combined cloud revenue grew at 28% from a year earlier, down from 33% growth in the first quarter and the lowest growth rate in seven quarters.14 While 28% growth is still outstanding in absolute terms, any further slowing in this area will be a key trend to watch in the coming quarters.
The last theme we are watching regarding corporate earnings is how higher interest rates, combined with the risk of inflation, could hurt companies’ bottom lines, as evidenced by relatively strong revenue growth (coming in at +8.8% excluding-energy), coupled with waning profits (-3.7% excluding-energy).6 Although promising signs point to lower inflation, especially lower oil and gasoline prices, growth is also slowing.
Markets
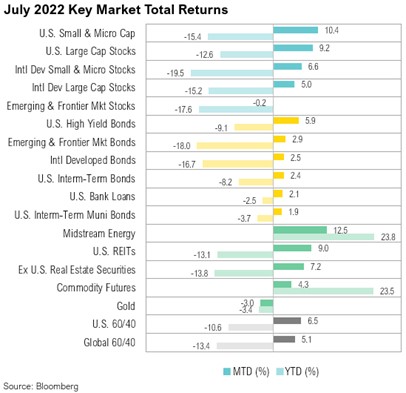
The S&P 500 jumped 9.2% higher in July, representing the best monthly return for the index since November 2020. From a style perspective, growth stocks outperformed value stocks, as the Russell 1000® Growth Index gained 12.0% while the Russell 1000® Value Index rose 6.6%. Small cap stocks slightly beat large cap stocks, returning 10.4% as proxied by the Russell 2000® Index. Midstream energy was one of the top performers over the month, returning 12.5%. Year-to-date, the industry has returned 23.8%, outperforming the S&P 500 by 36.4%. Despite relatively good performance by other real assets, gold disappointed over the month, falling 3.0%.
International equities underperformed their U.S. counterparts in July, with the MSCI EAFE Index up 5.0% while the MSCI Emerging Markets Index fell -0.2%. While some of this can be attributed to the U.S. dollar strengthening 1.2% over the month as proxied by the U.S. Dollar Index, international companies still underperformed on a local currency basis. Within emerging markets, China was the largest detractor, falling 9.5% over the month. Chinese equities have gone through an extremely volatile period ever since the Chinese Communist Party (CCP) started its most recent crackdown on the corporate sector early in 2021.15 This was exacerbated by their decision to implement a “zero-COVID” policy, requiring cities to initiate strict lockdowns if just a handful of cases are reported.16 Despite these worrisome headwinds, Chinese equities had outperformed in the first half of the year through June, falling just 11.3% compared to the MSCI ACWI Index’s drop of 20.2%. However, signs of a renewed crackdown on the tech sector, an escalation of the property developer crisis that has been ongoing for over a year now, and a rebound in COVID cases all weighed heavily on equity valuations and led to this most recent slide in prices.17
Fixed income investors finally received some relief in July with the Bloomberg U.S. Aggregate Index gaining 2.4% over the month, its highest monthly return since August 2019. Notably, the U.S. treasury curve inverted as longer-term yields fell significantly while shorter term yields rose. The 10-year yield minus the 2-year yield, a common representation of the Treasury yield curve and harbinger of economic growth, flattened from 6 basis points to -22 basis points over the month. The last time the U.S. treasury curve was this inverted was November 2000, as the dot-com bubble was just beginning to unwind. U.S. high yield bonds had their best month since October 2011, returning 5.9% as credit spreads tightened materially from 587 basis points to 483 basis points. Finally, emerging markets debt also had a good month, returning 2.9% despite U.S. dollar strength.
Looking Forward
The economy is, of course, far more complex and dynamic than a row of dominos, and we do not have the benefit of hindsight. The intersection of slowing growth and high, albeit easing, inflation has driven real economic activity to stall. How the Fed responds to this dynamic remains the wild card, but there are no easy decisions ahead. If the Fed stops tightening policy too soon, it may reignite risk-taking and stoke inflationary pressures. If it continues to tighten, the U.S. economy will likely continue to slow, taking corporate profits with it.
Nominal growth is relatively strong, but trending in the wrong direction. Conversely, inflation is much too high, but trending in the right direction. The policy feedback loop in the context of an economy without the luxury of much spare capacity—in labor, energy, housing, and a host of other markets—has the potential to drive more fits, starts, and whipsaws for economic activity, earnings, and asset prices in the years ahead. This environment could prove perilous for investors who chase returns but could also indicate massive opportunity for those with patience and discipline.
At RMB, we believe there will be continued volatility in both equity and fixed income markets as the Federal Reserve continues with their plan to increase interest rates in the face of high inflation. Markets continue to price in additional interest rate hikes through the rest of 2022. We feel that fundamentals will be a key driver of markets over the longer term but the risks in the short-term are continuing to rise. While earnings growth estimates remain positive, we are starting to see signs of that growth slowing down, as companies are grappling with continued headwinds, such as high inflation, supply chain disruptions, and labor. We continue to believe that the income component of our client’s investment portfolios – the interest paid from owning bonds and stock dividends – may be a more important factor of investment returns going forward. To help weather the on-going volatility we are likely to experience in the coming months, we continue to recommend clients stick to their long-term investment allocation targets and use the market volatility to their benefit, by taking advantage of rebalancing opportunities to selectively make changes within portfolios. During volatile times, a key to successful investing is often remaining calm and committed to long-term investment plans. We remain optimistic that the strategies we have in place for our clients will drive long-term success, despite the volatility we are currently experiencing.
Citations
1. Merriam-Webster: https://www.merriam-webster.com/dictionary/domino%20effect
2. BEA: https://www.bea.gov/data/gdp/gross-domestic-product
3. Guardian: https://www.theguardian.com/technology/2014/dec/05/steve-wozniak-apple-starting-in-a-garage-is-a-myth
4. Axios: https://www.axios.com/2022/08/02/get-ready-for-corporate-default-rates-to-climb
5. Yale: http://www.econ.yale.edu/~shiller/data.htm
6. Factset: https://insight.factset.com/sp-500-earnings-season-update-august-5-2022
7. CNBC: https://www.cnbc.com/2022/07/29/exxon-xom-and-chevron-cvx-earnings-q2-2022.html
8. Exxon Mobil: https://corporate.exxonmobil.com/Investors/Investor-relations/Dividend-information
9. YCharts: https://ycharts.com/companies/CVX/dividend_yield
10. Factset: https://insight.factset.com/market-not-punishing-negative-eps-surprises-reported-by-sp-500-companies-for-q2
11. NYT: https://www.nytimes.com/2022/07/19/business/media/netflix-earnings.html
12. WSJ: https://www.wsj.com/articles/microsoft-msft-q4-earnings-report-2022-11658786211
13. WSJ: https://www.wsj.com/livecoverage/stock-market-news-today-26-7-22/card/microsoft-investors-cheer-guidance-K6vZjPFpBtsa0YGbSUsr?mod=article_inline
14. WSJ: https://www.wsj.com/articles/the-cloud-isnt-recession-proof-11658746981?mod=article_inline
15. WSJ: https://www.wsj.com/articles/china-corporate-crackdown-tech-markets-investors-11628182971
16. BBC: https://www.bbc.com/news/59882774
17. Bloomberg: https://www.bloomberg.com/news/articles/2022-07-29/hong-kong-stocks-eye-correction-as-property-tech-woes-return
Index Definitions
The S&P 500 Index is widely regarded as the best single gauge of the United States equity market. It includes 500 leading companies in leading industries of the U.S. economy. The S&P 500 focuses on the large cap segment of the market and covers approximately 75% of U.S. equities.
The Bloomberg Barclays U.S. Aggregate Index represents securities that are SEC-registered, taxable, and dollar denominated. The index covers the U.S. investment grade fixed rate bond market, with index components for government and corporate securities, mortgage pass-through securities, and asset-backed securities. Duration is roughly 5 years.
The Bloomberg Commodity Index is a broadly diversified commodity price index calculated on an excess return basis and reflects commodity futures price movement.
The Bloomberg Barclays U.S. High Yield Index covers the universe of fixed rate, non-investment grade debt. Eurobonds and debt issues from emerging market countries are excluded, but Canadian and global bonds of issuers in non-emerging market countries are included. The index consists of both corporate and non-corporate sectors. The corporate sectors are industrial, utility and finance, which include both US and non-US corporations. The securities within the index must have at least one year to final maturity, must have at least $150 million par amount outstanding and must be rated as high-yield (BB+ or lower). They must also be fixed rate, dollar-denominated and non-convertible.
The S&P Energy Select Sector Index seeks to measure S&P 500 constituents in the Energy sector, using capping to ensure diversification among companies within the index.
The U.N. Food Price Index is compiled by the Food and Agriculture Organization (FAO) of the United Nations as a measure of the monthly change in international prices of a basket of food commodities.
The Russell 1000® Value Index measures the performance of the large-cap value segment of the U.S. equity universe. It includes those Russell 1000 companies with lower price-to-book ratios and lower expected and historical growth rates.
The Russell 1000® Growth Index measures the performance of the large- cap growth segment of the US equity universe. It includes those Russell 1000 companies with relatively higher price-to-book ratios, higher I/B/E/S forecast medium term (2 year) growth and higher sales per share historical growth (5 years).
The Russell 2000® Index measures the performance of the small-cap segment of the US equity universe. It includes approximately 2000 of the smallest US equity securities in the Russell 3000 Index based on a combination of market capitalization and current index membership. The Russell 2000 Index represents approximately 10% of the total market capitalization of the Russell 3000 Index. Because the Russell 2000 serves as a proxy for lower quality, small cap stocks, it provides an appropriate benchmark for RMB Special Situations.
MSCI EAFE Index*: an equity index which captures large and mid-cap representation across 21 of 23 Developed Markets countries around the world, excluding the U.S. and Canada. With 926 constituents, the index covers approximately 85% of the free float-adjusted market capitalization in each country.
The MSCI Emerging Markets Index* measures equity market performance in the global emerging markets universe. It covers over 2,700 securities in 21 markets that are currently classified as EM countries. The MSCI EM Index universe spans large, mid and small cap securities and can be segmented across all styles and sectors.
The U.S. Dollar Index is used to measure the value of the dollar against a basket of six foreign currencies: the euro, Swiss franc, Japanese yen, Canadian dollar, British pound, and Swedish krona.
The J.P. Morgan ESG EMBI Global Diversified Index (JESG EMBIG) tracks liquid, US Dollar emerging market fixed and floating-rate debt instruments issued by sovereign and quasi-sovereign entities.
*Source: MSCI.MSCI makes no express or implied warranties or representations and shall have no liability whatsoever with respect to any MSCI data contained herein. The MSCI data may not be further redistributed or used as a basis for other indexes or any securities or financial products. This report is not approved, endorsed, reviewed or produced by MSCI. None of the MSCI data is intended to constitute investment advice or a recommendation to make (or refrain from making) any kind of investment decision and may not be relied on as such.
All market pricing and performance data from Bloomberg, unless otherwise cited. Asset class and sector performance are gross of fees unless otherwise indicated.
The opinions and analyses expressed in this newsletter are based on RMB Capital Management, LLC’s (“RMB Capital”) research and professional experience are expressed as of the date of our mailing of this newsletter. Certain information expressed represents an assessment at a specific point in time and is not intended to be a forecast or guarantee of future results, nor is it intended to speak to any future time periods. RMB Capital makes no warranty or representation, express or implied, nor does RMB Capital accept any liability, with respect to the information and data set forth herein, and RMB Capital specifically disclaims any duty to update any of the information and data contained in this newsletter. The information and data in this newsletter does not constitute legal, tax, accounting, investment or other professional advice. Returns are presented net of fees. An investment cannot be made directly in an index. The index data assumes reinvestment of all income and does not bear fees, taxes, or transaction costs. The investment strategy and types of securities held by the comparison index may be substantially different from the investment strategy and types of securities held by your account.


