


Key Takeaways
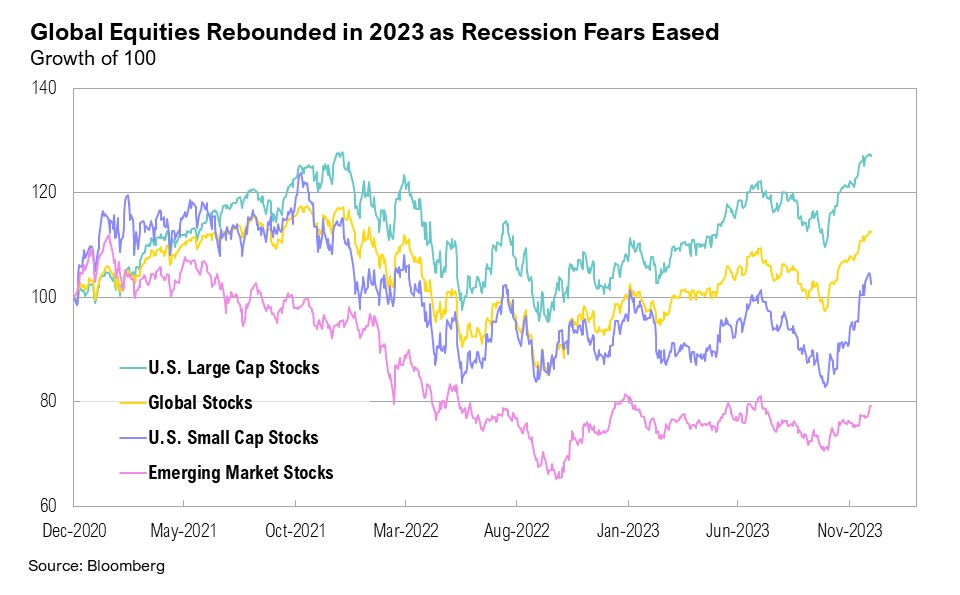
- Despite the recession fears and banking crisis of early 2023, the market rallied with U.S. large cap stocks up 26.3% and U.S. intermediate-term bonds up 5.5% over the course of the year, buoyed by moderating inflation.
- This year’s positives included a resilient U.S. consumer, a tight labor market, and a nascent artificial intelligence boom, although some negatives—including heightened geopolitical tensions and an extended manufacturing slump—persisted.
- Although U.S. retail sales were strong, credit card usage rose rapidly, and U.S. government deficit spending reached record levels, which raised concerns about fiscal health.
- ‘Balancing act' defines 2024's outlook. The Fed is delicately managing inflation versus recession risks, while the Treasury must navigate massive amounts of government debt and reduced foreign demand. Investors, facing wide-ranging scenarios—from significant downside risks to an economic reacceleration—must remain humble and nimble.
2023 Review
Markets were strong in the fourth quarter and over the entire year. U.S. large cap stocks ended the quarter up 11.7% and the year up 26.3%. Even with these impressive gains, the S&P 500 Index ended the year 1% shy of its all-time high, which it reached in January 2022—almost two years ago. Breaking the trend of the prior two years, 2023 was also positive for U.S. intermediate-term bonds. The Bloomberg Aggregate Bond Index rose 6.8% over the fourth quarter to end the year up 5.5%. The index gained 8.5% over the last two months of 2023, marking the best two-month performance for U.S. bonds since September to October 1982, when the index increased 9.6%.
What drove this impressive snap-back in asset prices? The answer likely lies as much in what did happen as what did not. What did happen last year was declining inflation, robust nominal GDP growth, a resilient labor market and consumer, but also a banking crisis, proliferating armed conflicts, and flatlining corporate earnings. What didn’t happen was the widely feared recession that had many investors cautiously positioned coming into 2023.
Headline inflation, which started 2023 at 6.4% year-over-year, gradually eased to 3.1% by November. The U.S. banking system also experienced its greatest crisis since the Global Financial Crisis (GFC) in March, triggered by a significant loss of deposits in several domestic U.S. banks. The Federal Reserve intervened and launched new programs, including the Bank Term Funding Program (BTFP) that provides long-term, low-cost loans to banks in order to shore up liquidity and stability. Although intended as a short-term support, BTFP usage continues, seemingly unabated. Usage reached a record $135.8 billion in the week of December 27, despite the program being set to expire in March 2024.1
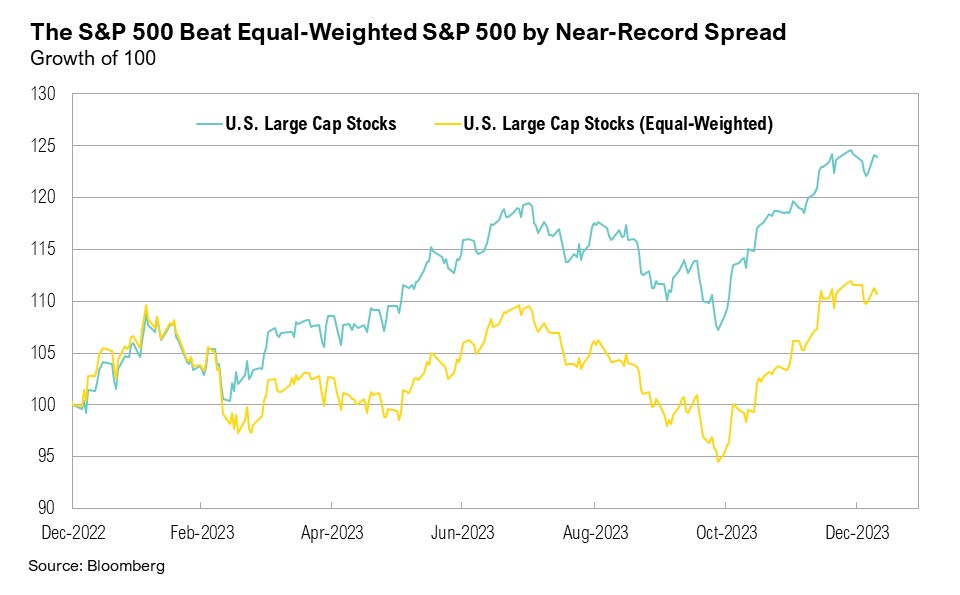
The AI boom, ignited by the launch of ChatGPT in November 2022, was another significant factor influencing the markets. This enthusiasm was reflected in the technology sector’s impressive performance in 2023. Notably, the 'Magnificent Seven'—comprising Meta, Apple, Amazon, Nvidia, Alphabet, Microsoft, and Tesla, all mega-cap tech-related companies in the S&P 500—saw an impressive rebound. After declining by an average of 45.3% in 2022, they ended 2023 with an average total return gain of 104.7%.2 In fact, these seven stocks alone accounted for 62.2% of the S&P 500’s full-year return for 2023. Without this group, the index’s return was only 9.9%. The collective market value of these 'Magnificent Seven' companies is now quadruple that of the entire Russell 2000, a widely followed small cap index of 2,000 publicly traded companies. The unusual concentration of gains in just a few stocks is starkly illustrated by the 12% spread between the equal-weighted S&P 500 and the market cap-weighted index, with the former trailing the latter by the second-largest calendar year spread since at least 1971.
Geopolitical tensions persisted in 2023. The conflict in Ukraine continued, and in October, a new conflict erupted in Israel following an attack by Hamas. Additionally, in December, major global shippers such as Maersk and Hapag-Lloyd were forced to reroute cargo around the tip of Africa (instead of passing through the Suez Canal) due to intensified attacks by militant group Houthi in the Red Sea. If left unresolved, these disruptions could drive up global shipping costs and reignite inflation for the cost of goods.3
Domestically, two key factors defined 2023 and remain critical heading into 2024: the resilience of the U.S. consumer and the alarming rate of U.S. government deficit spending. Retail sales initially slumped at the start of the fourth quarter, raising concerns among major retailers about weak holiday spending.4 However, this trend reversed as the quarter progressed, as noted by American Express CEO Stephen Squeri:
“In October, everybody got a little bit skittish… But if we look at November, November is back to what we looked like in the third quarter. In our holiday season, U.S. consumer retail was very strong from Thanksgiving to Cyber Monday. Overall, goods and services from a retail perspective are very, very strong”5
In fact, U.S. consumers remained remarkably resilient throughout 2023, supported by excess pandemic savings and strong jobs markets. Despite increased reliance on credit card spending, the household debt service ratio has thus far remained contained, at 5.8%, on par with the historical average of 5.7%.6 Consumers are set to benefit from lower gasoline prices heading into 2024, with prices ending 2023 at $3 per gallon—a significant 38% drop from the June 2022 peak of $5.1 per gallon.7
Despite this resilience, credit card usage and buy-now-pay-later programs have become increasingly popular over the past two years.8 Consumer revolving credit rose to an all-time high of $1.3 trillion in November, and the average interest rate on a new credit card has risen to a record 24%, compared to an average rate of 14.5% in February 2022.9,10 At the start of 2023, U.S. consumers were in unusually good shape after working down debt during the pandemic and benefitting from very low mortgage refinancing rates, but the recent acceleration in credit card debt is concerning, especially given the context of full employment.
Corporate earnings growth was sluggish in 2023 and is expected to come in at just 0.6% on a year-over-year basis for the S&P 500. The fourth quarter estimated year-over-year growth rate is 2.4%, 5.8% lower than it was at the end of September. Looking forward, analysts project year-over-year earnings growth of 11.5% and revenue growth of 5.5% for the S&P 500 in 2024. Even with this optimistic outlook, stocks do not appear cheap. The forward 12-month price-to-earnings (P/E) ratio of 19.3 is above the 5-year average of 18.8 and well above the 10-year average of 17.6.11
Yet, as inflation eased and the feared recession remained at bay, equity prices rose, and investors took on more risk, with some measures of investor risk appetite increasing at an unprecedented pace during the fourth quarter. According to the December 27 weekly American Association of Individual Investors (AAII) Investor Sentiment Survey, 46% of respondents were bullish on the stock market for the next six months. Bullish sentiment reached a one-year high of 53% on December 20 and remains well above the historical bullish average of 38%.12 In contrast, only 25% of investors remain bearish, well below the historical average of 31%.12 According to the CNN Fear & Greed Index, extreme greed has been driving the market over December.13
Balancing Act
Amidst a backdrop of declining inflation and an economy losing steam, the Fed finds itself on a tightrope, trying to wring out the remnants of unwanted inflation without causing a recession. Comments from Treasury Secretary Yellen on December 13 underscored the scrutiny on the Fed and perhaps the hope that they ease interest rates sooner rather than later:
“As inflation moves down, it’s in a way natural that interest rates should come down somewhat because real interest rates would otherwise increase, which can tend to tighten financial conditions.”14
By year's end, with inflation appearing subdued, the path forward seemed clearer, yet the real test for the Fed will be the cadence and timing of interest rate reductions. Premature cuts risk reigniting inflationary pressures, while delayed action could exacerbate the downturn effect of prior hikes, potentially steering the U.S. economy into recession during an election year.
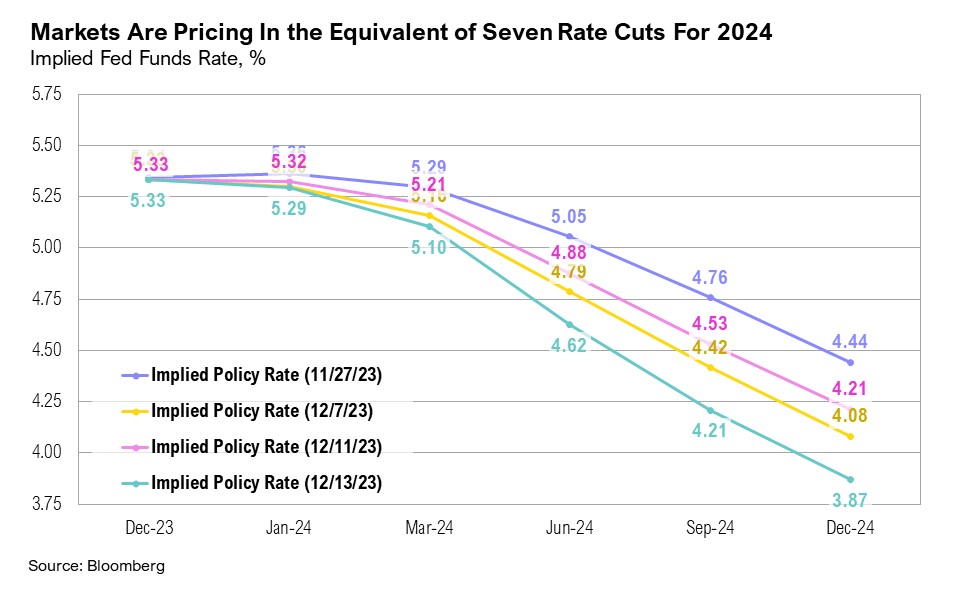
After peaking at a four-decade high of 9.1% in June 2022, headline inflation eased to 3.4% year-over-year in December. While core inflation remains stickier, at 3.9% year-over-year, it is still a marked improvement from the high of 6.6% in September 2022. Given the notable progress made with bringing inflation back down to its target of 2%, the Federal Reserve has not hiked interest rates since July, keeping their policy rate at an effective 5.33% (range of 5.25% to 5.5%). On December 13, at the last Federal Open Market Committee (FOMC) meeting of 2023, Fed Chairman Jerome Powell hinted that the Fed may be at the end of its rate hiking cycle and preparing for rate cuts in 2024:
“The question of when will it be become appropriate to begin dialing back the amount of policy restraint in place that begins to come into view and is clearly a discussion topic of discussion out in the world and also of discussion for us at our meeting reading today… I would say there’s a general expectation that this will be a topic for us looking ahead.”15
In response to Powell’s comments, speculation about imminent rate cuts swelled, and markets soon priced in the expectation for the equivalent of seven 0.25% rate cuts in 2024, starting in March.16 In a telling response, U.S. small cap stocks soared nearly 8% in the 48 hours following the news, highlighting the significance the market placed on what had happened.
Although inflation appears under control, premature rate cuts carry risks. Recent data show that the U.S. housing market is ramping up again, potentially leading to higher month-over-month inflation prints.17 In the U.S. CPI basket, housing is the largest component, accounting for 44.6%, followed by transportation at 17.0%, and food and beverages at 14.3%.18 Fortunately, the risk of stagflation—characterized by slowing growth, high unemployment, and rising inflation—appears negligible, but concerns could rise down the road if inflation reaccelerates.
What about the risks of a recession if the Fed does not cut rates? Although some economic data still calls for caution, most market participants have shifted to a much more optimistic tone—and likely positioned portfolios for it. Only 21% of the Bank of America’s Fund Manager Survey respondents anticipate a hard landing or recession in the next year, compared to nearly 70% expecting a recession in November 2022.19 This is in spite of the Conference Board’s Leading Economic Index signaling a recession for the 19th consecutive month, a firmly inverted yield curve (ending 2023 at -35 basis points), the 14th-consecutive month of contraction in the manufacturing sector (according to the ISM Manufacturing PMI), and December’s ISM Services reading badly missing expectations and narrowly averting a reading below 50, consistent with outright contraction.20,21,22,23
Higher interest rates have created significant challenges for commercial real estate (CRE), particularly the office sector. The shift to remote work after the pandemic contributed to total U.S. office vacancies climbing to 20%, surpassing the peak GFC vacancy rate of 17.6%. Additionally, the growth of e-commerce has adversely affected physical stores. For example, online sales during the recent Black Friday holiday spending period reached a record $9.8 billion in online sales.24 Online sales increased by 8% year-over-year, while in-store sales rose only 1% year-over-year.24
Additionally, the multifamily sector continued to face increasing operating costs and refinancing challenges amid rising interest rates. Despite falling prices, constant CRE debt levels are driving up leverage and exacerbating solvency issues. Smaller domestic U.S. banks, which hold 70% of all CRE loans, face a significant risk.25,26 Recent studies by the St. Louis Federal Reserve and the National Bureau of Economic Research (NBER) reveal that smaller banks are especially prone to insolvency risks from uninsured depositor runs.26,27 These studies emphasize the need for both short-term policy responses and long-term strategies, such as market-based recapitalization and stricter regulatory oversight.26,27 The NBER study concluded that a 10-20% default rate on CRE loans—a range similar to that experienced during the GFC—could lead to between $80 and $160 billion in additional bank losses.27 The balancing act of careful risk management and effective policy responses is critical for addressing vulnerabilities in CRE and ensuring financial system stability.
Additionally, there has been a noticeable credit deterioration in key lending areas for several specific U.S. commercial banks, a situation that could worsen with ongoing higher rates. If current interest rate levels continue, debt defaults could increase, and other significant repercussions could emerge in the banking sector.
The Fed’s tricky task of navigating interest rate levels has rightfully received ample attention, but what has been much less discussed, albeit no less important, is the balancing act facing the U.S. Treasury and Secretary Yellen. Nearly $9 trillion in government debt must be rolled over at higher interest rates amid waning foreign investment in U.S. Treasury markets. This challenge is amplified by the impending pressures of an election year, where fiscal decisions may be scrutinized for their long-term impact on the economy.
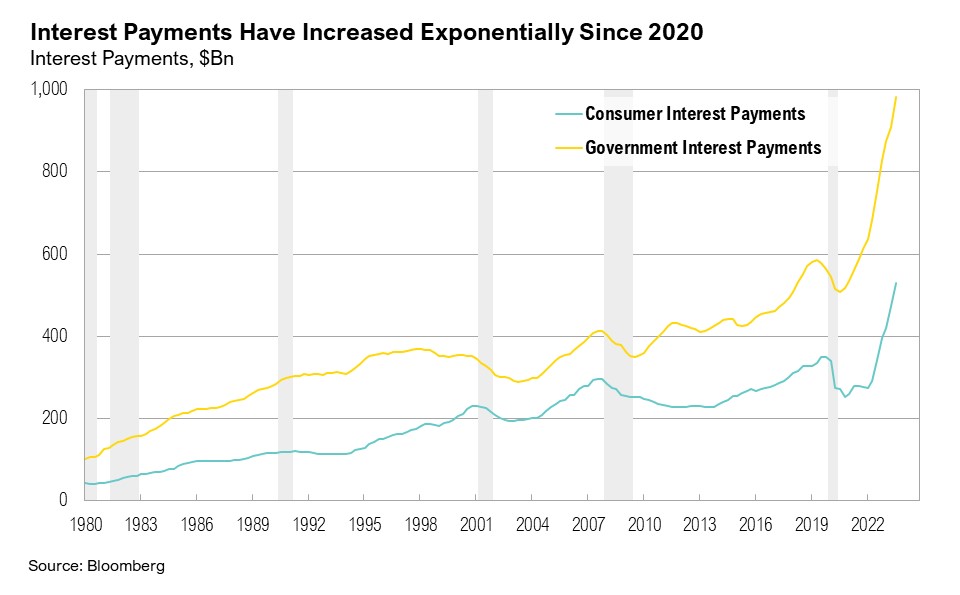
Government spending has been a key theme throughout 2023, starting with the debt ceiling debate in May. The U.S. government reached a $1.7 trillion deficit at the end of the 2023 fiscal year—the largest in a non-recessionary or non-crisis year in history. Despite this, the government has continued to spend at a rapid pace. Total debt outstanding increased by $834 billion in the first three months of the new fiscal year (compared to $490 billion over the same period last year). Arguably more important, due to elevated interest rates, the interest expense on U.S. public debt has risen to $949 billion over the past year and is on track to become the largest line item in the Federal budget if this trend persists.28 This could challenge government spending productivity and overall fiscal health heading into an important election year.
Treasury issuance throughout 2023 suggests that the deficit may not be an anomaly, but rather the continuation of a trend. Borrowing for the fourth quarter of 2023 is expected to have reached $605 billion, and current estimates for the first quarter of 2024 are $816 billion. The forecast for the first quarter of 2024 alone exceeds the annual borrowing average of $721 billion since 2000. Further, Treasury has historically maintained a balance between issuing longer- and shorter-term debt, but the balance was little heeded in 2023 when the majority of issuance came from bills that mature in less than one year.29 By focusing issuance in bills, the Treasury was able to incentivize financial institutions with trillions of dollars of excess cash accumulated in the wake of the pandemic to withdraw this cash from the Fed’s Reverse Repurchase Agreement (RRP) facility and buy Treasury bills, helping to fund the deficit. At the end of December 2022, the amount of money sitting in the RRP facility peaked at over $2.5 trillion. As of January 2024, this one-time source of liquidity for the Treasury market has been worked down to under $670 billion.30
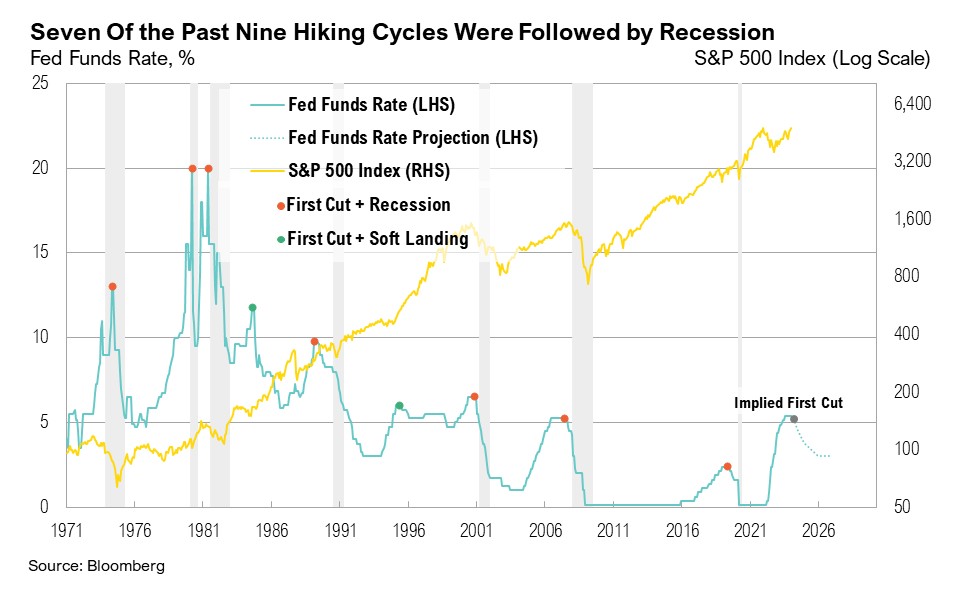
Investors are left with questions that only time can answer. Can the Fed’s anticipated rate cuts ease economic strains and support markets for another year or longer? Will Treasury be able to capably handle government debt? Historically, soft landings have been quite rare, as seven out of the past nine hiking cycles were followed by a recession. Like a seasoned acrobat, Powell will have his work cut out for him. And the Treasury may indeed be embarking on a new, uncharted course altogether.
Markets
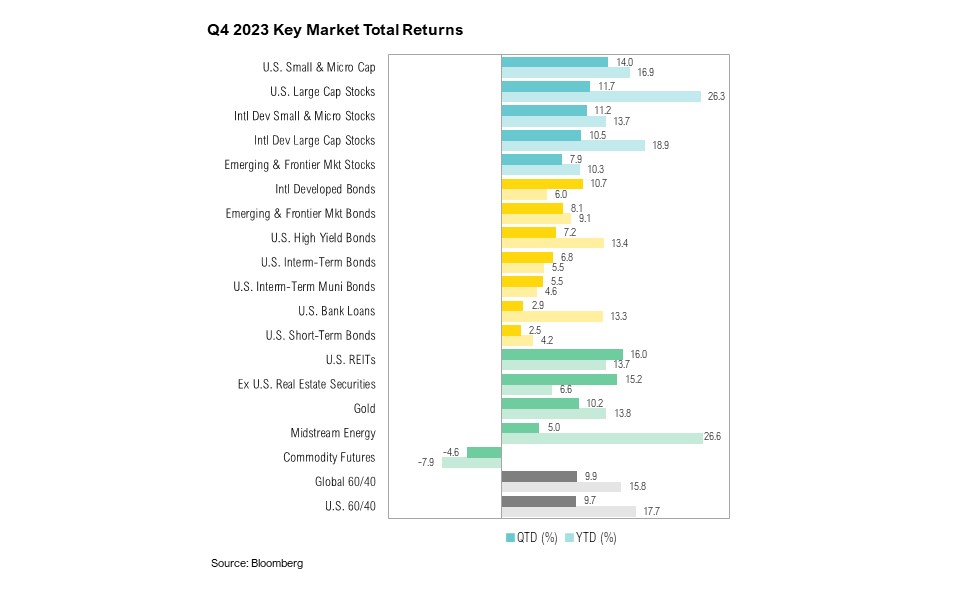
Only one asset class—commodity futures—finished the year (and the quarter) in negative territory, ending 2023 down 7.9%. The top-performing asset class in 2023 was midstream energy, up 26.6%, which marginally outperformed U.S. large cap stocks, which ended the year up 26.3%. International, developed large cap stocks gained 18.9% in 2023, lagging U.S. large cap stocks. U.S. small and micro-cap stocks gained an impressive 14.0% over the fourth quarter, pushing 2023 returns up to 16.9%.
It was a rollercoaster year for the 10-year Treasury yield, which peaked at 4.98% on October 18 before ending the year where it started, at 3.9%. Fueled by November’s stellar performance, U.S. intermediate-term bonds ended 2023 up 5.5%. Largely due to heightened geopolitical tensions and its role as a safe-haven asset, gold gained a respectable 10.2% throughout the fourth quarter to end the year up 13.8%.
Looking Forward
In 2024, policymakers and investors alike find themselves navigating a delicate ‘balancing act’ across potential economic extremes. On the one hand, there's the possibility of an economic reacceleration, which could be good for stocks, potentially broadening out the narrow market gains of last year. On the other, we might face a 'hard landing' characterized by falling inflation and yields, which could favor bonds.
Further complicating the outlook is the challenge in anticipating policy moves ahead of a presidential election. For instance, policymakers, grappling with a mountain of debt, rising interest costs, and limited options, seem cornered into reducing interest rates, irrespective of whether it's the right thing to do. While this strategy might alleviate immediate fiscal challenges, it risks doing even more long-term harm to the U.S. economy. A policy stance that tolerates moderately higher inflation to mitigate debt excesses may seem practical, but it represents a double-edged sword, particularly impacting the lower-income population. These more long-term concerns were eloquently expressed by University of Michigan Professor of Law and Economics, James Hines, in recent public remarks:
“[I am] not so worried that rising deficits will cause a crisis. More likely, they will slowly erode American power as [we are] forced to cut back on research and development, investment and military spending. Why is the United States rich to begin with? [It’s because] we’ve been doing capitalism better than a lot of other places. If we let that erode, you’re starting to undermine the sources of your wealth.”31
We continue to believe that there will be volatility in equity and fixed income markets in the coming year. The Federal Reserve is still aiming for their soft-landing goal while the economy and markets grapple with mixed data. As the new year begins, we will be paying special attention to trends in earnings, inflation, fiscal policy and the buzz around the upcoming election. We continue to favor both high-quality stocks and bonds, rather than being overly aggressive with opportunities in lower quality assets. Short-term bonds remain attractive, but investors should be prepared for changes to the yield curve over the next 12 months. We believe that a high-quality diversified asset allocation remains the best approach to navigate uncertainty in the coming year. During volatile times, the key to successful investing is often remaining committed to long-term investment plans.
Citations
1. Bloomberg: https://www.bloomberg.com/news/articles/2023-12-26/fed-likely-to-end-bank-funding-program-in-march-says-wrightson
2. S&P Global: https://www.spglobal.com/spdji/en/documents/commentary/market-attributes-us-equities-202312.pdf
3. Reuters: https://www.reuters.com/world/middle-east/maersk-continues-schedule-suez-journeys-despite-houthi-attack-2024-01-02/
4. CNBC: https://www.cnbc.com/2023/11/22/retailers-outlook-black-friday-holiday-2023-spending.html
5. The Transcript: https://thetranscript.substack.com/p/12-11-2023-no-landing
6. FRED: https://fred.stlouisfed.org/series/CDSP
7. AAA: https://gasprices.aaa.com/state-gas-price-averages/
8. Bank for International Settlements: https://www.bis.org/publ/qtrpdf/r_qt2312e.htm
9. FRED: https://fred.stlouisfed.org/series/REVOLSL
10. Lending Tree: https://www.lendingtree.com/credit-cards/average-credit-card-interest-rate-in-america/
11. FactSet: https://advantage.factset.com/hubfs/Website/Resources%20Section/Research%20Desk/Earnings%20Insight/EarningsInsight_121523.pdf
12. AAII: https://www.aaii.com/sentimentsurvey
13. CNN: https://edition.cnn.com/markets/fear-and-greed
14. Bloomberg: https://www.bloomberg.com/news/articles/2023-12-13/yellen-says-natural-for-fed-to-lower-rates-as-inflation-falls
15. Federal Reserve: https://www.federalreserve.gov/mediacenter/files/FOMCpresconf20231213.pdf
16. CME FedWatch: https://www.cmegroup.com/markets/interest-rates/cme-fedwatch-tool.html
17. Reuters: https://www.reuters.com/markets/us/us-annual-home-price-growth-61-september-fhfa-says-2023-11-28/
18. BLS: https://www.bls.gov/news.release/cpi.t03.htm
19. Bank of America via Game of Trades (X): https://twitter.com/GameofTrades_/status/1740757065101103493/photo/1
20. FRED: https://fred.stlouisfed.org/series/T10Y2Y
21. Conference Board: https://www.conference-board.org/topics/us-leading-indicators
22. ISM Manufacturing PMI: https://www.ismworld.org/supply-management-news-and-reports/reports/ism-report-on-business/pmi/december/
23. ISM Services PMI: https://www.ismworld.org/supply-management-news-and-reports/reports/ism-report-on-business/services/december/
24. CNBC: https://www.cnbc.com/2023/11/25/black-friday-shoppers-spent-a-record-9point8-billion-in-us-online-sales-up-7point5percent-from-last-year.html
25. Reuters: https://www.reuters.com/markets/us/banks-report-continued-pain-commercial-real-estate-loans-2023-10-18
26. St. Louis Federal Reserve: https://research.stlouisfed.org/publications/economic-synopses/2023/11/17/commercial-real-estate-where-are-the-financial-risks
27. NBER: https://www.nber.org/system/files/working_papers/w31970/w31970.pdf
28. CRFB: https://www.crfb.org/blogs/2023-interest-costs-reach-659-billion
29. FiscalData: https://fiscaldata.treasury.gov/datasets/securities-issued-in-treasurydirect/sales
30. FRED: https://fred.stlouisfed.org/series/RRPONTSYD
31. NY Times: https://www.nytimes.com/2024/01/08/opinion/budget-deal-us-government-debt.html
Index Definitions
The S&P 500 Index is widely regarded as the best single gauge of the United States equity market. It includes 500 leading companies in leading industries of the U.S. economy. The S&P 500 focuses on the large cap segment of the market and covers approximately 75% of U.S. equities.
The Bloomberg Barclays U.S. Aggregate Index represents securities that are SEC-registered, taxable, and dollar denominated. The index covers the U.S. investment grade fixed rate bond market, with index components for government and corporate securities, mortgage pass-through securities, and asset-backed securities. Duration is roughly 5 years.
The Bloomberg U.S. Corporate High Yield Bond Index measures the USD-denominated, high yield, fixed-rate corporate bond market. Securities are classified as high yield if the middle rating of Moody’s, Fitch and S&P is Ba1/BB+/BB+ or below. Bonds from issuers with an emerging markets country of risk, based on the indices’ EM country definition, are excluded.
The Russell 1000® Value Index measures the performance of the large-cap value segment of the U.S. equity universe. It includes those Russell 1000 companies with lower price-to-book ratios and lower expected and historical growth rates.
The Russell 1000® Growth Index measures the performance of the large- cap growth segment of the US equity universe. It includes those Russell 1000 companies with relatively higher price-to-book ratios, higher I/B/E/S forecast medium term (2 year) growth and higher sales per share historical growth (5 years).
The Russell 2000® Index measures the performance of the small-cap segment of the US equity universe. It includes approximately 2000 of the smallest US equity securities in the Russell 3000 Index based on a combination of market capitalization and current index membership. The Russell 2000 Index represents approximately 10% of the total market capitalization of the Russell 3000 Index. Because the Russell 2000 serves as a proxy for lower quality, small cap stocks, it provides an appropriate benchmark for RMB Special Situations.
MSCI EAFE Index*: an equity index which captures large and mid-cap representation across 21 of 23 Developed Markets countries around the world, excluding the U.S. and Canada. With 926 constituents, the index covers approximately 85% of the free float-adjusted market capitalization in each country.
The MSCI Emerging Markets Index* measures equity market performance in the global emerging markets universe. It covers over 2,700 securities in 21 markets that are currently classified as EM countries. The MSCI EM Index universe spans large, mid and small cap securities and can be segmented across all styles and sectors.
The U.S. Dollar Index is used to measure the value of the dollar against a basket of six foreign currencies: the euro, Swiss franc, Japanese yen, Canadian dollar, British pound, and Swedish krona.
The Deutsche Bank EM FX Equally Weighted Spot Index, an equal-weighted basket of 21 emerging market currencies.
MSCI U.S. REIT Index is a free float-adjusted market capitalization weighted index that is comprised of equity Real Estate Investment Trusts (REITs). The index is based on the MSCI USA Investable Market Index (IMI), its parent index, which captures the large, mid and small cap segments of the USA market. With 150 constituents, it represents about 99% of the US REIT universe and securities are classified under the Equity REITs Industry (under the Real Estate Sector) according to the Global Industry Classification Standard (GICS®), have core real estate exposure (i.e., only selected Specialized REITs are eligible) and carry REIT tax status.
Performance Disclosures
All market pricing and performance data from Bloomberg, unless otherwise cited. Asset class and sector performance are gross of fees unless otherwise indicated.
*Source: MSCI.MSCI makes no express or implied warranties or representations and shall have no liability whatsoever with respect to any MSCI data contained herein. The MSCI data may not be further redistributed or used as a basis for other indexes or any securities or financial products. This report is not approved, endorsed, reviewed or produced by MSCI. None of the MSCI data is intended to constitute investment advice or a recommendation to make (or refrain from making) any kind of investment decision and may not be relied on as such.
The opinions and analyses expressed in this newsletter are based on Curi RMB Capital, LLC’s (“Curi RMB”) research and professional experience are expressed as of the date of our mailing of this newsletter. Certain information expressed represents an assessment at a specific point in time and is not intended to be a forecast or guarantee of future results, nor is it intended to speak to any future time periods. Curi RMB makes no warranty or representation, express or implied, nor does Curi RMB accept any liability, with respect to the information and data set forth herein, and Curi RMB specifically disclaims any duty to update any of the information and data contained in this newsletter. The information and data in this newsletter does not constitute legal, tax, accounting, investment or other professional advice. Returns are presented net of fees. An investment cannot be made directly in an index. The index data assumes reinvestment of all income and does not bear fees, taxes, or transaction costs. The investment strategy and types of securities held by the comparison index may be substantially different from the investment strategy and types of securities held by your account. RMB Asset Management is a division of Curi RMB Capital.