


Overview
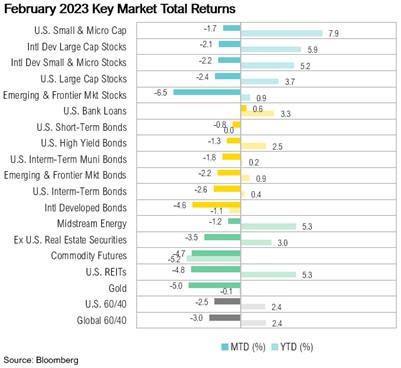
Compared to the strong gains posted in January, February was a difficult month for the markets. The only asset class to produce positive returns was U.S. bank loans, ending February marginally up with a gain of 0.6%. The S&P 500 ended the month down 2.4%, and the Bloomberg U.S. Aggregate Bond Index ended the month down 2.6%, erasing almost all of January’s gains. In fact, February was the fifth-worst monthly decline for bonds since 1993. Bonds are now up only 0.4% for the year to date, after ending 2022 down 13%.
By the end of February, almost all major U.S. public companies had reported fourth-quarter 2022 results. In the midst of ongoing concerns about a possible global economic slowdown and subsequent recession, U.S. earnings growth estimates for 2023 have declined to just 2.1%, down from 5.6% as recently as December.1 Focusing on just the fourth quarter, earnings are expected to decline 4.6% on a year-over-year basis. Lower earnings estimates have pushed the forward 12-month price-to-earnings ratio of the S&P 500 back up to 17.5x, below the five-year average of 18.5x but above the 10-year average of 17.2x.1 More than 325 S&P 500 companies cited the term “inflation” during their fourth-quarter earnings calls, which is well above the five-year average of 201.2 Despite these persistent concerns, this represented the lowest number of companies citing inflation concerns since the third quarter of 2021.2
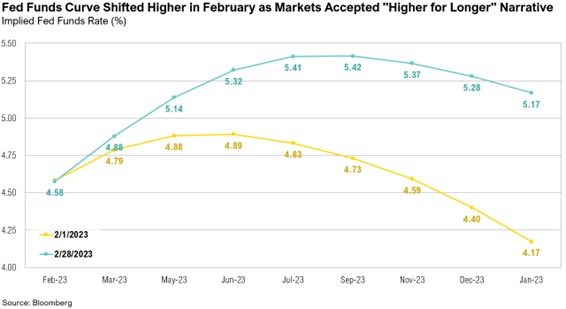
On February 1, the Federal Reserve hiked interest rates by 0.25% to 4.75%, slowing the pace from the 0.5% hike in December, itself a smaller hike than the 0.75% hikes done in the prior four meetings.3 Despite the reduced pace, markets were caught off guard by a combination of stubbornly high inflation and the unexpected jump in consumer spending data in January, compared to its weak showing at the end of 2022.4 As a result, markets quickly moved up their expectations of the future path of Fed interest rates, as proxied by the Fed Funds futures market. On January 30, expectations were that rates would reach a peak of 4.93% by June 2023 and drop down to 4.51% by the end of the year. However, by the end of February, estimates were for rates to reach a high of 5.42% in September and end 2023 at 5.17%.
The Consumer Price Index (CPI) increased by 0.5% in January, rising 6.4% from a year ago. Between the Global Financial Crisis and the 2020 COVID-19 pandemic, there have only been five other month-over-month increases of 0.5% or higher for the headline inflation reading.5 As inflation in the U.S. remains well above the Fed’s target of 2%, the interplay between economic activity—wages, spending, and corporate earnings—in nominal and in real (inflation-adjusted) measures becomes equally important and perplexing. Now, markets face the unusual challenge of accounting for this apparently strong nominal activity—which would be better news, were it not for the considerable erosion in purchasing power over the past 12 months.
The Money Illusion
“Inflation is when you pay $15 for the $10 haircut that you used to get for $5 when you had hair.”
—Sam Ewing.6
One of the great challenges over the past year has been determining inflation’s impact on economic data and on capital markets. As inflation moderates from decades-high levels, an increasingly challenging task will be determining the path of inflation and the trajectory of economic activity after inflation is taken into account. An economic theory known as the money illusion states that individuals tend to view their income in nominal terms, instead of real (or inflation-adjusted) terms, and thus they ignore the effect of inflation on their wealth.7 The money illusion theory can also be applied to overall economic activity, which is reported nominally. The impact of inflation on wages, sales, and earnings needs to be accounted for to accurately gauge economic growth in an inflationary environment. For investors, the stakes are high. Higher inflation results in higher nominal activity, higher corporate revenues, and potentially even higher profits, but the value that investors assign to every dollar of earnings can be lower—potentially substantially so.
Despite the Federal Reserve’s aggressive rate-hiking cycle, bringing rates from 0.25% last January to their current 4.75%, the U.S. economy has been surprisingly resilient.8 After a muted holiday spending period, retail sales rebounded significantly in January.9 This, combined with a strong January jobs report (which saw unemployment sink to the lowest levels since May 1969) and a rebound in consumer spending, renewed hopes that a recession could be avoided and the economy would enjoy a soft landing.10 The unexpected strength in spending data was summarized well by Visa CEO Ryan McInerney:
“But when we look at our data around the world globally, by country, by product, by consumer segment, it is remarkably stable…So resilient, stable, consistent, that's what we're seeing in our data around the world." 11
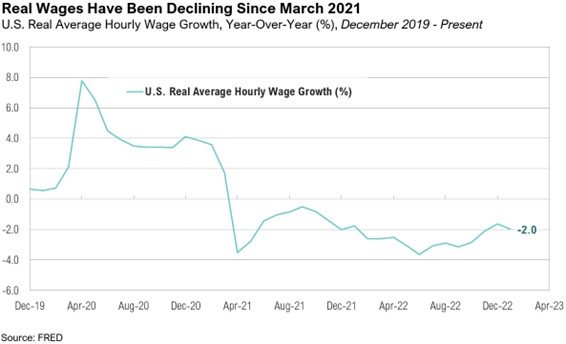
However, when things seem too good to be true, they often are. According to the Bureau of Labor Statistics, average hourly wages increased by 4.4% in January 2023, compared to the same time a year ago.12 In reality, however, real wage growth has been negative since March 2021, and when adjusted for inflation, wage growth has declined by 1.8% year-over-year.12
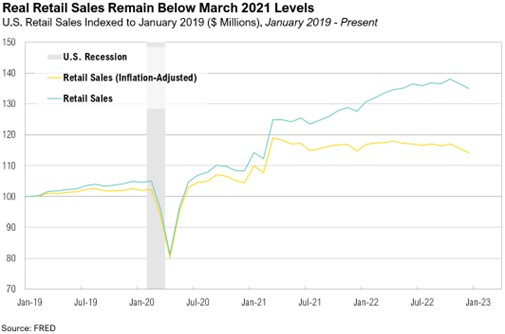
Retail sales measured before and after the impact of inflation provide another clear example of this phenomenon. After two consecutive months of decline, retail sales increased by the most in almost two years in January, jumping 3.0%.9 However, because these figures are not adjusted for inflation, any perceived gains over the last year are illusory, eaten away by higher prices.
Retail sales may have been strengthened by lingering excess savings from COVID-era stimulus checks, as well as a steady uptick in credit card debt, which hit a new high of $986 billion in the fourth quarter of 2022.13 In addition, a cost-of-living adjustment of 8.7%, which came into effect in January, could also have contributed to the short-term boost in sales.14 Measuring retail sales in real terms represents a more accurate gauge of the impact of inflation on consumers’ purchasing power. When adjusted for inflation, retail sales have remained relatively flat and are currently below March 2021 levels.
When broken down into retailer-specific categories, the impact of inflation on spending levels becomes even clearer. The chart below shows the difference between real and nominal sales by retail category between January 2022 and January 2023.
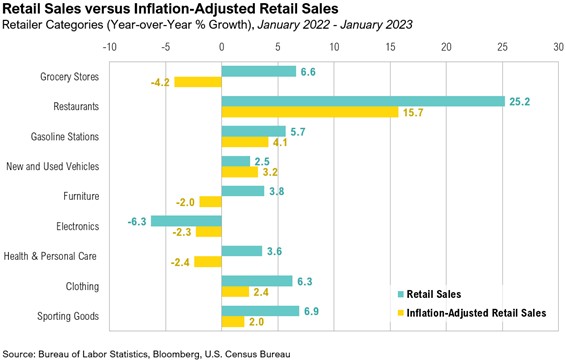
This difference is most profound in the food category. Consumers may be spending 6.6% more on groceries, but they are taking home 4.2% less groceries than they did a year ago, as inflation erodes the purchasing power of consumers and the value of the dollar. Sales of health and personal care (such as pharmacies and drugstores) reveal a similar dynamic. Consumers are spending 3.6% more on personal care items but taking home 2.4% less than they did twelve months ago. Sales of electronic items, such as televisions and smartphones, skyrocketed during the pandemic and have declined significantly over the past twelve months as consumers have shifted their spending to other categories.
One area where consumers are not cutting back is dining out. The 25.2% year-over-year increase in spending at restaurants has seen a still-impressive, inflation-adjusted increase of 15.7%. There are, of course, several factors that could account for this increase, as demand for dining out skyrocketed after the pandemic. Dining out is also influenced by seasonal factors, such as the recent warmer weather.15 Another area where consumers are spending more is on clothing items (+2.4%) and recreational items (+2.0%), which includes sporting goods and hobby items.
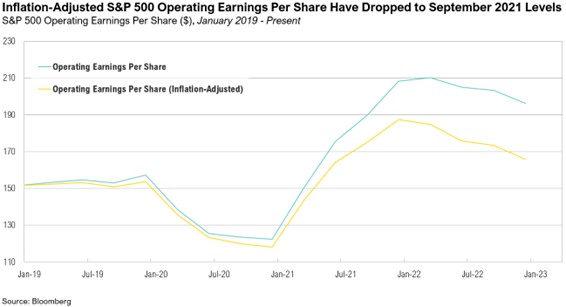
Inflation also influences the performance of companies. S&P 500 operating earnings per share have grown approximately 30% since January 2019. However, when adjusted for inflation, earnings have only grown 10% over the past three years. Earnings per share peaked at the end of March 2022 and have since declined to December 2021 levels; however, when adjusted for inflation, real earnings peaked in December 2021 and are now back below September 2021 levels. S&P 500 earnings expectations for 2023 are currently at 2.1%.1 If inflation remains above the Fed’s 2% target for the rest of the year, real earnings growth may be negative for the remainder of 2023.
Markets
February was a short and not-so-sweet month in the markets. Both U.S. and international equity markets posted negative returns in February. The MSCI EAFE Index ended the month down 2.1%, while the S&P 500 ended the month down 2.4%. Emerging market equities fared the worst. The MSCI Emerging Market Index declined 6.5% in February, erasing almost all the gains made in January. The Bloomberg U.S. Aggregate Bond Index dropped 2.6% in January. The 10-year minus 2-year Treasury yield (which is a common indicator of economic growth and a general representation of the shape of the Treasury yield curve) remains deeply inverted, ending February at -0.89, one of the lowest readings since the early 1980s.16
Looking Forward
Protecting assets against inflation—preserving purchasing power—is arguably the first and most important objective of any long-term investment program. Over longer time horizons cash seldom outperforms other longer duration assets, including stocks and bonds. In fact, since 1920, a dollar sitting idle in cash would have lost 94% of its purchasing power, whereas a dollar invested in the stock market would be worth approximately $1,365.17
Realizing that inflation posed a serious and sustained economic threat, the Federal Reserve rapidly tightened monetary conditions. Even though inflation has somewhat slowed, February’s events suggest that still more work needs to be done. The longer elevated inflation lingers, the more it can hurt consumers, given their continued negative real wages. However, this additional tightening will occur when neither the economy nor the capital markets has fully adjusted to the impact of tighter monetary policy, the effects of which typically take some time to work their way through the system. Whether the Fed can accomplish its balancing act will determine if the anticipated recession is an illusion or not.
At RMB, we believe there will be continued volatility in both equity and fixed income markets, as the Federal Reserve continues with their plan to increase interest rates in order to mitigate above average inflation. This environment of decades high inflation and rising interest rates are putting pressure on global growth. The labor market has thus far remained resilient, and inflation will probably continue to be sticky for longer than the Fed would like. The trajectory of inflation from here appears to be down but the pace at which the declines occur remains a key component to Federal Reserve policy going forward.
Incoming economic data and the policy developments they help shape are fluid and highly uncertain. While we wait for clarity on these topics, for the first time in more than 15 years, we can earn 4% to 5% on short-term government bonds. We continue to believe that strong fundamentals should help markets over the longer term and that the income component of our client’s investment portfolios – the interest paid from owning bonds and stock dividends – will be a more important factor of investment returns going forward. While we think that the longer-term outlook will continue to improve as yields rise and stocks get cheaper, we would caution that 2023 could be another challenging year for investors. We recommend sticking to long-term investment allocation targets through a diversified portfolio of assets that emphasizes quality and cash flow and taking advantage of rebalancing opportunities as they emerge amongst the volatility. We remain optimistic that the strategies we have in place for our clients will drive long-term success despite the volatility we are currently experiencing.
Citations
1. FactSet: https://insight.factset.com/larger-cuts-than-average-to-eps-estimates-for-sp-500-companies-for-q1-to-date
2. FactSet: https://insight.factset.com/are-fewer-sp-500-companies-concerned-about-inflation
3. Federal Reserve: https://www.federalreserve.gov/newsevents/pressreleases/monetary20230201a1.htm
4. WSJ: https://www.wsj.com/articles/godot-recession-federal-reserve-powell-d50ba71f
5. FRED: https://fred.stlouisfed.org/series/CPIAUCSL#0
6. GoodReads: https://www.goodreads.com/quotes/464420-inflation-is-when-you-pay-fifteen-dollars-for-the-ten-dollar
7. CFI: https://corporatefinanceinstitute.com/resources/economics/money-illusion/
8. Macrotrends: https://www.macrotrends.net/2015/fed-funds-rate-historical-chart
9. U.S. Census Bureau: https://www.census.gov/retail/sales.html
10. CNBC: https://www.cnbc.com/2023/02/16/economists-worry-about-a-recession-but-a-soft-landing-may-be-possible.html
11. Seeking Alpha: https://seekingalpha.com/article/4584443-visa-inc-v-presents-kbw-fintech-payments-conference-transcript
12. Bureau of Labor Statistics: https://www.bls.gov/news.release/realer.t01.htm
13. New York Fed: https://www.newyorkfed.org/newsevents/news/research/2023/20230216
14. SSA: https://www.ssa.gov/oact/cola/latestCOLA.html
15. WSJ: https://www.wsj.com/articles/us-economy-retail-sales-january-2023-b59cb036
16. FRED: https://fred.stlouisfed.org/series/T10Y2Y
17. SpringTide calculation
Index Definitions
The S&P 500 Index is widely regarded as the best single gauge of the United States equity market. It includes 500 leading companies in leading industries of the U.S. economy. The S&P 500 focuses on the large cap segment of the market and covers approximately 75% of U.S. equities.
The Bloomberg Barclays U.S. Aggregate Index represents securities that are SEC-registered, taxable, and dollar denominated. The index covers the U.S. investment grade fixed rate bond market, with index components for government and corporate securities, mortgage pass-through securities, and asset-backed securities. Duration is roughly 5 years.
The Bloomberg U.S. Corporate High Yield Bond Index measures the USD-denominated, high yield, fixed-rate corporate bond market. Securities are classified as high yield if the middle rating of Moody’s, Fitch and S&P is Ba1/BB+/BB+ or below. Bonds from issuers with an emerging markets country of risk, based on the indices’ EM country definition, are excluded.
The Russell 1000® Value Index measures the performance of the large-cap value segment of the U.S. equity universe. It includes those Russell 1000 companies with lower price-to-book ratios and lower expected and historical growth rates.
The Russell 1000® Growth Index measures the performance of the large- cap growth segment of the US equity universe. It includes those Russell 1000 companies with relatively higher price-to-book ratios, higher I/B/E/S forecast medium term (2 year) growth and higher sales per share historical growth (5 years).
The Russell 2000® Index measures the performance of the small-cap segment of the US equity universe. It includes approximately 2000 of the smallest US equity securities in the Russell 3000 Index based on a combination of market capitalization and current index membership. The Russell 2000 Index represents approximately 10% of the total market capitalization of the Russell 3000 Index. Because the Russell 2000 serves as a proxy for lower quality, small cap stocks, it provides an appropriate benchmark for RMB Special Situations.
MSCI EAFE Index*: an equity index which captures large and mid-cap representation across 21 of 23 Developed Markets countries around the world, excluding the U.S. and Canada. With 926 constituents, the index covers approximately 85% of the free float-adjusted market capitalization in each country.
The MSCI Emerging Markets Index* measures equity market performance in the global emerging markets universe. It covers over 2,700 securities in 21 markets that are currently classified as EM countries. The MSCI EM Index universe spans large, mid and small cap securities and can be segmented across all styles and sectors.
The U.S. Dollar Index is used to measure the value of the dollar against a basket of six foreign currencies: the euro, Swiss franc, Japanese yen, Canadian dollar, British pound, and Swedish krona.
The Deutsche Bank EM FX Equally Weighted Spot Index, an equal-weighted basket of 21 emerging market currencies.
MSCI U.S. REIT Index is a free float-adjusted market capitalization weighted index that is comprised of equity Real Estate Investment Trusts (REITs). The index is based on the MSCI USA Investable Market Index (IMI), its parent index, which captures the large, mid and small cap segments of the USA market. With 150 constituents, it represents about 99% of the US REIT universe and securities are classified under the Equity REITs Industry (under the Real Estate Sector) according to the Global Industry Classification Standard (GICS®), have core real estate exposure (i.e., only selected Specialized REITs are eligible) and carry REIT tax status.
*Source: MSCI.MSCI makes no express or implied warranties or representations and shall have no liability whatsoever with respect to any MSCI data contained herein. The MSCI data may not be further redistributed or used as a basis for other indexes or any securities or financial products. This report is not approved, endorsed, reviewed or produced by MSCI. None of the MSCI data is intended to constitute investment advice or a recommendation to make (or refrain from making) any kind of investment decision and may not be relied on as such.
Performance Disclosures
All market pricing and performance data from Bloomberg, unless otherwise cited. Asset class and sector performance are gross of fees unless otherwise indicated.
The opinions and analyses expressed in this newsletter are based on RMB Capital Management, LLC’s (“RMB Capital”) research and professional experience are expressed as of the date of our mailing of this newsletter. Certain information expressed represents an assessment at a specific point in time and is not intended to be a forecast or guarantee of future results, nor is it intended to speak to any future time periods. RMB Capital makes no warranty or representation, express or implied, nor does RMB Capital accept any liability, with respect to the information and data set forth herein, and RMB Capital specifically disclaims any duty to update any of the information and data contained in this newsletter. The information and data in this newsletter does not constitute legal, tax, accounting, investment or other professional advice. Returns are presented net of fees. An investment cannot be made directly in an index. The index data assumes reinvestment of all income and does not bear fees, taxes, or transaction costs. The investment strategy and types of securities held by the comparison index may be substantially different from the investment strategy and types of securities held by your account. RMB Asset Management is a division of RMB Capital Management.