

Overview
The quarter was filled with so many colorful events that it made the first three months of 2021 feel like an entire year. In the end, investors had much to celebrate—equity returns were decidedly positive, and both fiscal and monetary policymakers reiterated their extraordinary accommodative stances. An even bigger reason to throw confetti has been the continued great work of healthcare professionals, essential workers, and vaccine developers. To date, more than 109 million Americans have received at least one dose of the COVID-19 vaccine, which is a remarkable feat given the virus hit the U.S. just over one year ago.1
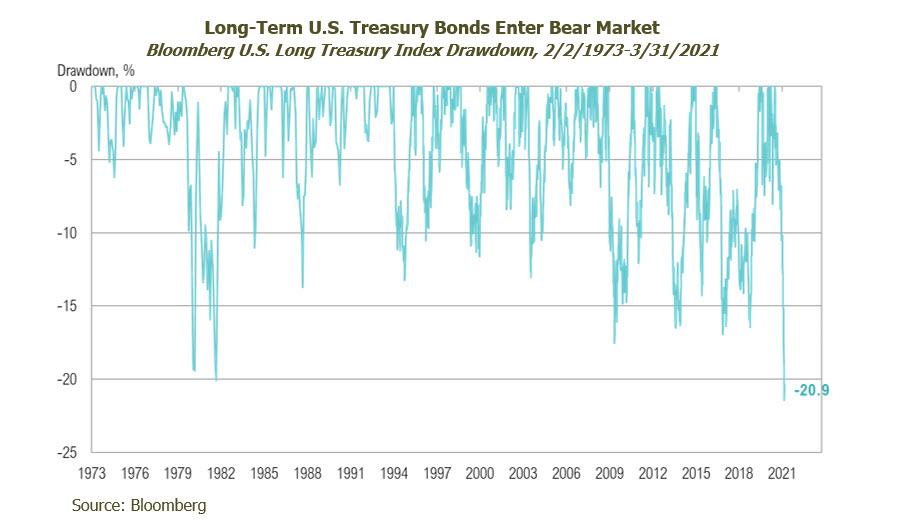
Although as the S&P 500 Index was up 6% and other risk assets such as commodities were up nearly 7%, the bond market was unusually weak throughout the first quarter of 2021.2 The Bloomberg Barclays U.S. Aggregate Bond Index lost 3%, posting its worst quarterly loss since the third quarter of 1981, when it lost 4%.2 To put this return into perspective, there have only been three quarters in its history—all in 1980 and 1981—that the index has lost more than 3%. During the quarter, the 10-Year Treasury yield increased to a high of 1.75%. While the move seems insignificant in absolute terms, the relative increase is one of the most drastic in history and has brought the Treasury market, as proxied by the Bloomberg Barclays U.S. Treasury Index, into bear market territory (declining by over 20% from peak prices last year). The move in rates is not that surprising given the recent confluence of factors: multi-trillion-dollar stimulus and the vaccine rollout jump-starting growth as well as the Federal Reserve’s formal notice to markets that it is willing to tolerate higher inflation. That said, the magnitude and swiftness of the recent move is historically unrivaled.2
In addition to COVID-19 vaccine developments and the Federal Reserve’s willingness to err on the side of higher inflation, the unwinding of a program modification enacted during the depths of the crisis, the Supplementary Leverage Ratio (“SLR”), may have also contributed to higher interest rates. An alteration to the SLR was implemented on May 15, 2020 and was designed to ease Treasury market strains and promote lending to households and businesses.3 The adjustment allowed banks flexibility in what assets they could hold to meet regulatory requirements. More specifically, the Federal Reserve allowed banks to exclude Treasuries and cash from their capital requirement calculation. In the past several weeks, Senators Elizabeth Warren and Sherrod Brown made their views public on why the modified SLR should be allowed to expire. On March 19, the Federal Reserve announced it would let the modified SLR expire on March 31.4
From a fiscal and monetary policy perspective, there were a couple developments that were cause for investor celebration. First, fiscal policy makers passed the American Rescue Plan Act of 2021.5 This $1.9 trillion spending bill included $411 billion in direct payments to individuals, which resulted in $1,400 being sent to individual taxpayers earning up to $75,000 ($2,800 for married couples earning up to $150,000), plus an additional $1,400 per qualified child. The payments phase out for incomes up to $80,000 ($160,000 for married couples).6
On the monetary policy side, the Federal Reserve did not make any new announcements, but the fact that it maintained its stance and reiterated it would do so for the foreseeable future, was noteworthy. In its March meeting, the Federal Open Market Committee (FOMC) conveyed, through its dot plot projections, that it would likely keep its federal funds rate at zero through 2023.7 Furthermore, the committee reiterated its practice of conducting $120 billion of bond purchases per month, a pace that was never reached heading into or out of the credit crisis of 2008-09. The FOMC also released its “Summary of Economic Projections,” which included its participants’ expectations that the federal funds rate would remain at 0% through at least 2022.8 On March 19, the Wall Street Journal published an article written by Jerome Powell in which he wrote, “But the recovery is far from complete, so at the Fed we will continue to provide the economy with the support that it needs for as long as it takes.”9 That support continues to result in vast sums of money being pumped into capital markets and the economy.
There were several other events that occurred during the quarter that reveal the unintended consequences of such abundant liquidity. In January, several so-called “meme stocks” sparked a revolution of sorts. The top performing of these was short-squeezed GameStop, which jumped more than 1,000% when traders launched a coordinated buying raid on the stocks of companies that were contending with an unusual amount of short-selling. These raids in turn overwhelmed the supply of shares available to buy, leading to rapid price increases. Melvin Capital, a $12 billion hedge fund, came under liquidation pressure due to the meteoric rise of stocks like GameStop.10 The fund was down 53% in January due to its short exposure (attempting to profit from a decline in the stock price) and required a bailout from high-profile investors such as Steven A. Cohen and Citadel.10
Also at the center of the melee was the free stock trading app, Robinhood. As a self-proclaimed champion for the small and first-time investor, the company came under scrutiny for the way it handled its customers’ ability to trade stocks at the epicenter of Melvin’s malaise, along with the hundreds of millions of dollars it generates from selling trade order flow to market makers. In the aftermath of the market dysfunction and Congressional hearings on the subject, Robinhood reassessed the animated celebrations on its app, ultimately deciding to remove the digital confetti that had appeared after users made their first trade.11
Late in the quarter, Archegos Capital suffered tens of billions in losses in media stocks such as ViacomCBS, Discovery, and Tencent after it was discovered the firm was engaged in highly leveraged speculative bets on these stocks.12 The firm was able to ramp up its exposure to multiples of its actual capital base by using over-the-counter synthetic stock positions, which is why the unwind caught the market off guard. Some of those hit hardest in the unravelling were Archegos’ counterparties, Nomura and Credit Suisse. Nomura’s stock price endured its largest daily loss in history after the estimated $2 billion in losses, as a result of exposure to Archegos, was disclosed.13 Credit Suisse disclosed a loss of $4.7 billion and announced a dividend cut as a result.14
While all of these events seem isolated and may lack the scale required to derail a global market recovery, there is a common thread: a trend toward increasing levels of risk-seeking behavior and a reduced focus on risk management.
Monetary Policy Considerations
It is unlikely that the Federal Reserve is overly concerned by the rise in long-term interest rates to date, especially given its indifference to the move implied by the S&P 500 pushing through 4,000 to new all-time highs in early April. That said, the Fed may have already begun to use its various tools to slow the pace of the rise. On March 17, the FOMC kept in place the $120 billion per month in purchases of Treasury and agency mortgage-backed securities.15 This consistent source of buying may prove to be a meaningful factor in the shape of the yield curve in the quarters ahead.
Of the $120 billion in fixed income securities being purchased by the Fed every month, $80 billion are U.S. Treasuries. Considering that the U.S. Treasury issued approximately $400 billion in bonds during the first quarter, the Fed effectively monetized 60% of total issuance.16 In the second quarter, the Treasury expects issuance to be just $95 billion, implying effective monetization of roughly three times the amount to be issued. While issuance is generally low in the second quarter due to federal tax receipts, it remains especially low in 2021 because the Treasury began the year with a colossal $1.7 trillion in cash. As of the end of March, the Treasury had a cash balance of $1.1 trillion.17
Looking Forward
At the end of the quarter, the Biden Administration announced an infrastructure plan, the American Jobs Plan, and the Made in America Tax Plan.18 The infrastructure spending bill seeks to invest $2 trillion over the next decade, with 1% of GDP per year invested in infrastructure over the next eight years. The tax plan is designed to fund a portion of the investment by increasing the corporate tax rate to 28% and increasing the minimum tax on U.S. companies to 21%, to prevent multi-national U.S. companies from receiving an exemption on foreign asset returns. It is clear policymakers want nothing more than to keep accommodation at unsustainable levels for as long as they can. A key to this is the Federal Reserve’s ability to continue to monetize these enormous spending bills. Currently, capital markets appear willing to tolerate this path as risky assets and the U.S. dollar are relatively stable. Interest rates, too, are well-contained relative to history, even taking into account the recent rise.
From our viewpoint, inflation will continue to be the most important metric to watch for an indication of when the confetti will stop getting thrown—that is, when monetary and fiscal policy accommodation may need to be toned down. In the coming months, data on inflation will be hard to gauge as it will reflect not only substantial recent stimulus but also the “low base effect”—meaning, the numbers will be inflated based on their comparison to those witnessed during the onset of the pandemic. Even more important than the data itself will be investors’ reaction to it. As long as inflation remains contained, policymakers can continue to spend and monetize, and investors may be able to continue to throw the confetti. The rally in risk assets is likely to persist amid promises of fiscal stimulus from the White House and the continued distribution of vaccines. However, we believe most fixed income securities—in particular, higher-quality bonds—will produce returns significantly below their historical average. Some fixed income investments may produce negative returns over short time periods.
With all of this in mind, we will strive to balance opportunities in the current environment while remaining cognizant of the increasing risks. RMB believes this is a good time for investors to evaluate exposures in portfolios. As always, we recommend maintaining diversified portfolios of investments that anticipate a broad range of outcomes. During this time, we recommend overweighting non-U.S. equities within global equity portfolios, and we favor small companies over large-capitalization companies. Given the ongoing rally in markets around the world, we continue to focus on dislocations in various niche markets that present attractive risk/reward opportunities.
1CDC: https://covid.cdc.gov/covid-data-tracker/#vaccinations
2Bloomberg
3Federal Reserve: https://www.federalreserve.gov/newsevents/pressreleases/bcreg20200515a.htm
4Federal Reserve: https://www.federalreserve.gov/newsevents/pressreleases/bcreg20210319b.htm
5CBS: https://www.cbsnews.com/news/biden-signs-covid-relief-bill-american-rescue-plan-into-law/
6CBS: https://www.cnbc.com/2021/03/25/1400-dollar-stimulus-checks-went-to-some-people-who-do-not-need-them.html
7CNBC: https://www.cnbc.com/2021/03/17/heres-where-the-federal-reserve-sees-interest-rates-the-economy-and-inflation-going-in-the-future.html
8Federal Reserve: https://www.federalreserve.gov/monetarypolicy/fomcprojtabl20210317.htm
9WSJ: https://www.wsj.com/articles/feds-powell-says-recovery-is-far-from-complete-11616445093
10CNBC: https://www.cnbc.com/2021/01/31/melvin-capital-lost-more-than-50percent-after-betting-against-gamestop-wsj.html
11Bloomberg: https://www.bloomberg.com/news/articles/2021-03-31/robinhood-ditches-its-confetti-animation-following-criticism
12WSJ: https://www.wsj.com/articles/what-is-archegos-and-how-did-it-rattle-the-stock-market-11617044982
13Nomura: https://www.nomuraholdings.com/investor/library/sec/6k/210329/210329.pdf
14Credit Suisse: https://www.credit-suisse.com/about-us-news/en/articles/media-releases/trading-update-202104.html
15Federal Reserve: https://www.federalreserve.gov/newsevents/pressreleases/monetary20210317a1.htm
16New York Fed: https://www.newyorkfed.org/markets/domestic-market-operations/monetary-policy-implementation/treasury-securities/treasury-securities-operational-details
17U.S. Department of the Treasury: https://fsapps.fiscal.treasury.gov/dts/files/21033100.txt
18The White House: https://www.whitehouse.gov/briefing-room/statements-releases/2021/03/31/fact-sheet-the-american-jobs-plan/
All market pricing and performance data from Bloomberg, unless otherwise cited. Asset class and sector performance are gross of fees unless otherwise indicated.
The opinions and analyses expressed in this newsletter are based on RMB Capital Management, LLC’s (“RMB Capital”) research and professional experience and are expressed as of the date of our mailing of this newsletter. Certain information expressed represents an assessment at a specific point in time and is not intended to be a forecast or guarantee of future results, nor is it intended to speak to any future time periods. RMB Capital makes no warranty or representation, express or implied, nor does RMB Capital accept any liability, with respect to the information and data set forth herein, and RMB Capital specifically disclaims any duty to update any of the information and data contained in this newsletter. The information and data in this newsletter does not constitute legal, tax, accounting, investment, or other professional advice. Returns are presented net of fees. An investment cannot be made directly in an index. The index data assumes reinvestment of all income and does not bear fees, taxes, or transaction costs. The investment strategy and types of securities held by the comparison index may be substantially different from the investment strategy and types of securities held by your account. The S&P 500 Index is widely regarded as the best single gauge of the U.S equity market. It includes 500 leading companies in leading industries of the U.S. economy. The S&P 500 focuses on the large cap segment of the market and covers 75% of U.S. equities. The Bloomberg Barclays U.S. Aggregate Bond Index is a broad-based flagship benchmark that measures the investment grade, U.S. dollar-denominated, fixed-rate taxable bond market. The index includes Treasuries, government-related and corporate securities, MBS (agency fixed-rate pass-throughs), ABS and CMBS (agency and non-agency). The Bloomberg Barclays U.S. Treasury Index measures U.S. dollar-denominated, fixed-rate, nominal debt issued by the U.S. Treasury with 10 years or more to maturity.