Overview
A dawning economic recovery and further stimulus hopes helped drive strong returns for U.S. small cap stocks, emerging market stocks, and energy assets in January. The rest of the major asset classes generated mixed results. Heading into February, however, the broad rally in risky assets became more frenetic as various markets took turns vying for the most remarkable and newsworthy. The competition was fierce. The U.S. stock market, as proxied by the S&P 500 Index, hit an impressive six-day winning streak in early February that took the index to an all-time high on February 8. The move pulled its price-to-earnings ratio (using trailing twelve-month reported earnings) to 39.8 times as of February 9, a valuation level only surpassed by a brief window of time at the end of the tech bubble.1 Valuations based on more commonly quoted operating earnings are lower, at 26.9 times, but they are still extremely elevated.1 Credit markets are similarly priced for near perfection. On February 8, the yield on the Bloomberg Barclays U.S. Corporate High Yield Index dropped to 3.96%, the lowest level in history.2
Recent Events
Under the surface, capital markets tell an even more astonishing story. In January, several so-called “meme stocks” sparked a revolution of sorts.3 The top performing of these was short-squeezed GameStop, which jumped 1,625% and consequently gained the attention of high-profile figures, including Treasury Secretary Janet Yellen, Representative Alexandria Ocasio-Cortez, Senator Ted Cruz, and internet celebrity David Portnoy. Even the White House responded, with a comment from press secretary Jen Psaki saying key officials were “monitoring the situation.”4 A congressional hearing on the incident is scheduled for February 18.5
The meme stock trend is the product of a perfect storm of conditions: vast online communities connected through social media, the rise of commission-free online stock trading platforms, and a global pandemic that has left people stuck at home with more free time on their hands. GameStop resembles several other short squeezes in which traders launched a coordinated buying raid on the stocks of companies that were contending with an unusual amount of short-selling (the percentage of the company’s total market capitalization that has been sold short). These raids in turn overwhelmed the supply of shares available to buy, leading to rapid price increases. As GameStop proved, these squeezes can be stunningly effective; however, once the online mob loses interest and moves on, these stocks generally decline in price equally impressively. As of market close on February 9, GameStop was trading at $50.31, a 90% decline from its intraday high of $513.12 on January 28. According to Bloomberg, GameStop is expected to post negative earnings of $136 million on an adjusted basis in 2021.6
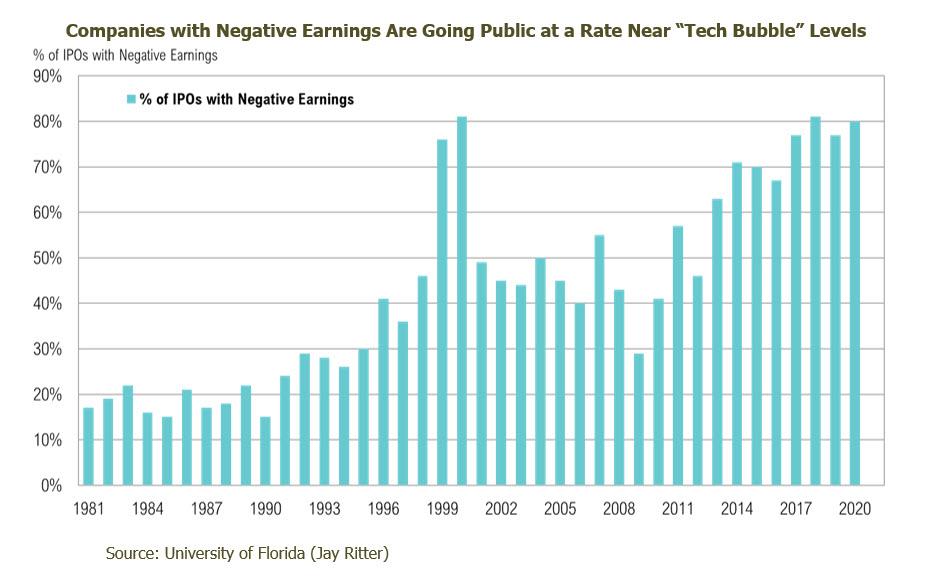
There are more examples of frenetic behavior. According to Bloomberg, January was the busiest start to the year ever for initial public offerings (IPOs) with $63 billion of equity raised.7 According to data compiled by University of Florida professor, Jay Ritter, these IPOs are also increasingly launched by money-losing companies. In 2020, over 80% of IPOs lost money in the twelve months leading up to their offerings.8 The IPO boom has been helped by a record $26 billion of issuance by Special Purpose Acquisition Companies (SPACs), commonly referred to as “blank-check” companies. The frenzied issuance has continued into 2021. For the year to date through February 10, 131 SPACs have gone public and raised $38.3 billion.9
SPACs have been around since the 1990s but have only recently become popular with larger investors. At their best, they are an efficient way for private companies to tap public markets for liquidity without having to navigate the costly and onerous IPO process. Recent SPAC announcements include Shaquille O’Neal’s Forest Road Acquisition Corp., which plans to take the Beachbody fitness brand public. On February 5, Yankees star Alex Rodriguez filed to raise up to $575 million for a SPAC called Slam Corp., which will seek out acquisition targets in the “sports, media and entertainment, technology, and health and wellness industries.” More recently, on February 9, it was announced that Colin Kaepernick would raise $250 million for Mission Advancement Corp., which intends to acquire a company at “the intersection of consumer and impact.” In addition to the uptick in hazy yet grand pronouncements like these, investors are eagerly bidding up these pools of capital, often above the value of their assets, purely on the hopes of future, as-yet-to-be-identified business opportunities. Even though SPAC issuers are not required to earmark, disclose, or even know where the capital they are raising will be deployed, SPAC deals in 2021 recorded an average jump of 6.5% in their debuts, a nearly sixfold increase relative to their long-term average.10
Not to be outdone, cryptocurrency markets also rocketed to feverish new highs in recent weeks as investors rushed into bitcoin and Ethereum (ether), among others. On February 8, bitcoin jumped to over $47,000 per coin (up 65% this year alone) on news that Tesla had accumulated $1.5 billion worth of bitcoin and had plans to accept it as payment for its cars. That investment represented a non-trivial portion of the company’s estimated $19 billion in corporate treasury. As the prospects for persistent low or negative rates around the world increase, even central banks want in on the digital coin craze. According to the Bank for International Settlements (BIS), 80% of central banks are looking at the pros and cons of central bank digital coins (CBDCs).11
U.S. government bond markets continued their drift lower as longer-term interest rates persistently, albeit slowly, inched higher. (Bond prices and yields move inversely.) In absolute terms, yields remain exceptionally low. The 1.06% yield on the 10-year Treasury was still lower than at any point prior to the COVID-19 pandemic. As for short-term interest rates, cash yields remain near all-time lows when adjusted for inflation.
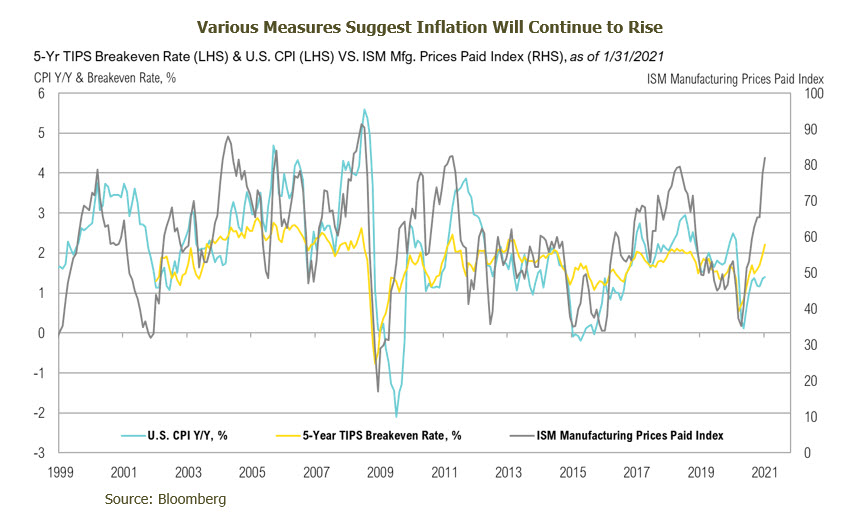
Speaking of inflation, the same underlying forces that pushed asset returns higher in January also increased concerns about inflation. The five-year Treasury Inflation Protection Security (TIPS) breakeven inflation rate, a measure of the level of inflation expected by the bond market, rose from 1.95% on December 31 to 2.31%, an almost eight-year high. Inflationary pressures are building across the economy due to record levels of stimulus, which has increased the money supply and, in turn, prices. This is evidenced by the almost 10-year high in the ISM Prices Paid Index. If inflation remains at these levels (or rises), it will erode the purchasing power of cash and government bonds. Viewed through this lens, even these traditional “safe havens” carry risk.
Looking Forward
The Federal Reserve is widely understood to have two primary goals—to support full employment and to maintain stable prices. On February 1, the Congressional Budget Office forecasted that the number of employed Americans, which came in at an even 150 million in January, would not recover to pre-pandemic levels until 2024. Given that the Fed has indicated it is not concerned with transitory inflation this year, high levels of unemployment mean it will likely continue those policies that have supported investors’ risk-taking behaviors—and, as a result, the frenetic tone of the early part of this year may continue, too. In terms of stimulus, Congressional Democrats are using “budget reconciliation” to move President Biden’s $1.9 trillion COVID-relief plan through the Senate, thereby eluding the threat of a filibuster, which would prevent a vote on the legislation until 60 senators agree to do so. This means COVID relief would require “yes” votes from only 51 senators. Congress has used the “budget reconciliation” process to enact 21 bills in the past 40 years.12
We continue to position our portfolios for higher inflation. To that end, we recommend maintaining diversified portfolios of investments that also provide inflation protection. We will strive to balance opportunities in the current environment while remaining cognizant of the increasing risks. Given the continued rally in stocks and other risk assets, RMB believes this is a good time for investors to evaluate exposures in portfolios as the possibility for a pullback increases for those investments. We will continue look for additional opportunities to selectively increase risk, if/when further stock market pullbacks develop. In the meantime, we continue to focus on dislocations in various niche markets that present attractive risk/reward opportunities.
1Yardeni Research: https://www.yardeni.com/pub/stockmktperatio.pdf
2Barrons: https://www.barrons.com/articles/junk-bonds-now-yield-less-than-4-a-record-low-heres-what-that-means-for-investors-51612888679
3Blooom: https://www.blooom.com/meme-stock-revolution/
4Reuters: https://www.reuters.com/article/us-gamestop-white-house/white-house-monitoring-situation-involving-gamestop-other-firms-idUSKBN29W2I1
5U.S. House Committee: https://financialservices.house.gov/news/documentsingle.aspx?DocumentID=407102
6Bloomberg
7Bloomberg: https://www.bloomberg.com/news/articles/2021-01-29/spac-listing-boom-drives-record-63-billion-january-for-ipos
8University of Florida: https://site.warrington.ufl.edu/ritter/ipo-data/
9WSJ: https://www.wsj.com/articles/the-spac-boom-visualized-in-one-chart-11612962000?mod=hp_lead_pos11
10CNBC: https://www.cnbc.com/2021/02/10/unusual-first-day-rallies-in-spacs-raise-bubble-concern-every-single-one-of-them-has-gone-up.html
11Federal Reserve: https://www.federalreserve.gov/econres/notes/feds-notes/central-bank-digital-currency-a-literature-review-20201109.htm
12Center on Budget and Policy Priorities
All market pricing and performance data from Bloomberg, unless otherwise cited. Asset class and sector performance are gross of fees unless otherwise indicated.
The opinions and analyses expressed in this newsletter are based on RMB Capital Management, LLC’s (“RMB Capital”) research and professional experience, and are expressed as of the date of our mailing of this newsletter. Certain information expressed represents an assessment at a specific point in time and is not intended to be a forecast or guarantee of future results, nor is it intended to speak to any future time periods. RMB Capital makes no warranty or representation, express or implied, nor does RMB Capital accept any liability, with respect to the information and data set forth herein, and RMB Capital specifically disclaims any duty to update any of the information and data contained in this newsletter. The information and data in this newsletter does not constitute legal, tax, accounting, investment or other professional advice. Returns are presented net of fees. An investment cannot be made directly in an index. The index data assumes reinvestment of all income and does not bear fees, taxes, or transaction costs. The investment strategy and types of securities held by the comparison index may be substantially different from the investment strategy and types of securities held by your account. The S&P 500 Index is widely regarded as the best single gauge of the U.S equity market. It includes 500 leading companies in leading industries of the U.S economy. The S&P 500 focuses on the large cap segment of the market and covers 75% of U.S. equities. Bloomberg Barclays U.S. Corporate High Yield Index is an unmanaged index that is composed of issues that meet the following criteria: at least $150 million par value outstanding, maximum credit rating of Ba1 (including defaulted issues), and at least one year to maturity. Bloomberg Commodity Spot Index formerly known as Dow Jones-UBS Commodity Spot Index (DJUBSSP), the index measures the price movements of commodities included in the Bloomberg CI and select subindexes. It does not account for the effects of rolling futures contracts or the costs associated with holding physical commodities and is quoted in USD. The Consumer Price Index (CPI) is a measure of the average change over time in the prices paid by urban consumers for a market basket of consumer goods and services. Goods and services are broken into 8 major categories: food and beverage, housing, apparel, transportation, medical care, recreation, education and communication, and other goods and services. ISM Manufacturing Prices Paid is one of the diffuse indicators, based on which the Supply Management Institute calculates the Manufacturing PMI. It reflects a change in prices paid by industry representatives for the products or services they receive.


