Markets
Treasury yields fell sharply in July, as fears of higher inflation, which had dominated investing discussions for months, began to dissipate. The U.S. 10-year Treasury yield fell below 1.2% for the first time since February 2021 and closed the month at 1.24%, a drop of 21 basis points from the start of the month. Interest-rate-sensitive assets rallied. Longer-term bonds outperformed short-term bonds, while U.S. growth stocks, led by the technology sector, returned 2.9%, beating their value counterparts by 3%. Growth stocks are generally considered to benefit more than their value counterparts during periods of declining rates. U.S. real estate investment trusts (REITs) gained 4.9%, as their yields declined to 2.1%, near the lowest level ever. Despite lower inflation expectations, gold bounced back modestly after a disappointing June, rising 4.0%.
Earnings Explosion
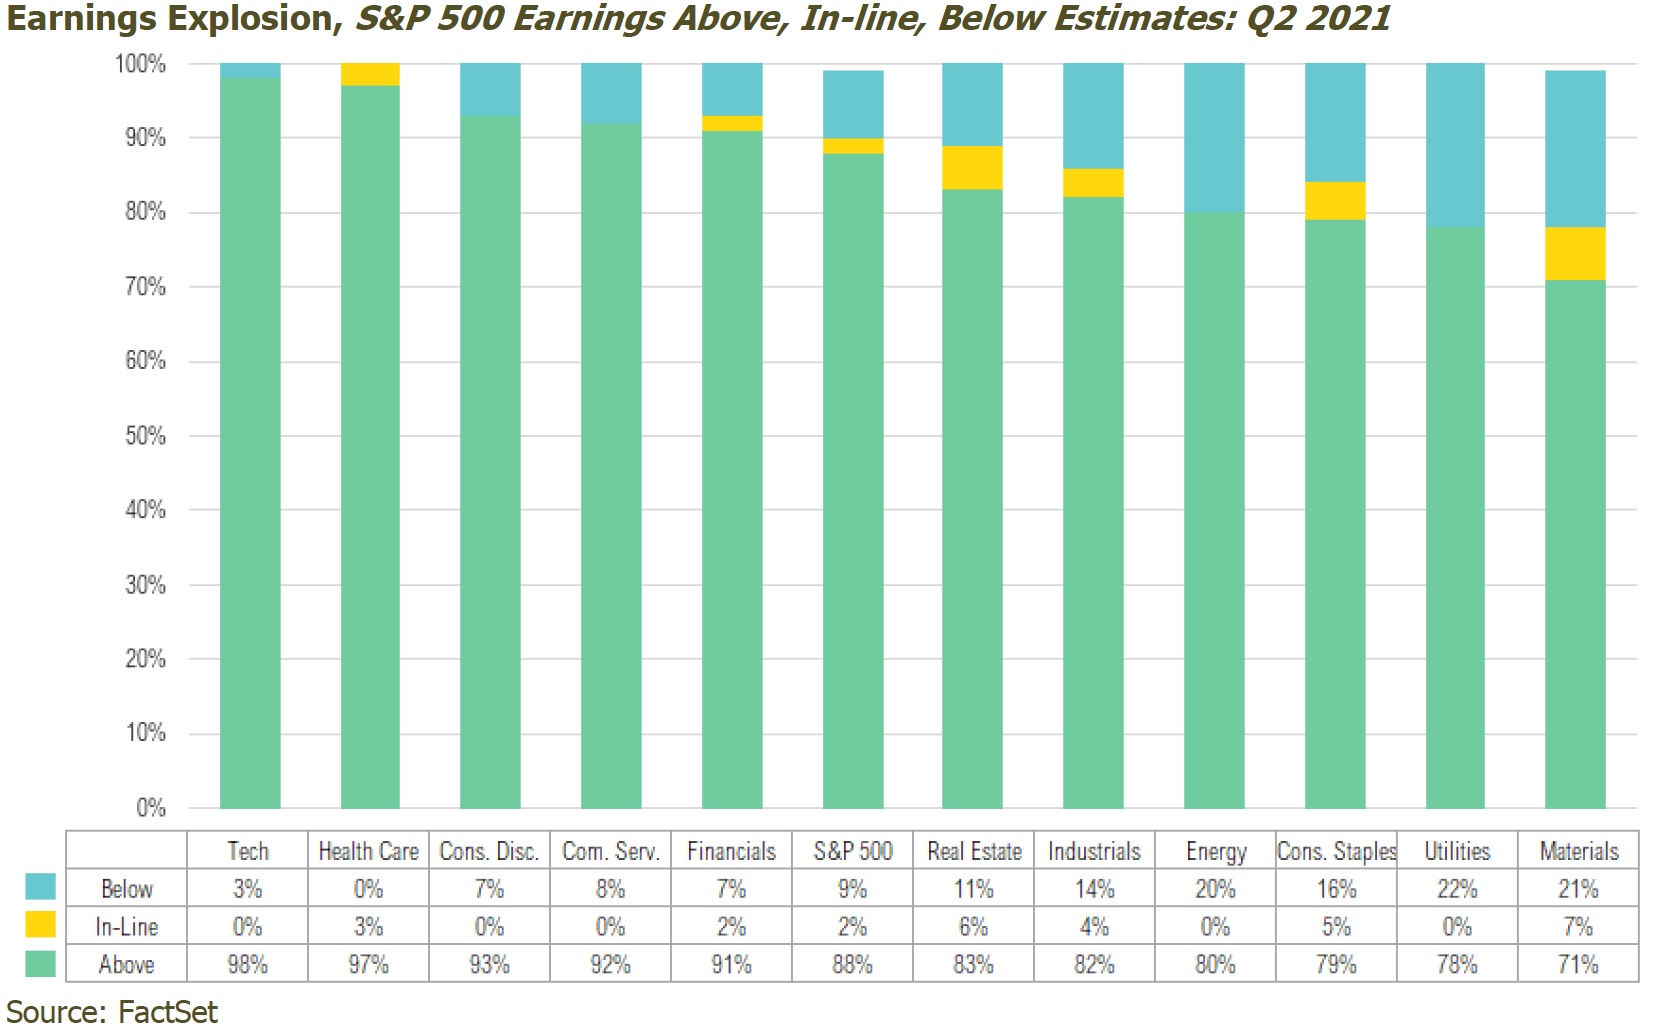
By the end of July, 59% of the companies in the S&P 500 had reported earnings for the second quarter, and results were overwhelmingly positive. According to FactSet, companies in the S&P 500 Index reported their highest year-over-year earnings growth since the fourth quarter of 2009, during the global financial crisis recovery.1 Although the size of this earnings growth is heavily influenced by the lower earnings base set during the coronavirus crisis a year ago, the breadth and magnitude of earnings surprises demonstrates how impressive the economic snapback has been. Of the companies that have reported, 88% reported earnings that exceeded expectations—a considerable step up from the five-year average of 75%. If results continue in this fashion throughout this earnings season, it will mark the highest percentage of positive surprises in an earnings season since FactSet started tracking this data in 2008. The magnitude of positive earnings is as remarkable as the breadth, too. In aggregate, companies in the S&P 500 are beating estimates by 17.2%, almost 10% higher than the five-year average of 7.8%. The updated expected second-quarter earnings growth rate is a staggering 85.1%, up from an expected 63.1% just one short month ago. This again is the highest year-over-year earnings growth since 2009. The chart below shows the break-out by sector of earnings above, in-line, and below expectations.
The sectors with the highest percentage of earnings surprises have been technology, health care, consumer discretionary, and communication services—mostly asset-light, growth-oriented sectors. That said, all 11 sectors reported year-over-year earnings growth, and the sectors that were hardest hit a year ago—energy, industrials, and consumer discretionary—have led the recovery. At the individual company level, the biggest earnings surprises for the quarter belonged to Valero Energy, Twitter, V.F. Corporation, PNC Financial Services, and Hasbro; all of them more than doubled analyst estimates.1
From a revenue perspective, 88% of S&P 500 companies reported revenues above estimates, also crushing the five-year average of 65%. In absolute terms, year-over-year revenue growth for the index is now projected to be 23.1%, which would be the highest since FactSet started publishing this data back in 2008.1
Looking ahead to the rest of 2021, analysts are projecting double-digit earnings growth for both the third and fourth quarters.1 At the beginning of the year, analysts were projecting an earnings growth of 22.5% for 2021.2 That estimate has now nearly doubled with a projection of 41.6% growth for the year.3 Looking ahead, corporate earnings currently are estimated to grow around 9.5% for 2022, continuing the above-average trend.3 Despite the impressive earnings growth, the strong rally in stocks has kept stock valuations near the higher end of historical ranges and well above averages. The forward 12-month price-to-earnings ratio (P/E) is 21.2x, considerably higher than the 10-year average of 16.2x.1
Looking Forward
With earnings exploding, inflation concerns abating, and vaccinations increasing across the globe, the proverbial “wall of worry” the stock market is said to climb seems to be getting smaller. But markets are forward looking, and as coronavirus cases rise, risks loom. As of August 3, the seven-day moving average of COVID-19 cases topped 90,000 in the U.S. for the first time since February.4 While that number is alarming, the seven-day average of the number of deaths, while sadly trending higher, remained 87% lower than the February peak. Looking forward, we will remain focused on hospitalizations and deaths as important metrics of pandemic recovery. We must also consider that the severity of, and reaction to, future coronavirus waves may be extremely varied across countries, regions, states, and even cities.
Despite the increase in COVID cases, the U.S. remains widely open and economic recovery continues gaining momentum. With stocks trading at high valuations and interest rates still at very low levels, investors are in a challenging position when determining how to allocate their investment assets. At RMB, we continue to recommend maintaining diversified portfolios of investments that have the potential to perform well in a broad range of market outcomes. The increasing number of COVID cases around the world could increase volatility in coming months and corrections in equity markets are possible. Given this, RMB believes now is a good time for investors to evaluate risk exposures in portfolios. One way for investors to respond, in light of these market considerations, is to maintain long-term asset allocation targets to stocks and bonds, but to reduce risk within these allocations. Some examples of ways investors can do that is through reduced allocations to opportunistic fixed income securities within the fixed income allocation or shifting equity allocations from some of the top performers over the last year to less-volatile sectors of the equity market, like U.S. large cap. These are examples of how we strive to balance opportunities in the current environment while remaining cognizant of the increasing risks. We will continue to focus on opportunities to balance our client portfolios for the current environment while also taking advantage of niche markets that present attractive risk/reward opportunities.
All market pricing and performance data from Bloomberg, unless otherwise cited. Asset class and sector performance are gross of fees unless otherwise indicated.
The opinions and analyses expressed in this newsletter are based on RMB Capital Management, LLC’s (“RMB Capital”) research and professional experience, and are expressed as of the date of our mailing of this newsletter. Certain information expressed represents an assessment at a specific point in time and is not intended to be a forecast or guarantee of future results, nor is it intended to speak to any future time periods. RMB Capital makes no warranty or representation, express or implied, nor does RMB Capital accept any liability, with respect to the information and data set forth herein, and RMB Capital specifically disclaims any duty to update any of the information and data contained in this newsletter. The information and data in this newsletter does not constitute legal, tax, accounting, investment or other professional advice. Returns are presented net of fees. An investment cannot be made directly in an index. The index data assumes reinvestment of all income and does not bear fees, taxes, or transaction costs. The investment strategy and types of securities held by the comparison index may be substantially different from the investment strategy and types of securities held by your account. The S&P 500 Index is widely regarded as the best single gauge of the U.S equity market. It includes 500 leading companies in leading industries of the U.S economy. The S&P 500 focuses on the large cap segment of the market and covers 75% of U.S. equities.


