Overview
On Wednesday, November 6, with 277 of the 270 needed electoral college votes needed, Trump was declared the winner of the 2024 U.S. Presidential Election. The Republican party also gained control of the Senate, though it may take several days to determine which party has secured control of the House. Trump won majority in each of the seven swing states, with the race in Pennsylvania— anticipated to be the key determinant of the presidential winner—being called in the early hours of Wednesday morning. Trump is also the first Republican president to win the popular vote (at 51%) in over twenty years.
Policy & Market Implications
Below are our thoughts on the potential policy responses and market implications of Trump’s win.
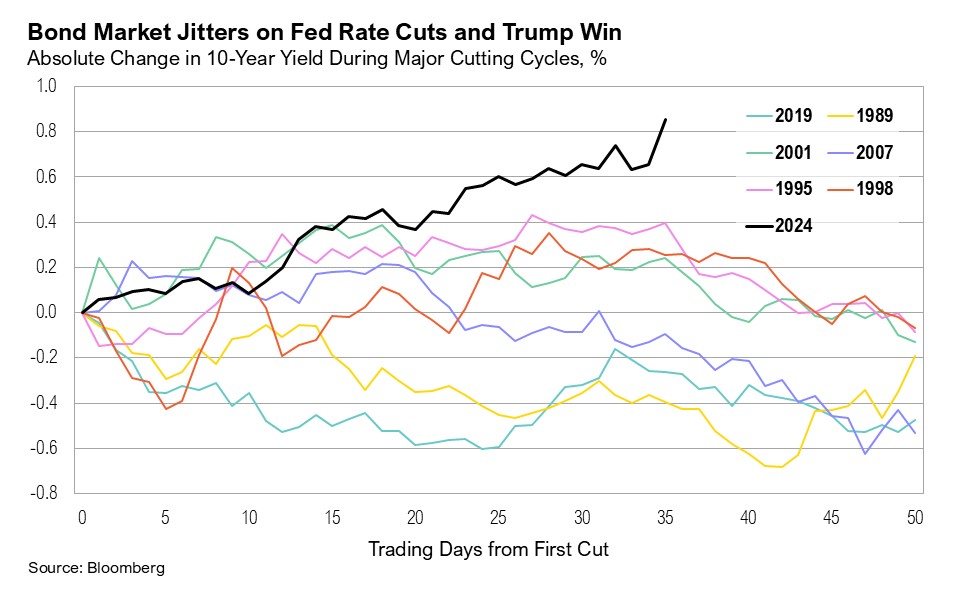
- Monetary Policy Implications: Trump’s proposed policies—tax cuts, global tariffs, and border control—are likely to be inflationary in the near term. However, there are potential offsets which could alleviate housing pressure. On balance, we believe that Trump’s policies would support nominal growth but also lead to higher long-term inflation expectations and bond yields. The Federal Reserve's response may be harder to call given its recent tolerance for higher inflation. The market currently anticipates the equivalent of two additional 25-basis-point rate cuts before year-end, which we believe are on track, as the Fed aims to maintain a non-political stance. However, the likelihood of rate cuts in 2025 has now come into question, with markets now anticipating the equivalent of around 0.7% in reductions next year, compared to nearly 1.0% last week.1 Any increase in inflation between now and year-end could be managed through forward guidance, potentially moderating rate cut expectations for 2025.
- Fiscal policy implications: The consensus of opinions is that a Trump victory will negatively impact the deficit, primarily due to the estimated $4 trillion cost of extending the Tax Cuts and Jobs Act (TCJA), with any offset from higher tariffs remaining uncertain.
- Can the bull market continue? There is no reason it cannot continue, as long as the policy backdrop contributing to it remains in place and the bond market tolerates the excesses (i.e., yields do not rise too much). Historically, markets tend to rally following elections, as uncertainty subsides. While a split Congress has historically been the most favorable outcome for the stock market, a Republican sweep is the next best outcome. Years featuring a split Congress (since 1951) averaged gains of 14.5%, compared to 11% under a Republican Congress and 6.7% under a Democratic Congress.2
- What does the result mean for bond yields? As long as the current policy mix focuses on near-term growth priorities at the expense of addressing the U.S. fiscal deficit, we remain cautious. Even in the event of an economic slowdown, we believe policymakers would view any meaningful decline in yields as further justification to continue with stimulative monetary and fiscal policies, which would ultimately be detrimental for bonds.
Potential Opportunities
Potential investment opportunities stemming from a Trump presidency would include profitable small caps, energy, and digital assets.
- “Drill, baby, drill”: We believe that energy and fossil fuel stocks could perform well under a Trump administration, as observed following the 2016 election. We also anticipate that Trump’s focus on fossil fuels would lead to increased drilling activity and potentially lower energy prices, all else equal.3 Lower energy prices support consumer spending. Additionally, energy has historically been the top-performing sector following elections, on average, since 1972.
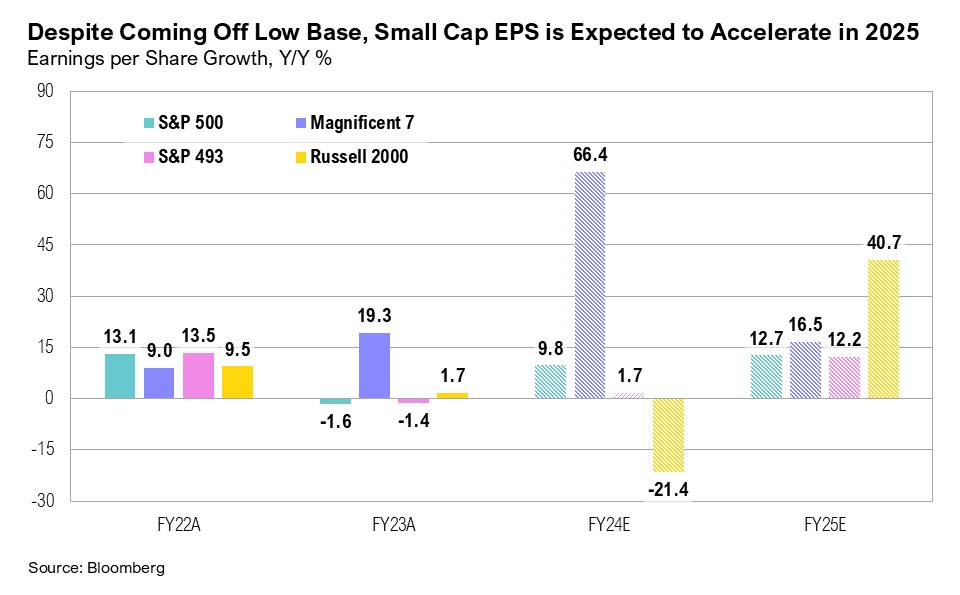
- Rotation to small caps: The potential for increased onshoring and reduced regulation could benefit small caps. Additionally, small-cap earnings growth is projected to accelerate, even as earnings growth for the broader market slows. If market estimates are directionally accurate, this shift in growth rates could favor small-cap stocks. Historically, small caps also tend to outperform large caps following elections, with average gains of 17% in the year after elections compared to U.S. large-cap stocks, which gain an average of 12%.
3. Other sectors & industries: Additional areas that we believe could benefit include financials and defense stocks.
With Republicans controlling the White House and Senate, support for higher defense spending is likely to grow, though control of the House could affect some priorities and specific budget levels. Overall, increasing defense funding remains the path of least resistance in Washington.
Financials should continue to benefit from a steeper yield curve and more supportive M&A and consolidation backdrop.
4. Digital assets: Trump and Vance have been unambiguously supportive of digital assets, including Bitcoin, and we view the result as good news for the space. The suggestion of a strategic Bitcoin reserve could drive further gains, should it materialize.
Risks
Along with opportunities come some potential risks to be mindful of going into the next administration. Key areas of risk include trade and tariffs impact on inflation, further divide of wealth distribution in the U.S., pressure on the clean energy sector, and the increasing US deficit and the potential upward pressure on bond yields. We will continue to monitor these and other risks over the coming months.
Summary
As with any election cycle, various sectors of the economy and markets stand to benefit with Trump’s victory. But, the primary market drivers are expected to be shifts in monetary, fiscal, and tax policies. One certainty remains—the growing deficit will continue to go unaddressed.
We want to echo the guidance we shared leading up to the election: continue to be cautious with risk assets as the current cycle plays out. We expect the uncertainty and increased volatility in markets to continue in the coming weeks and months, and we remain biased towards high-quality companies within our core stock portfolios. We have been well-positioned within core bond portfolios with a low weight toward shorter-duration corporate bonds and a higher weight toward longer-duration treasury bonds. We believe clients are best served reminding themselves of the timeless principles of patience and diversification. The key to successful investing is often remaining committed to long-term investment plans.
Citations
- CME FedWatch: https://www.cmegroup.com/markets/interest-rates/cme-fedwatch-tool.html
- Business Insider: https://markets.businessinsider.com/news/stocks/stock-market-impact-president- election-congressional-makeup-democrats-republicans-party-2020-7-1029374181
- Texas Tribune: https://www.texastribune.org/2024/08/15/donald-trump-energy-policy-fact-check-election-2024/
Index Definitions
The S&P 500 Index is widely regarded as the best single gauge of the United States equity market. It includes 500 leading companies in leading industries of the U.S. economy. The S&P 500 focuses on the large cap segment of the market and covers approximately 75% of U.S. equities.
The Magnificent 7 is a group of stocks withing the U.S. stock market and is not an official index. The companies in the Magnificent 7 include Alphabet, Amazon, Apple, Meta Platforms, Microsoft, NVIDIA, and Tesla.
The S&P 493 is an abbreviation for the S&P 500 excluding the Magnificent 7 and is not an official index.
The Russell 2000® Index measures the performance of the small-cap segment of the US equity universe. It includes approximately 2000 of the smallest US equity securities in the Russell 3000 Index based on a combination of market capitalization and current index membership. The Russell 2000 Index represents approximately 10% of the total market capitalization of the Russell 3000 Index. Because the Russell 2000 serves as a proxy for lower quality, small cap stocks, it provides an appropriate benchmark for RMB Special Situations.
The opinions and analyses expressed in this newsletter are based on Curi RMB Capital, LLC’s (“Curi RMB Capital”) research and professional experience are expressed as of the date of our mailing of this newsletter. Certain information expressed represents an assessment at a specific point in time and is not intended to be a forecast or guarantee of future results, nor is it intended to speak to any future time periods. Curi RMB Capital makes no warranty or representation, express or implied, nor does Curi RMB Capital accept any liability, with respect to the information and data set forth herein, and Curi RMB Capital specifically disclaims any duty to update any of the information and data contained in this newsletter. The information and data in this newsletter does not constitute legal, tax, accounting, investment or other professional advice. Returns are presented net of fees. An investment cannot be made directly in an index. The index data assumes reinvestment of all income and does not bear fees, taxes, or transaction costs. The investment strategy and types of securities held by the comparison index may be substantially different from the investment strategy and types of securities held by your account. RMB Asset Management is a division of Curi RMB Capital.


