Three Reasons to Consider Investing in Small Cap Companies
The recent outperformance of large cap stocks compared to small cap stocks has been historic and goes contrary to studies by Nobel laureates Eugene Fama and Kenneth French. It has long been an axiom for investors and allocators that small cap equities outperform large cap equities over the long run. The Fama/French study from the early 1990’s bears this out1: since 1927, U.S. small caps had outperformed large caps by roughly two percentage points (200bps) on an annualized basis. However, over the last 15 years, large cap stocks have outperformed small cap stocks. We explore this divergence below and examine three reasons we believe now may be a good time to invest in small cap.
1) The Effects of Inflation on Small Cap Companies
Inflation plays an important role in understanding small cap equities. Compared to large cap companies, small caps have tended to be price-takers, meaning they don’t always influence the price at which they sell a product or service. In periods when inflation is high, companies with lower management skill and more commoditized products that struggle to pass on the price increase to consumers can get penalized, with a squeeze on their profitability.
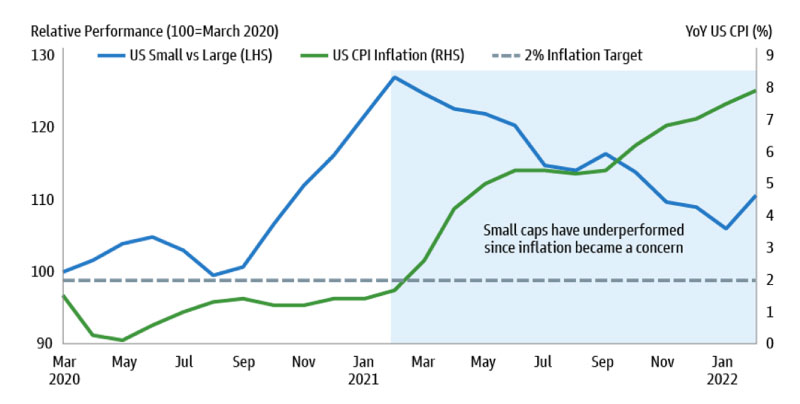
A recent study by Goldman Sachs looked at the impact of inflation on small cap equities. Exhibit 1 plots the relative performance of U.S. small-cap vs large-cap stocks against U.S. CPI inflation since March 31, 2020. It illustrates that the acceleration of U.S. inflation since Q1 2021 has been associated with an underperformance of small caps relative to large caps. This shift in direction would likely persist should inflation continue to edge higher as low quality and poorly managed companies struggle to pass on price increases.
Exhibit 1. Small-cap vs. Large-cap stocks against Inflation
Source: Bloomberg and Goldman Sachs Asset Management. Last data point is February 2022. As of March 10, 2022. “US Small vs Large” refers to MSCI US Small Cap Index vs MSCI US Large Cap Index. US CPI Inflation is year-over-year inflation rate. For illustrative purposes only. Past performance does not guarantee future results, which may vary.
So, can investors expect the reverse when inflation subsides? Exhibit 2 shows that small caps outperformed their larger peers by 5.1 percentage points when inflation declined from a high level and the Federal Reserve cut or kept the federal funds rate unchanged. The outperformance was even more pronounced when the Federal Reserve tightened: U.S. small caps delivered an excess return of 6.7 percentage points on average compared to large cap companies.
Exhibit 2. U.S. Small Caps Outperformed when U.S. CPI Inflation Fell from High Level
Source: Kenneth R. French, Federal Reserve Bank of St. Louis, and Goldman Sachs Asset Management. “US Small vs Large” refers to Fama & French’s SMB factor. The time period is July 1954 to December 2021. As of February 21, 2022. Annualized average of monthly total returns. US CPI Inflation is year-over-year inflation rate. For illustrative purposes only. Past performance does not guarantee future results, which may vary.
2) Adding Valuation to the Equation
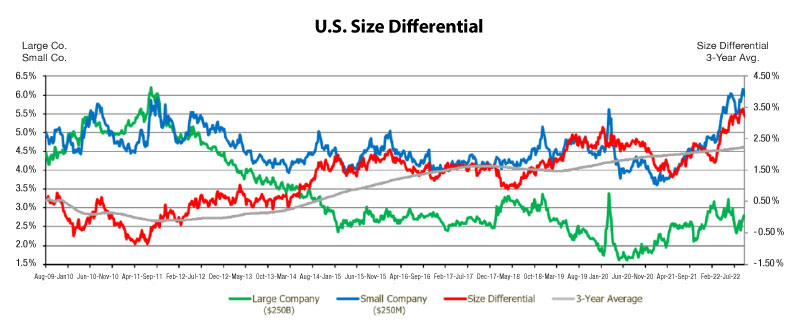
From a valuation perspective, RMB’s market-derived discount rate shows a size differential between the cost of capital for small cap equity vs large cap equity at its biggest premium in over several decades. The last time we saw the small cap premium at this level was in 1999, when the cover of Business Week announced the “Death of Small Caps”. The current expected return for small cap stocks is 350bps higher than large caps – 150bps higher than the 200bps expected premium indicated by the Fama/French study.
Exhibit 3. Historic Size Differential – Large Cap vs. Small Cap
Source: RMB Asset Management (Data Date: 9/30/22).
3) Reversion to the Mean
The data below shows the annualized performance of the Russell 2000® Index (small caps) and the S&P 500 Index (large caps) for the one, three, five, ten and 15 year periods ending September 30, 2022. Notably, small cap stocks have underperformed large cap stocks in each of these periods.
Exhibit 4. Large Cap vs. Small Cap Performance
Source: RMB Capital. Data as of 9/30/2022. Investors cannot invest directly in an index. Indexes have no fees. Past performance is not indicative of future results. Potential for profits is accompanied by possibility of loss.
This persistent and prolonged underperformance of small cap directly contradicts the Fama/French study mentioned above, which suggests small cap companies should outperform large caps by about 2% a year. This is also what you would expect based on finance theory, which suggests that small cap stocks should generate higher returns than large cap stocks over long periods of time, due in part to the higher risk associated with small cap stocks.
Summary
The question on investor’s minds is whether or not we are going to see reversion to the mean in the coming years with small cap stocks coming back in favor relative to large cap stocks. Overall, the outlook for U.S. Small/SMID cap equity may be supportive for the asset class – especially as inflation moderates and the economy recovers. Historically low valuations relative to large cap equity seem to point asset allocators to an opportunity to allocate to the Small/SMID area of the market for mid- to longer-term outlooks.
The opinions and analyses expressed in this paper are based on RMB Capital Management, LLC’s (“RMB Capital”) research and professional experience and are expressed as of the date of our mailing of this paper. Certain information expressed represents an assessment at a specific point in time and is not intended to be a forecast or guarantee of future performance, nor is it intended to speak to any future time periods. RMB Capital makes no warranty or representation, express or implied, nor does RMB Capital accept any liability, with respect to the information and data set forth herein, and RMB Capital specifically disclaims any duty to update any of the information and data contained in this newsletter. The information and data in this paper does not constitute legal, tax, accounting, investment, or other professional advice.
RMB Asset Management is a division of RMB Capital Management.
An investment cannot be made directly in an index. The index data assumes reinvestment of all income and does not bear fees, taxes, or transaction costs. The investment strategy and types of securities held by the comparison index may be substantially different from the investment strategy and types of securities held by the strategies. The benchmarks are shown for comparison purposes and are fully invested and include the reinvestment of income. The Russell 2000 is a subset of the Russell 3000 Index, representing about 8% of the total market capitalization of that index. It includes approximately 2000 of the smallest securities based on a combination of their market cap and current index membership. The Russell 2500 is a subset of the Russell 3000, including approximately 2500 of the smallest securities based on their market cap and current index membership. The strategies include small- to mid-cap equity portfolios. The strategies may target investments in companies with relatively small market capitalizations (generally between $500 million and $10 billion at the time of initial purchase), that are undervalued as suggested by RMB Capital’s proprietary economic return framework. The S&P 500 is widely regarded as the best single gauge of the United States equity market. It includes 500 leading companies in leading industries of the U.S. economy. The S&P 500 focuses on the large cap segment of the market and covers approximately 75% of US equities.


