
Key Takeaways
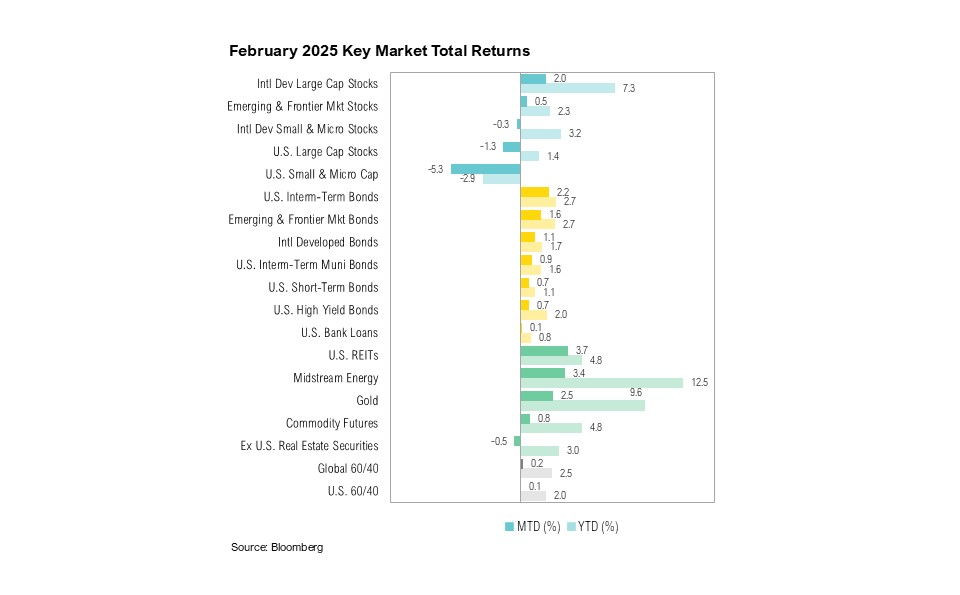
- Market results were mixed in February. U.S. large-cap stocks ended the month down 1.3%, and U.S. small-cap stocks declined 5.3% while U.S. intermediate-term bonds gained 2.2%.
- Consumer spending declined, but wages increased. Inflation remains persistently elevated.
- It remains unclear how much of the decline in bond yields signals optimism about the Department of Government Efficiency’s impact on the deficit versus concerns over a growth slowdown caused by tariffs.
- Treasury Secretary Scott Bessent is urging markets and consumers to bear the short-term pain of government spending cuts and tariffs for long-term gains stemming from the anticipated boost in domestic manufacturing and capital investment.
Overview
Markets produced mixed results in February. U.S. large-cap stocks, as represented by the S&P 500, ended the month down 1.3%, while the U.S. small-cap Russell 2000 Index ended February down 5.3%. U.S. intermediate-term bonds fared well, as the Bloomberg U.S. Aggregate Bond Index gained 2.2%.
Personal income increased by 0.9%, driven by rising wages and adjustments to social security benefits. 1 Higher income and lower spending boosted the personal savings rate, which climbed to a six-month high of 4.6% in January. 2 Consumer prices ticked up in the first month of the year. The January consumer price index (CPI) report showed headline inflation rising to 3.0% year-over-year, while core inflation also increased, rising to 3.3%. Persistent inflation and unseasonably cold weather weighed on consumer spending as retail sales declined by 0.9% month-over-month in January.
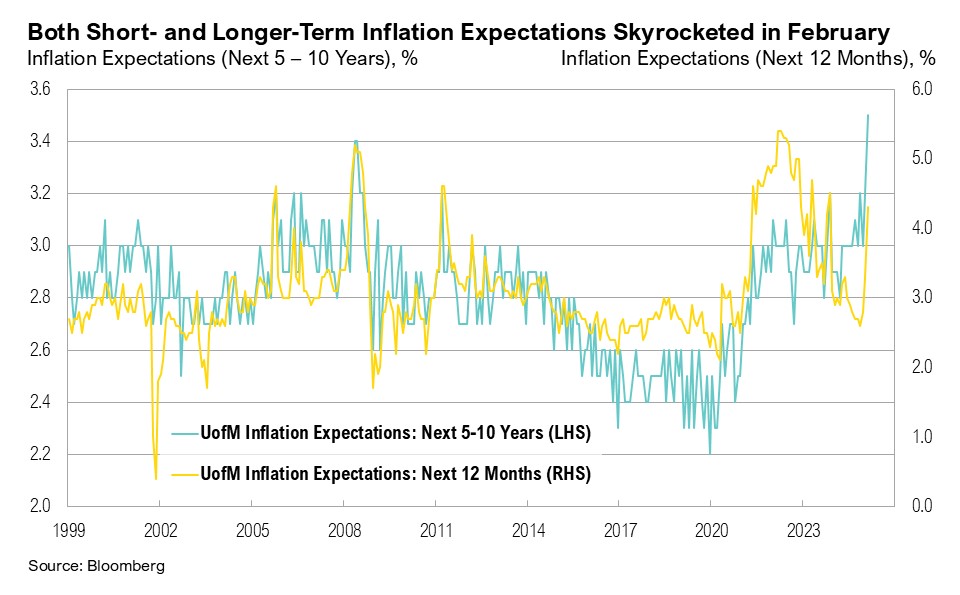
Largely due to the warmer-than-anticipated January inflation report and tariff concerns, inflation expectations rose sharply in February. Longer-term inflation expectations reached a record 3.5%, while short-term (next 12 months) expectations jumped by 1%, rising to 4.3%. This is more than double the official Federal Reserve target of 2%. Minutes from the January 29 Federal Open Market Committee (FOMC) meeting, released on February 19, showed Fed officials willing to hold interest rates steady amid stubborn inflation and uncertainty surrounding economic policy. 3
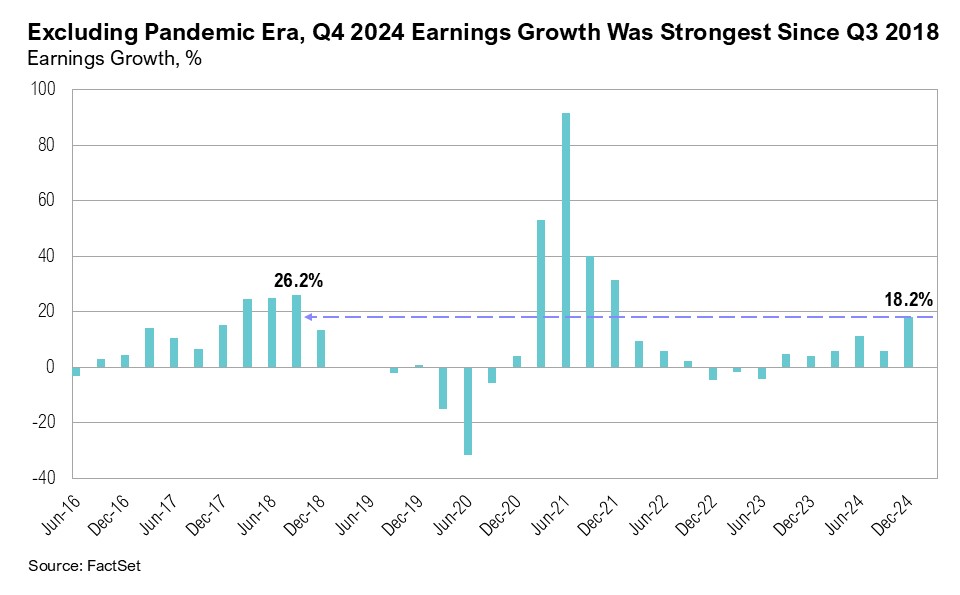
With over 97% of S&P 500 companies having already reported, earnings growth for the fourth quarter of 2024 notably improved during February, rising from 11.7% at the start of the year to 18.2%. 4 Excluding the COVID-19 pandemic, this represents the strongest quarterly earnings growth for the S&P 500 since the third quarter of 2018, when earnings grew by 26%. Financials (56%), communication services (30%) and consumer discretionary (27%) led the earnings growth. 4 Looking ahead, projections for the first-quarter S&P 500 earnings growth are expected to be 7.5%. 4
Rain on the Parade
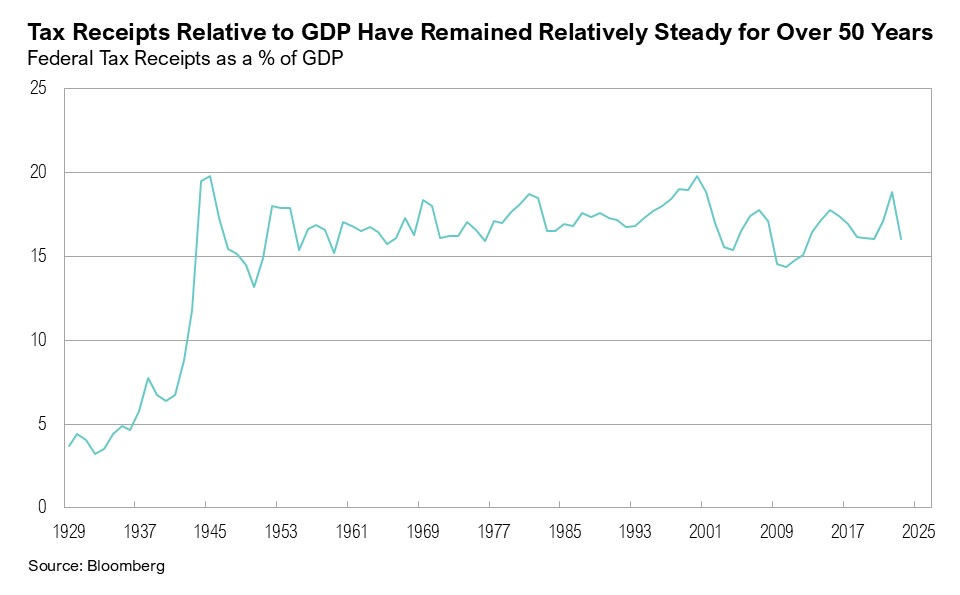
The U.S. government fiscal deficit reached $1.8 trillion in the 2024 fiscal year, making it the largest deficit on record for a non-crisis or non-recessionary year. Already, the fiscal deficit for 2025 has surpassed $800 billion, and is projected to reach $1.9 trillion by the fiscal year end. 5,6 Tax receipts as a percentage of GDP have remained steady for over 50 years—but government spending has not. In the words of new Treasury Secretary Scott Bessent: “We do not have a revenue problem in the U.S. We have a spending problem.” 7
In December, Fed Chair Jerome Powell noted that:
“The U.S. federal budget is on an unsustainable path. The debt is not at an unsustainable level, but the path is unsustainable, and we know that we have to change that.” 8
The Trump administration has made it clear that reducing the fiscal deficit is one of its primary objectives. The newly created Department of Government Efficiency, or DOGE, was created to improve government accountability and efficiency through strategic oversight and reform initiatives. DOGE’s methods thus far have, at times, been unorthodox, including a parade of often controversial decisions. For example, it offered a “deferred resignation,” which approximately 75,000 federal employees accepted in exchange for up to six months of paid leave. It also fired and re-hired essential Department of Agriculture employees to work on the government’s response to the ongoing bird flu outbreak in the U.S. and stopping nearly all funding from USAID. 9,10,11,12,13 DOGE claims to have saved the government over $100 billion already. 14
Nevertheless, progress has at least been made in shedding light on wasteful government spending. Further, a recent Harvard CAPS-Harris poll of over 2,400 registered U.S. voters found an overwhelming support for the government’s policies on eliminating fraud and waste in government spending and cutting government expenditures that were already allocated by Congress. 15 77% of Americans believe that a full examination of government expenditures is needed, and 83% of Americans (including 72% of Democrats and 94% of Republicans) agreed that spending should be cut. 15
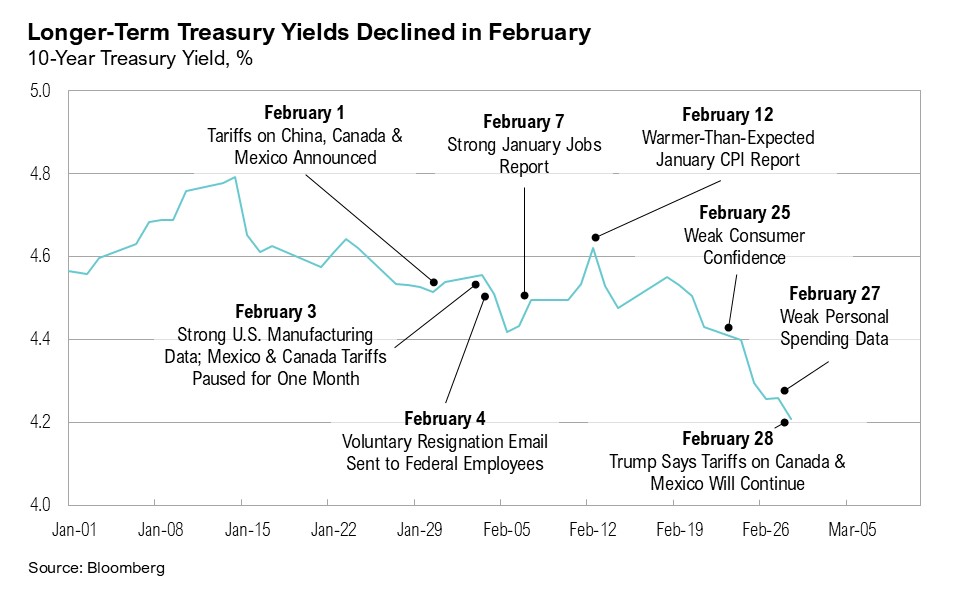
The poll also found broad support for “placing reciprocal tariffs on countries that have tariffs on U.S. goods.” 15 On February 1, President Trump signed executive orders imposing 25% tariffs on imports from Canada and Mexico and a 10% tariff on imports from China. Following the announcement, tariffs were temporarily paused for one month after both Canada and Mexico agreed to tighten border security to curb the flow of illegal drugs into the U.S. 16,17 In early March, the temporary pause was lifted, and an additional 10% tariff was added to Chinese goods. 18,19
While the secondary GDP estimate showed economic growth holding steady at an annualized 2.3%, concerns about slowing growth increased over the month, as trade policy uncertainty rained on the parade of continued economic expansion. The Atlanta Fed’s GDPNow estimate for the first quarter of 2025 sharply dropped from 2.9% in the beginning of February, to end the month at -1.5%. 20 A key reason for the sharp decline was a notable increase in U.S. trade deficits as imports surged in an effort to avoid forthcoming tariffs. 21 Notably, a substantial portion of import gains was driven by the movement of gold from Europe to the U.S. to avoid tariffs. 22
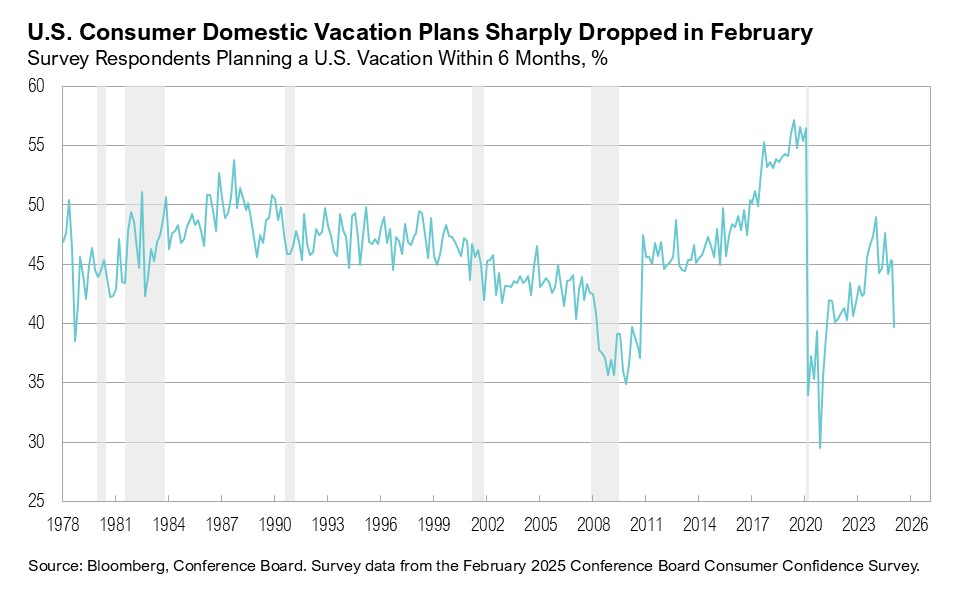
Consumer confidence also dropped by seven points in February, recording the largest monthly decline since August 2021 as pessimism about the future returned. 23 The number of consumers planning a vacation in the next six months plummeted by 6%, the largest monthly drop outside of the COVID-19 pandemic. Reports show that corporate capital spending plans have started to reverse, as uncertainty on the economic outlook grows. 24 The American Association of Individual Investors (AAII) sentiment survey showed bearish sentiment rising to 61% in the last week of February, despite nearly 40% of respondents saying that the current state of the economy was “good” and the S&P 500 ending the month 3% off its all-time high. 25
Bond yields declined throughout February, easing from 4.5% to end the month at 4.2%. Whether or not declining bond yields reflect potential optimism about DOGE’s impact and its ability to trim the fiscal deficit or whether they reflect rising concerns about a possible growth slowdown remains to be seen. Credit spreads remain tight—and continue to signal economic stability and the potential for continued expansion.
The Trump administration is urging markets to overlook the short-term pain of deficit cuts and potential tariff consequences, focusing instead on the expected boost in small business spending, domestic manufacturing, and capital investment. As Treasury Secretary Bessent pointed out:
“Wall Street can continue to do fine. But we have a focus on small business and the consumers. So we are going to rebalance the economy. We’re going to bring manufacturing jobs home.” 26
For now, these anticipated benefits appear to be overshadowed by the immediate effects of deficit reductions and tariffs.
Markets
For the second consecutive month, international equities fared better than their U.S. counterparts. U.S. large-cap stocks ended the month down 1.3% while international developed large cap stocks gained 2.0%. Similarly, while U.S. small-cap stocks ended the month down 5.3%, international developed market small cap stocks declined by only 0.3%. International developed market gains were driven mostly by European countries. U.S. intermediate-term bonds ended February up 2.2%, while developed market bonds gained 1.1%.
Looking Forward
The current administration aims to reduce the deficit to extend the Tax Cuts and Jobs Act beyond its scheduled expiration at the end of 2025. It has also proposed eliminating income taxes on Social Security benefits, overtime and tips, which would reduce government revenue by $1.8 trillion over the next ten years. 27,28 Achieving these objectives requires curtailing government spending to keep longer-term interest rates contained, in hopes of sustaining the current economic expansion.
The administration is encouraging markets to look beyond the near-term pain posed by deficit cuts and tariff consequences, focusing instead on the potential boost in small business spending, domestic manufacturing, and capital investment that may result. As long as markets see sufficient evidence that this approach is working, broader disruptions may remain contained. However, if these efforts falter, the parade may be called off.
Our position on the markets remains unchanged. We expect the increased volatility in markets to continue in the coming weeks and months and remain cautious with risk assets as the current cycle plays out. We expect the yield curve to continue to normalize and the upside risk to inflation has increased.
Although equity valuations generally remain at above average levels, we would view lower asset prices as an opportunity to put additional capital to work. We remain biased towards high-quality companies within our core stock portfolios. We have been well-positioned within core bond portfolios with a low weight toward shorter-duration corporate bonds and a higher weight toward longer-duration treasury bonds. We believe clients are best served reminding themselves of the timeless principles of patience and diversification. The key to successful investing is often remaining committed to long-term investment plans.
Citations
- Reuters: https://www.reuters.com/markets/us/us-consumer-spending-falls-january-monthly-inflation-rises-2025-02-28/
- FRED: https://fred.stlouisfed.org/series/PSAVERT
- Federal Reserve: https://www.federalreserve.gov/monetarypolicy/files/fomcminutes20250129.pdf
- FactSet: https://advantage.factset.com/hubfs/Website/Resources%20Section/Research%20Desk/Earnings%20Insight/EarningsInsight_022825.pdf
- Bureau of the Fiscal Service: https://www.fiscal.treasury.gov/files/reports-statements/mts/mts0125.pdf
- Congressional Budget Office: https://www.cbo.gov/system/files/2024-06/60039-By-the-Numbers.pdf
- CNBC: https://www.cnbc.com/video/2025/01/16/scott-bessent-we-have-a-spending-problem-in-the-u-s-not-a-revenue-problem.html
- The Hill: https://thehill.com/business/5022592-federal-reserve-warns-unsustainable-path/
- Bloomberg: https://www.bloomberg.com/news/articles/2025-01-29/trump-s-federal-worker-buyout-is-actually-deferred-resignation
- CNBC: https://www.cnbc.com/2025/02/13/trump-administration-tells-federal-agencies-to-fire-probationary-employees.html
- AP News: https://apnews.com/article/doge-firings-layoffs-federal-government-workers-musk-d33cdd7872d64d2bdd8fe70c28652654
- Reuters: https://www.reuters.com/business/healthcare-pharmaceuticals/services-collapsing-usaid-cuts-health-contracts-worldwide-2025-02-27/
- Washington Times: https://www.washingtontimes.com/news/2025/feb/19/agriculture-department-tries-rehire-fired-workers-link-bird-flu-respon/
- Department of Government Efficiency: https://www.doge.gov/savings
- Harvard CAPS-Harris Poll: https://harvardharrispoll.com/wp-content/uploads/2025/02/HHP_Feb2025_vFinal.pdf
- AP News: https://apnews.com/article/trump-tariffs-canada-mexico-china-sheinbaum-trudeau-017efa8c3343b8d2a9444f7e65356ae9
- Reuters: https://www.reuters.com/world/us/trump-says-americans-may-feel-pain-trade-war-with-mexico-canada-china-2025-02-03/
- Forbes: https://www.forbes.com/sites/mollybohannon/2025/02/24/trump-says-tariffs-on-mexico-and-canada-will-go-forward-next-month/
- Wall Street Journal: https://www.wsj.com/politics/policy/trump-plans-another-10-tariff-on-products-from-china-f7c0d4d9
- Federal Reserve Bank of Atlanta: https://www.atlantafed.org/cqer/research/gdpnow
- Bloomberg: https://www.bloomberg.com/news/articles/2025-03-06/us-trade-deficit-surges-to-a-record-ahead-of-trump-tariffs
- Bloomberg: https://www.bloomberg.com/news/articles/2025-01-30/swiss-gold-exports-to-us-surged-last-month-on-trump-tariff-fears
- Conference Board: https://www.conference-board.org/topics/consumer-confidence
- Apollo Academy: https://www.apolloacademy.com/short-term-pain-long-term-gain/
- AAII: https://www.aaii.com/sentimentsurvey
- Yahoo Finance: https://finance.yahoo.com/news/wall-street-fine-focused-main-161041025.html
- Penn Wharton: https://budgetmodel.wharton.upenn.edu/issues/2025/2/10/eliminating-income-taxes-on-social-security-benefits
- Tax Foundation: https://taxfoundation.org/research/all/federal/tax-cuts-and-jobs-act-tcja-permanent-analysis/
Index Definitions
The S&P 500 Index is widely regarded as the best single gauge of the United States equity market. It includes 500 leading companies in leading industries of the U.S. economy. The S&P 500 focuses on the large cap segment of the market and covers approximately 75% of U.S. equities.
The Bloomberg Barclays U.S. Aggregate Index represents securities that are SEC-registered, taxable, and dollar denominated. The index covers the U.S. investment grade fixed rate bond market, with index components for government and corporate securities, mortgage pass-through securities, and asset-backed securities. Duration is roughly 5 years.
The Bloomberg U.S. Corporate High Yield Bond Index measures the USD-denominated, high yield, fixed-rate corporate bond market. Securities are classified as high yield if the middle rating of Moody’s, Fitch and S&P is Ba1/BB+/BB+ or below. Bonds from issuers with an emerging markets country of risk, based on the indices’ EM country definition, are excluded.
The Russell 1000® Value Index measures the performance of the large-cap value segment of the U.S. equity universe. It includes those Russell 1000 companies with lower price-to-book ratios and lower expected and historical growth rates.
The Russell 1000® Growth Index measures the performance of the large- cap growth segment of the US equity universe. It includes those Russell 1000 companies with relatively higher price-to-book ratios, higher I/B/E/S forecast medium term (2 year) growth and higher sales per share historical growth (5 years).
The Russell 2000® Index measures the performance of the small-cap segment of the US equity universe. It includes approximately 2000 of the smallest US equity securities in the Russell 3000 Index based on a combination of market capitalization and current index membership. The Russell 2000 Index represents approximately 10% of the total market capitalization of the Russell 3000 Index. Because the Russell 2000 serves as a proxy for lower quality, small cap stocks, it provides an appropriate benchmark for RMB Special Situations.
MSCI EAFE Index*: an equity index which captures large and mid-cap representation across 21 of 23 Developed Markets countries around the world, excluding the U.S. and Canada. With 926 constituents, the index covers approximately 85% of the free float-adjusted market capitalization in each country.
The MSCI Emerging Markets Index* measures equity market performance in the global emerging markets universe. It covers over 2,700 securities in 21 markets that are currently classified as EM countries. The MSCI EM Index universe spans large, mid and small cap securities and can be segmented across all styles and sectors.
The U.S. Dollar Index is used to measure the value of the dollar against a basket of six foreign currencies: the euro, Swiss franc, Japanese yen, Canadian dollar, British pound, and Swedish krona.
The Deutsche Bank EM FX Equally Weighted Spot Index, an equal-weighted basket of 21 emerging market currencies.
MSCI U.S. REIT Index is a free float-adjusted market capitalization weighted index that is comprised of equity Real Estate Investment Trusts (REITs). The index is based on the MSCI USA Investable Market Index (IMI), its parent index, which captures the large, mid and small cap segments of the USA market. With 150 constituents, it represents about 99% of the US REIT universe and securities are classified under the Equity REITs Industry (under the Real Estate Sector) according to the Global Industry Classification Standard (GICS®), have core real estate exposure (i.e., only selected Specialized REITs are eligible) and carry REIT tax status.
MSCI China NR Index: designed to measure the performance of the large and mid cap segments of the Chilean market. With 12 constituents, the index covers approximately 85% of the Chile equity universe.
MSCI South Africa NR Index: designed to measure the performance of the large and mid cap segments of the South African market. With 37 constituents, the index covers approximately 85% of the free float-adjusted market capitalization in South Africa.
*Source: MSCI.MSCI makes no express or implied warranties or representations and shall have no liability whatsoever with respect to any MSCI data contained herein. The MSCI data may not be further redistributed or used as a basis for other indexes or any securities or financial products. This report is not approved, endorsed, reviewed or produced by MSCI. None of the MSCI data is intended to constitute investment advice or a recommendation to make (or refrain from making) any kind of investment decision and may not be relied on as such.
Disclaimers
Performance Disclosures
All market pricing and performance data from Bloomberg, unless otherwise cited. Asset class and sector performance are gross of fees unless otherwise indicated.
The opinions and analyses expressed in this newsletter are based on Curi RMB Capital, LLC’s (“Curi RMB Capital”) research and professional experience are expressed as of the date of our mailing of this newsletter. Certain information expressed represents an assessment at a specific point in time and is not intended to be a forecast or guarantee of future results, nor is it intended to speak to any future time periods. Curi RMB Capital makes no warranty or representation, express or implied, nor does Curi RMB Capital accept any liability, with respect to the information and data set forth herein, and Curi RMB Capital specifically disclaims any duty to update any of the information and data contained in this newsletter. The information and data in this newsletter does not constitute legal, tax, accounting, investment or other professional advice. Returns are presented net of fees. An investment cannot be made directly in an index. The index data assumes reinvestment of all income and does not bear fees, taxes, or transaction costs. The investment strategy and types of securities held by the comparison index may be substantially different from the investment strategy and types of securities held by your account. RMB Asset Management is a division of Curi RMB Capital.