


Overview
On Wednesday, the Fed hiked interest rates and maintained its pace of quantitative tightening despite early signs that higher interest rates are destabilizing the banking system.
The most recent hike was anticipated by markets (by March 22, the CME FedWatch had an 86% probability of a 25-basis point rate hike) and it highlights the predicament the Fed has put itself in.1 It also stands in stark contrast to what the Fed was doing in the early phases of the Global Financial Crisis (GFC) during the period between 2007 and 2009. Further, language included in yesterday’s press release suggests they may need to raise rates again: “We are strongly committed to returning inflation to our 2 percent objective…we now anticipate that some additional policy firming may be appropriate.”2
In response to multi-decade high inflation, the Fed has been aggressively hiking interest rates since March 2022. However, by waiting so long to address inflation, which started spiking early in 2022, the Fed is now forced to decide between two crucial mandates with no easy path to addressing both. Given inflation was structurally low for so long, the Fed has been able to react relatively quickly to stresses in the economy or banking system for most of the last several decades. For instance, by the time Bear Stearns collapsed in March 2008, the Fed had already lowered interest rates from 5.25% in August 2007 to 3% in March 2008.3 Prior to the collapse of Bear Stearns, in addition to lowering rates, the Fed also announced a Term Auction Facility (TAF) to increase liquidity in U.S. credit markets and the Term Securities Lending Facility (TLSF), another monetary policy tool used to promote liquidity in Treasury and other collateral markets.3
Financial (In)stability
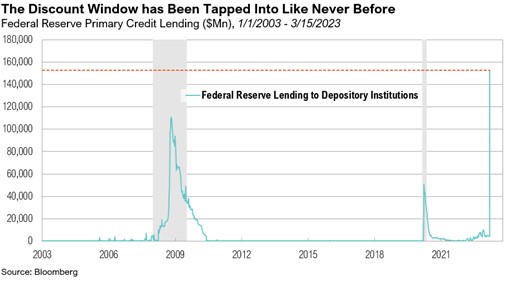
After the collapse of Silicon Valley Bank (SVB) and the subsequent closure of Signature Bank earlier in March, the Fed eased access to the discount window by valuing the collateral it offered in return for money at face value (‘at par’) instead of following the usual practice of imposing a haircut.4 This somewhat eased the stigma that exists surrounding the discount window. In the turbulent week ending March 15, banks borrowed $152 billion from the Fed’s discount window, smashing the previous record of $111 billion—a level reached during the GFC. The discount window is the Federal Reserve’s main direct lending facility, aimed at supporting stability and providing liquidity to the U.S. banking system.5
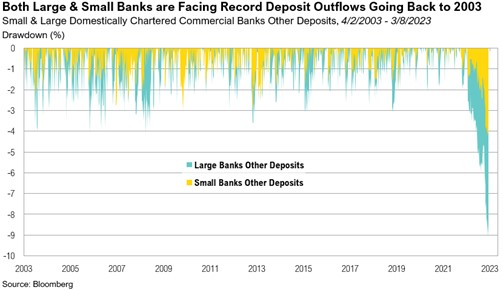
Last week, the Fed created a new emergency loan facility, called the Bank Term Funding Program (BTFP). BTFP enables banks to take out loans for up to a year, secured by government bonds, and valued as collateral at face value.6 The aim of the BTFP is to act as an additional source of liquidity against high-quality securities. On March 21, Treasury Secretary Janet Yellen made a vague statement that “aggregate deposit outflows from regional banks have stabilized”.7 It remains to be seen whether this program can stem the wave of deposits leaving banks for safer and higher-yielding instruments such as treasury bills.
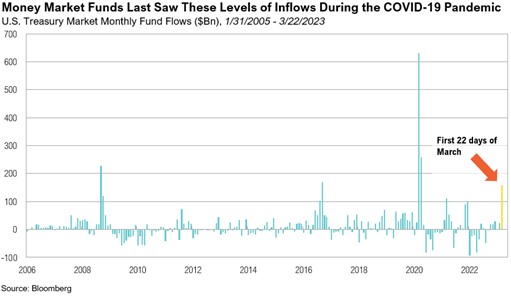
In the seven trading days since the collapse of Silicon Valley Bank (March 13 to March 22), there have been massive inflows to U.S. Treasury money market funds. According to data from Bloomberg, flows have totaled $159 billion—the most since the start of the COVID-19 pandemic in March 2020. In the three days between March 20 and March 22 alone, there was more than $66 billion flowing into treasury money markets, including $20 billion yesterday.
Banks in Europe have also run into issues and have had to be rescued. Credit Suisse, a global investment bank and Switzerland’s second-largest bank (by assets under management), suffered a sharp decline in confidence over the past week, which sent its stock and bond prices tumbling.8 Despite an emergency loan from the Swiss National Bank, which failed to reassure markets, Credit Suisse was finally bought out by rival bank UBS for $3.25 billion—60% less than what the bank was worth two days prior.9
Looking Ahead
At RMB, we expect there could be ripples flowing out of the banking crisis more broadly into risk assets. We continue to monitor developments closely for additional risks and potential opportunities. We believe it is important not to get caught up in the news and headlines around crisis events. Market volatility can create anxiety in the short term but may also present longer-term opportunities. Sticking to long term plans during times of stress is often the best decision for investors. We remain optimistic that the strategies we have in place for our clients will drive long-term success despite the volatility we are currently experiencing.
Citations and Sources
1. CME FedWatch: https://www.cmegroup.com/markets/interest-rates/cme-fedwatch-tool.html?redirect=/trading/interest-rates/countdown-to-fomc.html
2. FOMC: https://www.federalreserve.gov/mediacenter/files/FOMCpresconf20230322.pdf
3. New York Fed: https://www.newyorkfed.org/medialibrary/media/research/global_economy/Crisis_Timeline.pdf
4. Bloomberg: https://www.bloomberg.com/news/articles/2023-03-17/what-is-the-fed-discount-window-why-are-banks-using-it-so-much#xj4y7vzkg
5. Federal Reserve: https://www.federalreserve.gov/regreform/discount-window.htm
6. Federal Reserve: https://www.federalreserve.gov/monetarypolicy/bank-term-funding-program.htm
7. Treasury: https://home.treasury.gov/news/press-releases/jy1354
8. Wall Street Journal: https://www.wsj.com/articles/why-is-credit-suisse-in-trouble-the-banking-turmoil-explained-6f8ddb5b
9. CNN: https://edition.cnn.com/2023/03/21/investing/credit-suisse-banking-crisis-bear-stearns/index.html
Appendix: Start of GFC Timeline (June 2007 to May 2008)
- June 2007: Fed maintains rate at 5.25%.
- August 2007: Fed maintains rate at 5.25%.
- September 2007: Northern Rock Bank receives emergency loan from BoE, Fed lowers rates by 50bps to 4.75%.
- October 2007: Fed lowers rates by 25bps to 4.5%.
- December 2007: Fed lowers rates by 25bps to 4.25%, TAF announced, and swap lines are established with ECB and SNB for $20bn and $4bn respectively, Fed then extends TAF for as long as necessary to address elevated pressures in short-term funding markets.
- January 2008: BofA purchases Countrywide Financial for $4bn, Fed lowers rates by 75bps to 3.5% and later in Jan lowers rates by another 50bps to 3%.
- February 2008: TAF auction size increases to $30bn every two weeks, Economic Stimulus Act signed into law.
- March 2008: TSLF is introduced, Bear Stearns reports a $15bn/88% drop in liquid assets, receives emergency lending from Fed via JPM, Fed lowers rates by 75bps to 2.25%.
- April 2008: Fed lowers rates by 25bps to 2%.
- May 2008: TSLF eligible collateral expands to include AAA rated ABS, TAF swap lines increase.
All market pricing and performance data from Bloomberg, unless otherwise cited. Asset class and sector performance are gross of fees unless otherwise indicated.
The opinions and analyses expressed in this newsletter are based on RMB Capital Management, LLC’s (“RMB Capital”) research and professional experience are expressed as of the date of our mailing of this newsletter. Certain information expressed represents an assessment at a specific point in time and is not intended to be a forecast or guarantee of future results, nor is it intended to speak to any future time periods. RMB Capital makes no warranty or representation, express or implied, nor does RMB Capital accept any liability, with respect to the information and data set forth herein, and RMB Capital specifically disclaims any duty to update any of the information and data contained in this newsletter. The information and data in this newsletter does not constitute legal, tax, accounting, investment or other professional advice. Returns are presented net of fees. An investment cannot be made directly in an index. The index data assumes reinvestment of all income and does not bear fees, taxes, or transaction costs. The investment strategy and types of securities held by the comparison index may be substantially different from the investment strategy and types of securities held by your account. RMB Asset Management is a division of RMB Capital Management.