


Overview
It’s been a great start to the year for markets. In January, both stocks and bonds produced decidedly positive returns. The S&P 500 was up 6.3%, and the Bloomberg U.S. Aggregate Bond Index ended the month up 3.1%. The NASDAQ composite posted its best January since 2001, returning 10.7% for the month.
Earnings season kicked off in January, and 50% of S&P 500 companies have currently reported fourth-quarter 2022 earnings.1 Due to ongoing concerns about a possible economic slowdown or recession, analysts lowered earnings per share (EPS) estimates more than normal for the first quarter.1 Full-year estimates have also been lowered, and expectations now sit at 3.0% growth in 2023 relative to last year, down from 4.8% expected at the end of December.1 Given the decline in earnings expectations and the recent rise in stock prices, the forward 12-month price-earnings ratio of the S&P 500 Index has increased to 18.4x from 16.7x at the end of December—back above its long-term average of 17x.
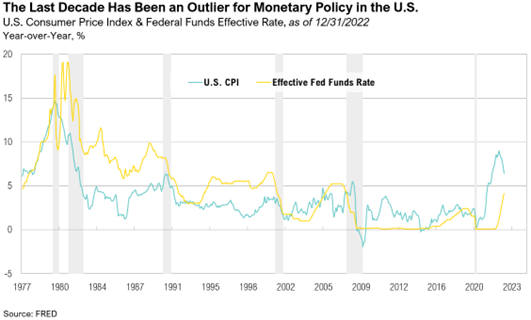
Since mid-2022, central banks around the world have been hiking interest rates to bring inflation back under control, and these tighter monetary policy efforts have started to work. Following record-high levels in many countries in the latter half of 2022, global inflation levels have trended downward but are still above average levels. In the U.S., inflation hit a four-decade high of 9.1% in June 2022, but it has since dropped to a still-high 6.4% as of the end of January. Inflation in the Eurozone has dropped to 8.5% in December from its record-high of 10.6% in October 2022.2
Markets
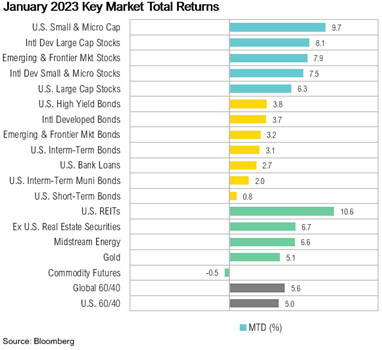
Commodity futures were the only asset class that failed to produce positive returns in January, ending the month marginally down at -0.5%. U.S. REITs and U.S. small cap stocks were the top performers in January, returning 10.6% and 9.7%, respectively. International markets outperformed the U.S., and the MSCI EAFE Index ended up 8.1% while the S&P 500 closed January up 6.3%. Both U.S. and international fixed income markets ended January with positive returns. The Bloomberg U.S. Aggregate Bond Index gained 3.1% while international developed market bonds closed the month up 3.7%. The rally in January was focused on the most beaten-down names of the prior year.
The Bank of England hiked interest rates by 50 basis points to 4% on February 2, with economic forecasts pointing to a shorter and shallower recession in the U.K. than previously anticipated.3 This is welcome news for the U.K., where a rising inflation crisis has spurred widespread worker strikes since mid-2022. The ECB also hiked rates by 50 basis points to 2.5% and has already stated that the next rate hike would be another 50-basis point hike.4
Looking Forward
At RMB, we believe there will be continued volatility in both equity and fixed income markets, as the Federal Reserve continues with their plan to increase interest rates in order to mitigate above average inflation. This environment of decades high inflation and rising interest rates are putting pressure on global growth. Leading economic indicators have turned negative and odds of recession in the next 12 months have increased. The labor market has thus far remained resilient and inflation will probably continue to be sticky for longer than the Fed would like. The trajectory of inflation from here appears to be down but the pace at which the declines occur remains a key component to Federal Reserve policy going forward.
Consistent with last year, we are taking a patient stance. Incoming economic data and the policy developments they help shape are fluid and highly uncertain. While we wait for clarity on these topics, for the first time in more than 15 years, we can earn 4% to 5% on short-term government bonds. We continue to believe that strong fundamentals should help markets over the longer term and that the income component of our client’s investment portfolios – the interest paid from owning bonds and stock dividends – will be a more important factor of investment returns going forward. While we think that the longer-term outlook will continue to improve as yields rise and stocks get cheaper, we would caution that 2023 could be another challenging year for stocks globally. We recommend sticking to long-term investment allocation targets through a diversified portfolio of assets that emphasizes quality and cash flow and taking advantage of rebalancing opportunities as they emerge amongst the volatility. We remain optimistic that the strategies we have in place for our clients will drive long-term success despite the volatility we are currently experiencing.
Citations
1. FactSet: https://insight.factset.com/sp-500-earnings-season-update-january-27-2023
2. Reuters: https://www.reuters.com/markets/europe/euro-zone-inflation-drops-more-than-expected-core-price-growth-holds-steady-2023-02-01/
3. CNBC: https://www.cnbc.com/2023/02/02/bank-of-england-hikes-rates-by-50-basis-points-turns-less-bleak-on-the-economy.html
4. Reuters: https://www.reuters.com/markets/rates-bonds/ecb-raise-rates-again-face-questions-about-future-path-2023-02-01/
Performance Disclosures
All market pricing and performance data from Bloomberg, unless otherwise cited. Asset class and sector performance are gross of fees unless otherwise indicated.
Index Definitions
The S&P 500 Index is widely regarded as the best single gauge of the United States equity market. It includes 500 leading companies in leading industries of the U.S. economy. The S&P 500 focuses on the large cap segment of the market and covers approximately 75% of U.S. equities.
The Bloomberg Barclays U.S. Aggregate Index represents securities that are SEC-registered, taxable, and dollar denominated. The index covers the U.S. investment grade fixed rate bond market, with index components for government and corporate securities, mortgage pass-through securities, and asset-backed securities. Duration is roughly 5 years.
The Bloomberg U.S. Corporate High Yield Bond Index measures the USD-denominated, high yield, fixed-rate corporate bond market. Securities are classified as high yield if the middle rating of Moody’s, Fitch and S&P is Ba1/BB+/BB+ or below. Bonds from issuers with an emerging markets country of risk, based on the indices’ EM country definition, are excluded.
The Russell 1000® Value Index measures the performance of the large-cap value segment of the U.S. equity universe. It includes those Russell 1000 companies with lower price-to-book ratios and lower expected and historical growth rates.
The Russell 1000® Growth Index measures the performance of the large- cap growth segment of the US equity universe. It includes those Russell 1000 companies with relatively higher price-to-book ratios, higher I/B/E/S forecast medium term (2 year) growth and higher sales per share historical growth (5 years).
The Russell 2000® Index measures the performance of the small-cap segment of the US equity universe. It includes approximately 2000 of the smallest US equity securities in the Russell 3000 Index based on a combination of market capitalization and current index membership. The Russell 2000 Index represents approximately 10% of the total market capitalization of the Russell 3000 Index. Because the Russell 2000 serves as a proxy for lower quality, small cap stocks, it provides an appropriate benchmark for RMB Special Situations.
MSCI EAFE Index*: an equity index which captures large and mid-cap representation across 21 of 23 Developed Markets countries around the world, excluding the U.S. and Canada. With 926 constituents, the index covers approximately 85% of the free float-adjusted market capitalization in each country.
The MSCI Emerging Markets Index* measures equity market performance in the global emerging markets universe. It covers over 2,700 securities in 21 markets that are currently classified as EM countries. The MSCI EM Index universe spans large, mid and small cap securities and can be segmented across all styles and sectors.
The U.S. Dollar Index is used to measure the value of the dollar against a basket of six foreign currencies: the euro, Swiss franc, Japanese yen, Canadian dollar, British pound, and Swedish krona.
The Deutsche Bank EM FX Equally Weighted Spot Index, an equal-weighted basket of 21 emerging market currencies.
MSCI U.S. REIT Index is a free float-adjusted market capitalization weighted index that is comprised of equity Real Estate Investment Trusts (REITs). The index is based on the MSCI USA Investable Market Index (IMI), its parent index, which captures the large, mid and small cap segments of the USA market. With 150 constituents, it represents about 99% of the US REIT universe and securities are classified under the Equity REITs Industry (under the Real Estate Sector) according to the Global Industry Classification Standard (GICS®), have core real estate exposure (i.e., only selected Specialized REITs are eligible) and carry REIT tax status.
*Source: MSCI.MSCI makes no express or implied warranties or representations and shall have no liability whatsoever with respect to any MSCI data contained herein. The MSCI data may not be further redistributed or used as a basis for other indexes or any securities or financial products. This report is not approved, endorsed, reviewed or produced by MSCI. None of the MSCI data is intended to constitute investment advice or a recommendation to make (or refrain from making) any kind of investment decision and may not be relied on as such.
All market pricing and performance data from Bloomberg, unless otherwise cited. Asset class and sector performance are gross of fees unless otherwise indicated.
The opinions and analyses expressed in this newsletter are based on RMB Capital Management, LLC’s (“RMB Capital”) research and professional experience are expressed as of the date of our mailing of this newsletter. Certain information expressed represents an assessment at a specific point in time and is not intended to be a forecast or guarantee of future results, nor is it intended to speak to any future time periods. RMB Capital makes no warranty or representation, express or implied, nor does RMB Capital accept any liability, with respect to the information and data set forth herein, and RMB Capital specifically disclaims any duty to update any of the information and data contained in this newsletter. The information and data in this newsletter does not constitute legal, tax, accounting, investment or other professional advice. Returns are presented net of fees. An investment cannot be made directly in an index. The index data assumes reinvestment of all income and does not bear fees, taxes, or transaction costs. The investment strategy and types of securities held by the comparison index may be substantially different from the investment strategy and types of securities held by your account. RMB Asset Management is a division of RMB Capital Management.