


Overview
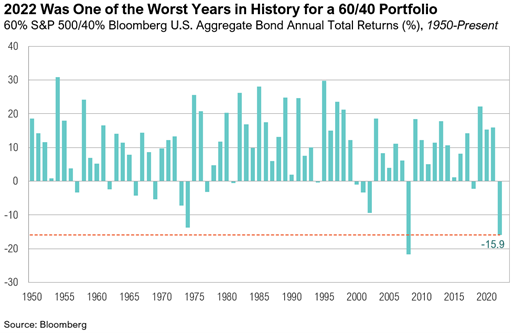
This past year was certainly one to remember, characterized by a four-decade-high inflation rate, rapidly tightening monetary policy, and geopolitical uncertainty. As the Federal Reserve’s efforts to curb inflation showed signs of success in the fourth quarter, both stocks and bonds managed to recover some of their losses from previous quarters. U.S. large cap stocks ended the quarter up 7.6%, and bonds ended up 1.9%. Despite this, it was still one of the worst years for markets since 2008, and stocks and bonds shed more than $30 trillion globally.1 The S&P 500 ended the year down 18.1%, and the Bloomberg U.S. Aggregate Bond Index ended the year down 13%—its worst year since its inception in 1976.2 A traditional 60% stock and 40% bond portfolio had its second-worst year since 1950.
Energy was the top-performing S&P 500 sector for 2022, returning 65.7%. The only other sector that produced positive returns for 2022 was the utility sector, ending the year up 1.6%. The communication services sector led the downside, declining 39.9% over the year. The 105.6% performance gap between energy and communications was the widest performance differential between any two S&P 500 sectors since 1991. The second-widest differential between sectors was in 2000 when utilities outperformed information technology by 98%.
Inflation, the intense focus of 2022, has seemingly peaked. After hitting a high of 9.1% in June 2022, it ended the year with a December reading of 6.5%.3 Slowing, but still-too-high, inflation ushers in the next phase of this cycle and poses a key question for investors. Will tighter monetary policy dampen the economy so much that it enters a recession, or not? The answer will depend on the relative speed in the decline of growth relative to inflation. Should inflation decrease more quickly than economic activity, the U.S. could experience a soft landing (i.e., no recession)—which would be a positive for risky assets. If, however, economic growth slows faster than inflation, then a recession ensues. As it stands, a recession may be the most likely outcome unfortunately. The Treasury yield curve, as measured by the 2-year minus the 10-year Treasury yield, has been inverted since July.4 This inversion has correctly anticipated the past half dozen recessions, going back to the early 1980s.5 Even the Fed’s staff noted in the November Federal Open Market Committee (FOMC) meeting that “the possibility that the economy would enter a recession sometime over the next year as almost as likely as the baseline”.6
Money Like Water
The interplay between monetary and fiscal policy will be another key factor in 2023, and it could significantly complicate the Fed’s efforts to further rein in inflation. Both monetary and fiscal policymakers are focused on what’s best for consumers, but this could lead to counteracting policies. For its part, the Federal Reserve is tightening monetary policy through interest rate hikes and shrinking its balance sheet to remove liquidity from the financial system. The intent is to weaken the labor market and bridle demand in order to get inflation back to its 2% mandate.
“I would like to underscore for the American people that we understand the hardship that high inflation is causing and that we are strongly committed to bringing inflation back down to our 2 percent goal.” – Jerome Powell, Chairman of the Federal Open Market Committee (December 14th, 2022, FOMC Press Conference)7
On the other hand, politicians will likely be compelled to add fiscal stimulus (i.e., liquidity) to the economy and pressure the Fed to ease interest rate hikes if consumers’ financial situation continues to erode and a recession ensues.
“For working Americans who already feel the crush of inflation, job losses will make it much worse. We can’t risk the livelihoods of millions of Americans who can’t afford it. I ask that you don’t forget your responsibility to promote maximum employment and that the decisions you make at the next FOMC meeting reflect your commitment to the dual mandate.” – Sherrod Brown, Chairman U.S. Senate Committee on Banking, Housing & Urban Affairs (October 25th, 2022, Open Letter to Jerome Powell)8
Because the U.S. labor market staged a remarkable recovery from its pandemic downturn and remained robust throughout last year, the Fed’s tightening strategy still has work to do. Throughout 2022, unemployment levels remained near all-time lows, ending 2022 at 3.7%.9 Both initial and ongoing jobless claims ended the year lower than where they started in 2022.10 The ratio of job openings to unemployed people has remained near all-time highs at 1.7x.11 Given the tight labor market, nominal wages remain elevated, growing at a pace well above sustainable levels and contributing to elevated inflation. As the Fed continues to try and clamp down on demand, the unemployment rate should start to increase. According to economist Bill Dudley, “This will require a persistent string of payroll gains of less than 100,000 per month and a rise in the unemployment rate to at least 4.5% from the current 3.7%”.12 In a nod in the right direction, the nonfarm payrolls report for December showed a meaningful cooling of wage growth, and the year-over-year measure fell from 5.0% to 4.6%.13 While this is a positive from the Fed’s inflation-fighting point of view, wage growth remains well below the rate of inflation, eroding the purchasing power of consumers.
Despite a tough backdrop for real (inflation-adjusted) wages, consumers continued spending throughout 2022. Real personal consumption expenditures in 2022 consistently showed year-over-year growth of 2%, right in line with the average growth rate from 2010 to 2019.14 But this spending has come at a cost. The personal savings rate is currently 2.4%—its lowest level since 2005.15 In addition, total consumer credit increased by more than $300 billion—a record—to $4.7 trillion.16 Household debt service payments as a percentage of disposable income have climbed to 9.7%.17 Should economic activity slow further, the labor market starts to dive, and consumer finances worsen, politicians will likely look to pump more cash to consumers via fiscal support, just as they have in the past three recessions. Such measures would counteract the Fed’s efforts to reduce demand.
Historically, the U.S. government has responded to recessions by providing stimulus predominantly in the form of tax cuts and stimulus checks. In 2001, the U.S. government responded to the recession by implementing the Economic Growth and Tax Relief Reconciliation Act of 2001, which led to $1.35 trillion in tax relief.18 In a similar response to the 2008 Global Financial Crisis, the U.S. government implemented the Economic Stimulus Act of 2008.The act provided stimulus checks of up to $600 for individual taxpayers and tax cuts that provided $1.7 trillion in relief throughout 2008.19 With the onset of the global COVID-19 pandemic in March 2020, the U.S. government pumped a total of at least $4 trillion in economic relief into the economy, distributing a series of stimulus checks—free money—totaling $3,200 to residents between April 2020 and March 2021.20
Stimulus checks directly affected consumer spending, as evidenced by the rise and subsequent fall in retail sales in the months following the checks’ issuance. For example, retail sales jumped 5.0% in January 2021 after the second round of stimulus checks at the end of December 2020, but then slipped down 1.9% in February 2021.21 Nineteen states also issued their own stimulus checks, and these similarly affected retail sales.22 California sent up to $1,050 in October, which totaled $4.1 billion in payments to residents.23 Were it a country, California would be the world’s fifth-largest economy, and the effect of its stimulus appeared to show up in national retail sales.24 In October, U.S. retail sales were up 1.3% on a month-over-month basis, the second-largest increase in 2022. In the next month, November 2022, however, retail sales hit their lowest point for the year, down 0.8%.21 The government has also bolstered consumers via Cost-of-Living Adjustments (COLA) for Social Security, which will increase by 8.7% in 2023, topping the 2022 adjustment of 5.9%—which at that time was the highest adjustment since 1982.25 If 2022 patterns repeat, these cash infusions could boost short-term spending at the cost of longer-term inflation.

Should the federal government continue to spend money like water to rescue the consumer and the economy in 2023, it will be doing so from a substantially weakened financial position, which makes any decision a very delicate one. As of the start of the fourth quarter of 2022, the U.S. debt-to-GDP ratio was over 120%.26 For context, in 2013, the U.S. debt-to-GDP ratio surpassed the 100% mark when both debt and GDP were approximately $16.7 trillion.27 Furthermore, as interest rates have risen, the cost to finance the growing debt of the U.S. has risen too. During the 2022 fiscal year, the federal government made $475 billion in net interest payments, up from $352 billion the prior year.27 The estimated annual interest cost now represents 35% of current federal tax receipts.27
There is a recent precedent for concern around excessive fiscal spending. In early October, an economic package announcement by the U.K. government led to widespread market turmoil and the ultimate explosion of U.K. government bond yields. The economic package included the country’s largest tax cut plan since the 1970s, costing the government more than $169 billion (£150 billion)28. Consequently, the British bond market imploded, causing significant losses to U.K. pension plans amongst others and ultimately forcing the Bank of England to intervene.29 In the weeks following the turmoil, Liz Truss resigned, serving the shortest term ever by a British prime minister.30 Hopefully, lessons can be learned from the recent mistakes of other politicians.
Complicating fiscal spending decisions in 2023 is the fact that the debt ceiling (or debt limit) was hit in November at $31.4 trillion.31 The debt ceiling is the total amount of money that the U.S. government is authorized to borrow to be able to meet its existing legal obligations, such as Social Security, Medicare, military salaries, interest
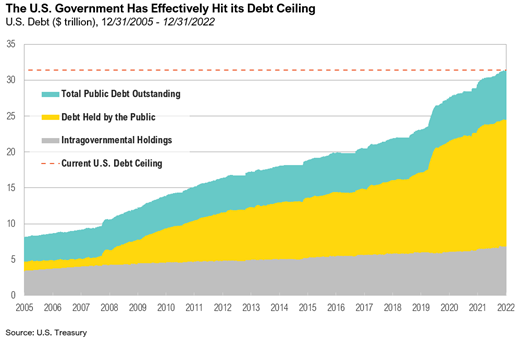
payments on the national debt, and tax refunds.32 The debt ceiling was created in 1917 to make financing World War I easier.33 Until 1952, the debt ceiling was routinely raised without any problems. When the debt ceiling is raised, it lets government borrow more to cover the gap between spending and taxes already approved by Congress. Since 1960, Congress has raised the debt ceiling 78 times—49 times under Republican presidents and 29 times under Democratic presidents.32
Once the debt ceiling has been reached, the U.S. Treasury can use a variety of “extraordinary” accounting processes to lower debt levels and avoid running out of cash and risking a technical default on its debt. These extraordinary measures include prematurely redeeming Treasury bonds held in federal employee retirement savings accounts; halting contributions to certain government pension funds; and borrowing from cash reserves set aside to manage possible exchange rate fluctuations.32 On December 23, Congress passed a nearly $1.7 trillion spending bill to fund the federal government through September 2023 but failed to address this key issue.34 While the political negotiations and ultimate resolution in previous debt ceiling increases never were considered material risks, the current situation has the potential to lead to market volatility.
The debt ceiling debate has already greatly affected liquidity in the U.S. In October, the U.S. Treasury announced that it expected to borrow $550 billion in the fourth quarter, assuming an end-of-year cash balance of $700 billion.35 However, given that the debt ceiling was reached earlier in the quarter, issuance came in well below expectations at $373 billion, including paying down debt by $3 billion in December.35 To fund the shortfall, the U.S. Treasury had to take down its cash balance by nearly $200 billion to $447 billion—well below the year-end goal of $700 billion.35 This lack of debt issuance, paydown of debt, and drawdown of cash acts as a source of liquidity to markets. For the first quarter, the U.S. Treasury estimated that it would need to borrow $578 billion, assuming an end-of-March 2023 cash balance of $500 billion. In lieu of issuing debt, the U.S. Treasury continues to spend its cash, down another $100 billion to start 2023.35 When the debt ceiling is resolved, it will create a tsunami of bond issuance that may drain significant liquidity from the system.
Markets
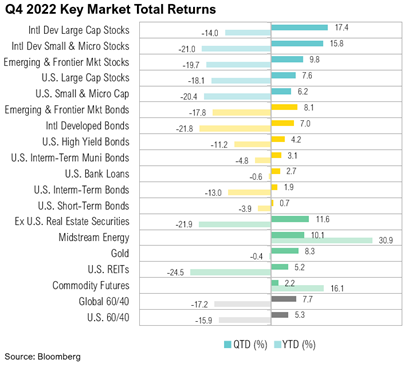
Asset classes rebounded in the last quarter of 2022. International developed market stocks were the top performers over the quarter. International large cap stocks ended up 17.4%, and international small cap stocks ended up 15.8%. The Russell 1000 Value Index significantly outperformed the Russell 1000 Growth Index, returning 12.4% and 2.2% over the fourth quarter, respectively. The S&P 500 ended the quarter up 7.6%. In a year in which only three asset classes ended with positive returns, the top performer was midstream energy, which generated a one-year return of 30.9%. The worst-performing asset class of 2022 was U.S. REITs, ending the year down 24.5%.
For the fourth quarter of 2022, the estimated earnings decline for the S&P 500 is -4.1%.36 Given ongoing concerns about the rising probability of a recession and uncertain economic conditions, analysts lowered earnings per share (EPS) estimates for S&P 500 companies more than usual in the fourth quarter.36 Earnings estimates for the 2023 calendar year were also lowered, declining by 4.4% throughout the fourth quarter of 2022.36 Expectations are now for $225 per share, which would represent 4.7% growth relative to 2022 should estimates be met.37
Both U.S. and international fixed income ended the fourth quarter with positive returns. Despite international developed market bonds being one of the best performers out of fixed income in the last quarter of 2022, they were the worst performer for the year, ending down 21.8%. Across the board, it was a tough year overall for fixed income. The best-returning asset classes for the year were midstream energy and commodity futures, ending 2022 up 30.9% and 16.1%, respectively.
In October, the Bank of Japan conducted emergency bond-buying operations in continued efforts to maintain control over yield spreads.38 The Bank of Japan is the largest holder of Japanese government bonds, holding 51.4% as of December 20.39 Coupled with this, the Bank of Japan’s efforts to maintain ultra-low interest rates and yield curve control have often resulted in the Japanese bond market not trading for days on end. For example, Japanese 10-year government bonds did not trade for five consecutive days from October 7 to October 13 this year.40 Japanese equities ended the quarter up 3.3%, while Japanese government bonds ended the fourth quarter down 1.9%.
On December 3, members of the G7 formally placed a price cap of $60 per barrel of Russian oil.41 The price cap applies to petroleum oils, crude oil, and any oils that originate in or are exported from Russia.42 The price cap, which came into effect on December 5, aims to reduce Russia’s revenues earned from oil exports and curb its ability to finance its invasion of Ukraine.41 Since Russia invaded Ukraine in February 2022, energy prices have pushed significantly upward. Energy prices surged 60% in 2022, adding to the rising cost of living, particularly in Europe.43
Looking Forward
From our perspective, the interplay between fiscal policymakers, the Federal Reserve, and market participants will determine the trajectory for markets in 2023. As we have seen recently, markets have become hypersensitive to increasingly heavy-handed policy decisions. With an inverted Treasury yield curve strongly suggesting a U.S. economic recession, policy decisions become even more critical to determining the magnitude and duration of the economic slowdown and how markets respond to it.
At RMB, we believe there will be continued volatility in both equity and fixed income markets, as the Federal Reserve continues with their plan to increase interest rates in order to mitigate high inflation. This environment of decades high inflation and rising interest rates are putting pressure on global growth. Leading economic indicators have recently turned negative and odds of recession in the next 12 months have increased significantly. The labor market has thus far remained resilient and inflation will probably continue to be sticky for longer than the Fed would like.
Consistent with last year, we are taking a patient stance, holding all views with an “open hand,” so to speak. Incoming economic data and the policy developments they help shape are fluid and highly uncertain. While we wait for clarity on these topics, for the first time in more than 15 years, we can earn 4% to 5% on short-term government bonds. We continue to believe that strong fundamentals should help markets over the longer term and that the income component of our client’s investment portfolios – the interest paid from owning bonds and stock dividends – will be a more important factor of investment returns going forward. While we think that the longer-term outlook will continue to improve as yields rise and stocks get cheaper, we would caution that 2023 could be another challenging year for stocks globally. Going in to 2023, we recommend sticking to long-term investment allocation targets through a diversified portfolio of assets that emphasizes quality and cash flow and taking advantage of rebalancing opportunities as they emerge amongst the volatility. We remain optimistic that the strategies we have in place for our clients will drive long-term success despite the volatility we are currently experiencing.
Citations
1. Financial Times: https://www.ft.com/content/87ed8ea6-4913-4452-9135-498040ad338f
2. JP Morgan: https://am.jpmorgan.com/us/en/asset-management/adv/insights/market-insights/guide-to-the-markets/guide-to-the-markets-slides-us/fixed-income/gtm-blusanualreturns/
3. FRED: https://fred.stlouisfed.org/series/CPIAUCSL#0
4. FRED: https://fred.stlouisfed.org/series/T10Y2Y
5. Morningstar: https://www.morningstar.com/articles/1086193/what-is-a-yield-curve-and-why-are-investors-worried
6. FOMC November Minutes: https://www.federalreserve.gov/monetarypolicy/files/fomcminutes20221102.pdf
7. FOMC December Minutes: https://www.federalreserve.gov/monetarypolicy/files/fomcminutes20221214.pdf
8. Sherrod Brown: https://www.banking.senate.gov/imo/media/doc/fed_full_employment_letter.pdf
9. BLS: https://data.bls.gov/timeseries/LNS14000000
10. FRED: https://fred.stlouisfed.org/series/ICSA
11. Bloomberg: https://www.bloomberg.com/news/articles/2023-01-04/us-job-openings-remain-highly-elevated-at-10-46-million#xj4y7vzkg
12. Bill Dudley: https://www.bloomberg.com/opinion/articles/2023-01-03/what-could-go-wrong-for-the-federal-reserve-in-2023
13. BLS: https://www.bls.gov/news.release/empsit.nr0.htm
14. FRED: https://fred.stlouisfed.org/series/PCEC96
15. FRED: https://fred.stlouisfed.org/series/PSAVERT
16. Federal Reserve: https://www.federalreserve.gov/releases/g19/current/
17. FRED: https://fred.stlouisfed.org/series/TDSP
18. White House Archives: https://georgewbush-whitehouse.archives.gov/infocus/bushrecord/factsheets/taxrelief.html
19. U.S. Congress: https://www.congress.gov/bill/110th-congress/house-bill/5140
20. U.S. Government: https://www.usa.gov/covid-stimulus-checks
21. FRED: https://fred.stlouisfed.org/series/RSXFS
22. Forbes: https://www.forbes.com/advisor/personal-finance/states-gas-stimulus-checks/
23. Forbes: https://www.forbes.com/advisor/personal-finance/california-gas-rebate-stimulus-check/
24. California Government: https://www.gov.ca.gov/2022/10/24/icymi-california-poised-to-become-worlds-4th-biggest-economy/
25. SSA: https://www.ssa.gov/cola/
26. Macro Trends: https://www.macrotrends.net/1381/debt-to-gdp-ratio-historical-chart
27. Treasury: https://fiscaldata.treasury.gov/americas-finance-guide/national-debt/
28. WSJ: https://www.wsj.com/articles/u-k-announces-package-of-sweeping-tax-cuts-11663926079?mod=article_inline
29. Bank of England: https://www.bankofengland.co.uk/news/2022/september/bank-of-england-announces-gilt-market-operation
30. History: https://www.history.co.uk/articles/the-7-shortest-serving-uk-prime-ministers-in-modern-history
31. U.S. Treasury: https://fiscaldata.treasury.gov/datasets/debt-to-the-penny/debt-to-the-penny
32. U.S. Treasury: https://home.treasury.gov/policy-issues/financial-markets-financial-institutions-and-fiscal-service/debt-limit
33. House Budget Committee: https://democrats-budget.house.gov/publications/fact-sheet/debt-ceiling-explainer
34. CNBC: https://www.cnbc.com/2022/12/23/us-house-passes-1point7-trillion-bill-to-fund-government-through-september-sending-it-to-bidens-desk-.html
35. TreasuryDirect: https://treasurydirect.gov/auctions/announcements-data-results/announcement-results-press-releases/cash-pay-down/
36. FactSet: https://insight.factset.com/have-analysts-lowered-eps-estimates-more-than-average-for-sp-500-companies-for-q4
37. Bloomberg: https://www.bloomberg.com/opinion/articles/2023-01-10/earnings-outlooks-for-2023-will-hang-on-price-to-recession#xj4y7vzkg
38. Reuters: https://www.reuters.com/markets/asia/bank-japan-conduct-emergency-bond-buying-yen-teeters-near-150-2022-10-20/
39. Nikkei Asia: https://asia.nikkei.com/Business/Markets/Bonds/BOJ-holds-over-50-of-Japanese-government-bonds-for-1st-time#:~:text=The%20central%20bank%20held%20a,continued%20upward%20pressure%20on%20rates
40. NASDAQ: https://www.nasdaq.com/articles/japans-10-year-jgbs-trade-for-1st-time-in-5-days-yield-gap-widens
41. CNBC: https://www.cnbc.com/2022/12/05/oil-tankers-en-route-to-russia-as-oil-price-cap-on-exports-hits.html
42. Baker Mackenzie: https://sanctionsnews.bakermckenzie.com/g7-sets-price-cap-for-russian-oil-at-usd-60-per-barrel/
43. World Bank: https://www.worldbank.org/en/news/press-release/2022/10/26/commodity-markets-outlook#:~:text=After%20surging%20by%20about%2060,over%20the%20past%20five%20years
Performance Disclosures
All market pricing and performance data from Bloomberg, unless otherwise cited. Asset class and sector performance are gross of fees unless otherwise indicated.
Index Definitions
The S&P 500 Index is widely regarded as the best single gauge of the United States equity market. It includes 500 leading companies in leading industries of the U.S. economy. The S&P 500 focuses on the large cap segment of the market and covers approximately 75% of U.S. equities.
The Bloomberg Barclays U.S. Aggregate Index represents securities that are SEC-registered, taxable, and dollar denominated. The index covers the U.S. investment grade fixed rate bond market, with index components for government and corporate securities, mortgage pass-through securities, and asset-backed securities. Duration is roughly 5 years.
The Bloomberg U.S. Corporate High Yield Bond Index measures the USD-denominated, high yield, fixed-rate corporate bond market. Securities are classified as high yield if the middle rating of Moody’s, Fitch and S&P is Ba1/BB+/BB+ or below. Bonds from issuers with an emerging markets country of risk, based on the indices’ EM country definition, are excluded.
The Russell 1000® Value Index measures the performance of the large-cap value segment of the U.S. equity universe. It includes those Russell 1000 companies with lower price-to-book ratios and lower expected and historical growth rates.
The Russell 1000® Growth Index measures the performance of the large- cap growth segment of the US equity universe. It includes those Russell 1000 companies with relatively higher price-to-book ratios, higher I/B/E/S forecast medium term (2 year) growth and higher sales per share historical growth (5 years).
The Russell 2000® Index measures the performance of the small-cap segment of the US equity universe. It includes approximately 2000 of the smallest US equity securities in the Russell 3000 Index based on a combination of market capitalization and current index membership. The Russell 2000 Index represents approximately 10% of the total market capitalization of the Russell 3000 Index. Because the Russell 2000 serves as a proxy for lower quality, small cap stocks, it provides an appropriate benchmark for RMB Special Situations.
MSCI EAFE Index*: an equity index which captures large and mid-cap representation across 21 of 23 Developed Markets countries around the world, excluding the U.S. and Canada. With 926 constituents, the index covers approximately 85% of the free float-adjusted market capitalization in each country.
The MSCI Emerging Markets Index* measures equity market performance in the global emerging markets universe. It covers over 2,700 securities in 21 markets that are currently classified as EM countries. The MSCI EM Index universe spans large, mid and small cap securities and can be segmented across all styles and sectors.
The U.S. Dollar Index is used to measure the value of the dollar against a basket of six foreign currencies: the euro, Swiss franc, Japanese yen, Canadian dollar, British pound, and Swedish krona.
The Deutsche Bank EM FX Equally Weighted Spot Index, an equal-weighted basket of 21 emerging market currencies.
MSCI U.S. REIT Index is a free float-adjusted market capitalization weighted index that is comprised of equity Real Estate Investment Trusts (REITs). The index is based on the MSCI USA Investable Market Index (IMI), its parent index, which captures the large, mid and small cap segments of the USA market. With 150 constituents, it represents about 99% of the US REIT universe and securities are classified under the Equity REITs Industry (under the Real Estate Sector) according to the Global Industry Classification Standard (GICS®), have core real estate exposure (i.e., only selected Specialized REITs are eligible) and carry REIT tax status.
*Source: MSCI.MSCI makes no express or implied warranties or representations and shall have no liability whatsoever with respect to any MSCI data contained herein. The MSCI data may not be further redistributed or used as a basis for other indexes or any securities or financial products. This report is not approved, endorsed, reviewed or produced by MSCI. None of the MSCI data is intended to constitute investment advice or a recommendation to make (or refrain from making) any kind of investment decision and may not be relied on as such.
All market pricing and performance data from Bloomberg, unless otherwise cited. Asset class and sector performance are gross of fees unless otherwise indicated.
The opinions and analyses expressed in this newsletter are based on RMB Capital Management, LLC’s (“RMB Capital”) research and professional experience are expressed as of the date of our mailing of this newsletter. Certain information expressed represents an assessment at a specific point in time and is not intended to be a forecast or guarantee of future results, nor is it intended to speak to any future time periods. RMB Capital makes no warranty or representation, express or implied, nor does RMB Capital accept any liability, with respect to the information and data set forth herein, and RMB Capital specifically disclaims any duty to update any of the information and data contained in this newsletter. The information and data in this newsletter does not constitute legal, tax, accounting, investment or other professional advice. Returns are presented net of fees. An investment cannot be made directly in an index. The index data assumes reinvestment of all income and does not bear fees, taxes, or transaction costs. The investment strategy and types of securities held by the comparison index may be substantially different from the investment strategy and types of securities held by your account. RMB Asset Management is a division of RMB Capital Management.