


Overview
October was a great month for risky assets as the S&P 500 Index posted a return of 8.1%. Beneath the surface, the performance between growth and value investing styles was more volatile. The Russell 1000® Value Index, a proxy for large cap value stocks, ended the month up 10.1%, sharply outperforming the Russell 1000® Growth Index, which ended the month up 5.8%. In months with positive equity returns, large cap value stocks rarely outperform growth stocks by more than 4%. (In fact, this has only happened seven times since 2000, and four of those occasions occurred since February 2021).

The largest driver for this difference is the outperformance of energy relative to technology and communications services companies. For instance, energy, widely considered a value sector, is outperforming communications services, typically a growth sector, by 108% in 2022. This is the second-widest ten-month differential between any two sectors, going back all the way to 1989. The widest differential between any two sectors in history was also between the energy sector and the communications services sector (with a dispersion of 109%) in May 2022. Year to date, the energy sector, up 69%, is the only sector in the S&P 500 that has produced positive returns. In comparison, the technology sector is down more than 26% for the year, and the communications services sector has fallen 39% year to date.
Defanging the FAANGs
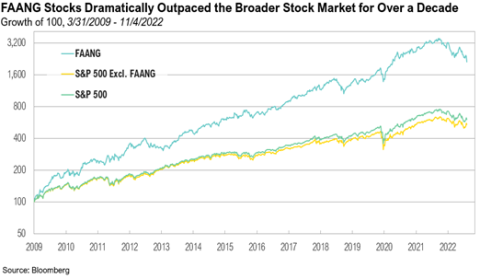
The reversal in the long-term market dominance of the FAANG stocks has loomed large over this year’s markets. Although the FAANG acronym can now be used to refer to several large high-tech companies, for our purposes, we’ll use the classic definition in this commentary and focus on Facebook (now Meta), Amazon, Apple, Netflix, and Google. From the end of the Global Financial Crisis in March 2009 to the peak of the bull market in December 2021, these five companies—the fast-growing darlings of the bull market—generated a total return of approximately 3,424%. Excluding the five FAANG companies, the S&P 500 returned only 529% over the same period—over 117% lower than the return when these companies are included. Due to this substantial and sustained outperformance compared to other equities, by December 2021, the FAANG stocks collectively had grown to account for almost 10% of the U.S. total market capitalization.1
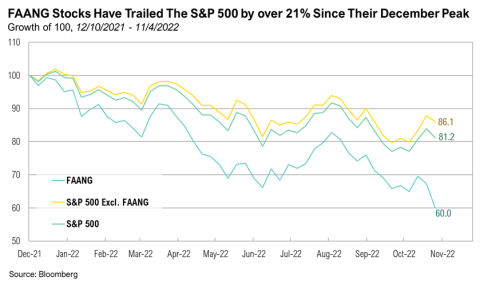
Yet over the past 12 months, these market darlings have experienced a reversal of fortunes. Since the Nasdaq Composite Index peaked in November 2021, the FAANGs have faced increasing pressure that ultimately led to a quite painful October. For instance, on February 3, Meta lost $119 billion—an historic wipeout of 26.4%, the largest one-day loss in market capitalization in history for a U.S. company.2 Similarly, by the end of October, Amazon was down 50.8% from its peak in July 2021. On April 29 alone, it fell 14%–its worst day since 2006.3 Relatively speaking, Apple has been one of the few tech companies that has weathered the current drawdown, down only 23.7% from its peak in December 2021. On the other hand, Meta is leading the decline, down 72.2% from its peak in September 2021. Netflix is down 62.6% from its November 2021 peak, and Google is down 40.9% from its November 2021 peak. On the heels of their earnings and guidance announcements, the FAANG stocks ended October with year-to-date losses of more than $3.8 trillion in market capitalization—a stupefying amount larger than the gross domestic product of the United Kingdom.4
A recent whirlwind of poor earnings results took another bite out of FAANG stock prices. In October, Google’s parent company, Alphabet, had its worst day since March 2020, dropping more than 9% the day after releasing disappointing third-quarter results.5 As of the end of October, the communications services sector has reported an 18.9% decline in earnings growth for the third quarter, the worst year-over-year decline for all the S&P 500 sectors.6 In contrast, the energy sector reported a 134% earnings increase on a year-over-year basis —the highest earnings growth of all eleven S&P 500 sectors.6 These gains are largely due to elevated oil prices. The average price of oil in the third quarter of 2022 fetched a price of approximately $91—almost $20 higher than the same time a year prior.
Also in October, Meta had its worst week since the company became a publicly traded stock in 2012. It fell short of earnings expectations and reported its lowest average revenue per user since 2020.7 The day after, Meta’s share price dropped 24.6%. The decline in Meta’s price-to-earnings (PE) ratio, a very rough proxy for its valuation, has highlighted the astonishing shift in investors’ enthusiasm for these companies. In September 2020, the company’s PE ratio was 47x. By the end of October, that had fallen to just above 7x. In addition, Meta is facing numerous headwinds, including a widespread slowdown in online advertising spending, foreign currency pressures, and Apple’s privacy changes, which are estimated to cost Meta approximately $10 billion or more in 2022.8 Overall, Meta’s net income in the third quarter was down 52% to $4.4 billion. The company’s guidance for the fourth quarter was also weak, and expectations point to a second consecutive decline in its year-over-year sales. Fourth-quarter revenue is estimated to be in the range of $30 - $32.5 billion, and foreign currency is expected to pose a 7% headwind to total quarter revenue growth.9 In early November, Meta also warned of imminent cost cuts and restructuring plans, and it expects to lay off more than 11,000 workers as part of anticipated widespread job cuts.10
Amazon also reported disappointing results in October, including a negative fourth-quarter sales forecast and a slowdown in its core online retail business following the pandemic-related boom. The company’s share price declined 6.8% the day after reporting earnings. As with many of its FAANG counterparts, Amazon faces a challenging macroeconomic environment, given high inflation, combined with pandemic-weary consumers’ return to in-person shopping. Although its net sales increased 15% year over year, the company’s operating income decreased to $2.5 billion in the third quarter, compared to $4.9 billion in the same quarter the year prior.11 Fourth-quarter guidance for net sales are expected to be between $140 billion and $148 billion—or 2% to 8% compared with the fourth quarter of 2021. The guidance anticipates the negative impact of foreign exchange rates on growth. Amazon also reported a hiring freeze that is expected to last for the next few months, citing the unusual macroeconomic environment and broader uncertainty.12
Alphabet’s subsidiary business experienced similar difficulties. At Google, revenue growth slowed to 6% from 41% the year prior, and YouTube revenue also declined, though Alphabet’s cloud revenue increased from $5 billion in the previous year to almost $7 billion this year.13 Alphabet reported advertising revenue of approximately $54.4 billion during the last quarter, slightly higher than the prior year’s, despite a slowdown in spending on search advertising. To explain these declines, the company has cited the uncertain economic environment, which has caused both consumers and businesses to reassess their spending and budgets.13
In contrast to its peers, Apple reported positive third-quarter earnings, beating expectations for profit and revenue, and its share price jumped 7.6% the day after its announcement. Apple is one of the few tech companies that has held up in the current drawdown, compared to the rest of the FAANG group, which is down more than 30%. The company’s revenue increased to $90.1 billion—up by 8%—for the last quarter, and CEO Tim Cook cited foreign exchange headwinds hurting revenue growth by 6% for the quarter.14 Apple withheld from providing official guidance for the next quarter, the biggest sales season of the year, due to uncertainty. In fact, the company has not provided guidance since 2020. Despite this, CFO Luca Maestri did offer some directional insight. During the past quarter, Mac sales increased by 25%, but Maestri does not expect this trend to continue throughout the next quarter. While services reported just under 5% quarterly growth, the company expects this growth will also slow due to macroeconomic headwinds.15 Like other big tech companies, Apple recently announced a hiring freeze ahead of its results report at the end of October. Apple is escalating an existing plan to reduce budgets as macroeconomic uncertainties cloud the industry.16
Netflix is the only other member of FAANG that produced positive earnings results in the third quarter, and its share price jumped 13.1% the day after its earnings announcement. During the third quarter, the company’s consumer-centric approach was resoundingly validated. It added nearly 2.4 million customers over the quarter and projects it will add another 4.5 million in the fourth quarter. CFO Spencer Neumann emphasized that the “FX drag” has hurt earnings and international revenue, which constitute 60% of its top line.17 Yet despite the negative impacts of a strong dollar, Netflix still provided positive guidance for the coming quarter. The company anticipates revenue of approximately $7.8 billion, as well as a significant increase in users. In partnership with Microsoft, Netflix will soon launch a new, cheaper, ad-based subscription option. The company has also set its sights on eliminating any factors that could slow its growth, including account sharing and competition from other streaming platforms, and is emphasizing content creation and expanding choices for users (from subscription plans to content purchasing).17
Markets
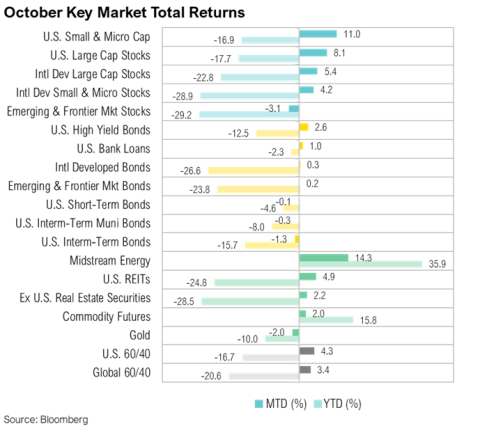
Several key asset classes enjoyed positive results in October. Small cap stocks (as proxied by the Russell 2000) rose 11%, while the S&P 500 posted an 8.1% return for October—the first positive gains since July. Midstream energy was the top performing sector for the month, rising 14.3%. Year to date, midstream energy has returned 35.9%, one of the only asset classes to post positive returns this year. International equities underperformed compared to their U.S. counterparts. The MSCI EAFE Index was up 5.4%, and the MSCI Emerging Markets Index declined 3.1%. Most of this underperformance was due to the continued strength of the U.S. dollar, but a global slowdown in economic growth also played an important role. Year to date, the MSCI Emerging Markets Index declined almost 30%.
The Bank of Japan spent a record $43 billion (¥6.35 trillion) in October as part of an historical intervention to bolster the yen after it sank to a 32-year low against the U.S. dollar.18 The Bank of Japan is steadfastly sticking to its dovish monetary policy and is the only major economy that is still maintaining a zero-interest-rate policy while the rest of the world’s central banks ramp up their rate hikes.19 Japan’s Nikkei Index rose 6.4% in October due to positive earnings expectations, the reopening of the economy, loosening of travel restrictions for tourists, and the weaker yen. The United Kingdom continues to face several challenges, ranging from energy price struggles to the market turmoil left behind by ex-Prime Minister Liz Truss. Inflation in the U.K. is at a 40-year high of 10.1%, and the Bank of England announced its biggest rate hike in over three decades in early November after needing to step into the market recently to stem a sovereign debt crisis.20 U.K. markets ended October up 5.4% and are down 3% year-to-date.
The Bloomberg U.S. Aggregate Index dropped 1.3% in October. The 10-year minus 2-year Treasury yield (a common indicator of economic growth and general representation of the shape of the Treasury yield curve) remains inverted, briefly jumping from -39 basis point to -25 basis points towards the end of October, but it dropped back down to -41 basis points by the end of the month. After the Federal Open Market Committee (FOMC) Monetary Policy meeting in early November, the Treasury yield curve inversion dropped to -51 basis points.21 Emerging market bonds and developed market bonds saw little movement throughout the month, up 0.2% and 0.3%, respectively.
Looking Forward
Prior to October, earnings expectations for 2023 hadn’t dropped significantly, which seemed at odds with the Treasury curve that strongly indicated an impending recession. Recently, however, earnings expectations have started to shift. In January, the S&P 500 was expected to generate operating earnings of $241 per share. Those expectations rose to $249/share by June, but have since declined to $237. While hardly dire, October’s announcements indicate significantly lower earnings expectations for U.S. companies. As recently as June, fourth-quarter earnings were projected to grow 9% on a year-over-year basis.22 By the end of September, those expectations had dropped to 4.5%, and by the end of October, they were down to -1%.22
When exactly earnings hit their low point is critical for anticipating the next phase of the market cycle because earnings growth—or lack thereof—goes a long way in determining whether stocks are cheap, fairly valued, or overvalued. The recent declines in FAANG company earnings and their resulting stock price drops have been harsh reminders of this fact. Given that the U.S. Treasury yield curve has remained inverted since July, which strongly suggests a recession, we would like to see a little more of a bite out of earnings—across all sectors—before we will assume the worst is behind us.
At RMB, we believe there will be continued volatility in both equity and fixed income markets. We believe that incoming inflation data and the central bank responses over the next few months remain crucial to determining where the economy—and markets—are headed. Uncertainty about the outlook for the global economy remains elevated and risks in the short-term are increasing as well.
We continue to believe that strong fundamentals should help markets over the longer term and that the income component of our client’s investment portfolios – the interest paid from owning bonds and stock dividends – will be a more important factor of investment returns going forward. Core fixed income remains a key component of client asset allocations to provide diversification and an income component, which can be used as dry powder to tactically take advantage of market opportunities during volatile times. To help weather this short-term volatility we are likely to experience in the coming months, we continue to recommend clients stick to their long-term investment allocation targets. While we do not think it is a good time to start increasing exposure to risk assets, we continue to look at opportunities to rebalance to target allocations as appropriate and use the market volatility to our benefit by taking advantage of opportunities to selectively make changes within portfolios. We remain optimistic that the strategies we have in place for our clients will drive long-term success. During volatile times, the key to successful investing is often remaining calm and committed to long-term investment plans.
Citations
1. CFI: https://corporatefinanceinstitute.com/resources/equities/faang-stocks/
2. Blomberg: https://www.bloomberg.com/news/articles/2022-02-03/meta-set-for-200-billion-wipeout-among-worst-in-market-history#xj4y7vzkg
3. CNBC: https://www.cnbc.com/2022/04/29/amazon-shares-sink-11percent-on-disappointing-guidance.html
4. CNBC: https://www.cnbc.com/2022/10/27/the-biggest-tech-stocks-have-lost-3-trillion-in-market-cap-the-last-one-year.html
5. CNBC: https://www.cnbc.com/2022/10/26/alphabet-stock-falls-after-disappointing-earnings-report.html
6. FactSet: https://insight.factset.com/sp-500-earnings-season-update-october-28-2022
7. CNBC: https://www.cnbc.com/2022/10/28/big-tech-falters-on-q3-2022-results-as-meta-has-worst-week-ever.html
8. Apple: https://www.apple.com/privacy/control/
9. Facebook (Meta): https://investor.fb.com/investor-news/press-release-details/2022/Meta-Reports-Third-Quarter-2022-Results/default.aspx
10. CNN: https://edition.cnn.com/2022/11/09/tech/meta-facebook-layoffs/
11. Amazon: https://ir.aboutamazon.com/news-release/news-release-details/2022/Amazon.com-Announces-Third-Quarter-Results/
12. Forbes: https://www.forbes.com/sites/brianbushard/2022/11/03/recession-concerns-grow-as-amazon-pauses-hiring-and-major-tech-companies-announce-layoffs-this-week/?sh=5245a2461ba2
13. Alphabet (Google): https://abc.xyz/investor/
14. CNBC: https://www.cnbc.com/2022/10/27/apple-aapl-earnings-q4-2022.html
15. Apple: https://www.apple.com/investor/earnings-call/
16. Bloomberg: https://www.bloomberg.com/news/articles/2022-11-03/apple-pauses-hiring-for-roles-outside-research-and-development#xj4y7vzkg
17. Netflix: https://ir.netflix.net/financials/quarterly-earnings/default.aspx
18. FT: https://www.ft.com/content/e989cd3b-ebda-49dc-ad59-30f1532af531
19. FT: https://www.ft.com/content/f9aca1c2-50c6-4040-8322-6ddfacda6cd6
20. CNBC: https://www.cnbc.com/2022/11/02/bank-of-england-set-for-biggest-rate-hike-in-33-years-but-economists-expect-dovish-tilt.html
21. FRED: https://fred.stlouisfed.org/series/T10Y2Y
22. FactSet: https://insight.factset.com/sp-500-earnings-season-update-november-4-2022
Index Definitions
The S&P 500 Index is widely regarded as the best single gauge of the United States equity market. It includes 500 leading companies in leading industries of the U.S. economy. The S&P 500 focuses on the large cap segment of the market and covers approximately 75% of U.S. equities.
The Bloomberg Barclays U.S. Aggregate Index represents securities that are SEC-registered, taxable, and dollar denominated. The index covers the U.S. investment grade fixed rate bond market, with index components for government and corporate securities, mortgage pass-through securities, and asset-backed securities. Duration is roughly 5 years.
The Bloomberg U.S. Corporate High Yield Bond Index measures the USD-denominated, high yield, fixed-rate corporate bond market. Securities are classified as high yield if the middle rating of Moody’s, Fitch and S&P is Ba1/BB+/BB+ or below. Bonds from issuers with an emerging markets country of risk, based on the indices’ EM country definition, are excluded.
The Russell 1000® Value Index measures the performance of the large-cap value segment of the U.S. equity universe. It includes those Russell 1000 companies with lower price-to-book ratios and lower expected and historical growth rates.
The Russell 1000® Growth Index measures the performance of the large- cap growth segment of the US equity universe. It includes those Russell 1000 companies with relatively higher price-to-book ratios, higher I/B/E/S forecast medium term (2 year) growth and higher sales per share historical growth (5 years).
The Russell 2000® Index measures the performance of the small-cap segment of the US equity universe. It includes approximately 2000 of the smallest US equity securities in the Russell 3000 Index based on a combination of market capitalization and current index membership. The Russell 2000 Index represents approximately 10% of the total market capitalization of the Russell 3000 Index. Because the Russell 2000 serves as a proxy for lower quality, small cap stocks, it provides an appropriate benchmark for RMB Special Situations.
MSCI EAFE Index*: an equity index which captures large and mid-cap representation across 21 of 23 Developed Markets countries around the world, excluding the U.S. and Canada. With 926 constituents, the index covers approximately 85% of the free float-adjusted market capitalization in each country.
The MSCI Emerging Markets Index* measures equity market performance in the global emerging markets universe. It covers over 2,700 securities in 21 markets that are currently classified as EM countries. The MSCI EM Index universe spans large, mid and small cap securities and can be segmented across all styles and sectors.
The U.S. Dollar Index is used to measure the value of the dollar against a basket of six foreign currencies: the euro, Swiss franc, Japanese yen, Canadian dollar, British pound, and Swedish krona.
The Deutsche Bank EM FX Equally Weighted Spot Index, an equal-weighted basket of 21 emerging market currencies.
MSCI U.S. REIT Index is a free float-adjusted market capitalization weighted index that is comprised of equity Real Estate Investment Trusts (REITs). The index is based on the MSCI USA Investable Market Index (IMI), its parent index, which captures the large, mid and small cap segments of the USA market. With 150 constituents, it represents about 99% of the US REIT universe and securities are classified under the Equity REITs Industry (under the Real Estate Sector) according to the Global Industry Classification Standard (GICS®), have core real estate exposure (i.e., only selected Specialized REITs are eligible) and carry REIT tax status.
“FAANG” is an acronym that refers to the stocks of five prominent American technology companies: Meta (META) (formerly known as Facebook), Amazon (AMZN), Apple (AAPL), Netflix (NFLX); and Alphabet (GOOG) (formerly known as Google).
*Source: MSCI.MSCI makes no express or implied warranties or representations and shall have no liability whatsoever with respect to any MSCI data contained herein. The MSCI data may not be further redistributed or used as a basis for other indexes or any securities or financial products. This report is not approved, endorsed, reviewed or produced by MSCI. None of the MSCI data is intended to constitute investment advice or a recommendation to make (or refrain from making) any kind of investment decision and may not be relied on as such.
Performance Disclosures
All market pricing and performance data from Bloomberg, unless otherwise cited. Asset class and sector performance are gross of fees unless otherwise indicated.
The opinions and analyses expressed in this newsletter are based on RMB Capital Management, LLC’s (“RMB Capital”) research and professional experience are expressed as of the date of our mailing of this newsletter. Certain information expressed represents an assessment at a specific point in time and is not intended to be a forecast or guarantee of future results, nor is it intended to speak to any future time periods. RMB Capital makes no warranty or representation, express or implied, nor does RMB Capital accept any liability, with respect to the information and data set forth herein, and RMB Capital specifically disclaims any duty to update any of the information and data contained in this newsletter. The information and data in this newsletter does not constitute legal, tax, accounting, investment or other professional advice. Returns are presented net of fees. An investment cannot be made directly in an index. The index data assumes reinvestment of all income and does not bear fees, taxes, or transaction costs. The investment strategy and types of securities held by the comparison index may be substantially different from the investment strategy and types of securities held by your account. RMB Asset Management is a division of RMB Capital Management.