

We believe the Russell rebalance illustrates our contention that the labels of “Growth” and “Value” are outdated and ineffective.
FTSE Russell recently performed its annual rebalance of its popular benchmarks, the Russell 1000® Index (large cap), Russell 2000® Index (small cap), and Russell 2500® Index (mid cap), among others. Within these broad indexes, Russell also rebalances its U.S. Style indexes, which are based on growth and value factors. This is significant because as of December 31, 2019 (latest data from Russell), there were $5.7 trillion of active strategies using Russell U.S. Style Indexes as performance benchmarks, and $466 billion using them as the basis for passive investment, for a total of $6.2 trillion in benchmarked assets.[1] Given the impact these changes have on investors’ portfolios, we wanted to highlight some of the challenges inherent in this process.
As “Core” investors, we want the broadest opportunity set from which to choose potential investments; we do not want to fish in a pond that is arbitrarily created each year in a backwards looking manner. We find it telling this year that within existing members of the Russell 2000, 53 companies shifted from the Russell’s growth index to value index, 18 of which are Pharma, Bio and Life Sciences companies; and 29 companies shifted from Russell’s value index to growth index, including 8 Energy companies. Looking at the above Russell U.S. Style Index changes, it is entirely possible that if you are segmenting managers between value and growth, your value manager might be selling energy companies to your growth manager and your growth manager might be selling Life Science, Biotech and Technology to your value manager – You have the same portfolio with higher turnover!
We believe our Life Cycle approach helps us to better understand subtle changes in winners and losers in the competition for capital and to identify the correct path of analysis for each company depending on its position on the Life Cycle. All companies go through development, growth, maturity, and decline, as illustrated by the diagram below.
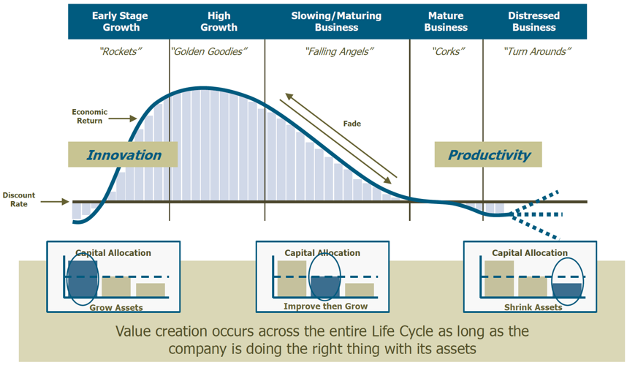
It is important to understand where companies are on the Life Cycle because the fundamental variables that drive corporate performance vary significantly depending upon a company’s position within the Life Cycle (not just whether it’s labeled growth or value). Using this approach allows us to view companies through a distinct lens in order to gain insight as to whether the market is potentially mispricing risk in a way that creates opportunities for our investors.
Instead of labeling companies as growth and value, we work to identify interesting companies in each (distinctively labeled) Life Cycle and then spend all our time understanding these companies to determine what is driving performance – is it skill or luck? Below is a brief overview of each Life Cycle and how companies can create value in each stage, provided they are allocating capital correctly:
Rockets
- Hyper-growth, early-stage companies that consume a lot of fuel (capital) as they try to execute their business model.
- They are typically innovative with either new products, new services or new business processes that may threaten the status quo of existing larger companies.
- Upside potential can be huge and so is downside risk, so appropriate risk budgeting is essential.
Relevant drivers of future wealth creation include: Accelerating organic sales growth, high accounting quality, accelerating business momentum variables such as margins and quarterly sales.
Golden Goodies
- Rockets that have reached orbit and proven that they have viable long-term business models.
- They typically grow faster than the overall market and need to “beat the fade” by continuing to fend off competitive threats.
- These are generally classic asset compounders and will continue to create wealth for as long as they can “beat the fade” as their returns will garner higher competition.
Relevant drivers of future wealth creation include: High organic sales growth, high accounting quality, sustained or improving levels of CFROI and asset growth.
Falling Angels
- Golden Goodies whose growth rates are slowing because they have become so large, or returns are falling because of competition and/or an inability to find reinvestment opportunities at current rates of return.
- What all Falling Angels have in common is that they are typically above average ROI businesses where the market is forecasting an average or below average future.
- Sometimes the market is making an astute forecast, sometimes the market is forecasting a cyclical decline, but other times the market is simply slow to recognize long-term positive change to a new plateau.
Relevant drivers of future wealth creation include: Deep discount to fair value, high free cash flow generation, and investing capital away from lower return business into higher return (similar to a Turnarounds but less extreme).
Corks
- Mature companies where ROIs approximate the cost of capital, like a cork bobbing in the ocean.
- Asset growth typically does not add or destroy value and improving ROI level is critical to wealth creation.
Relevant drivers of future wealth creation include: Improving credit worthiness, high free cash flow generation, attractive risk/reward characteristics, improving ROI. Sometimes, they have suboptimal capital structure (too much leverage).
Turnarounds
- Companies that are the victims of overcapacity, weak competitive position, or poor capital allocation.
- Better capital allocation is critical for wealth creation.
- This often means major restructuring, new management, and debt reduction.
Relevant drivers of future wealth creation include: Improving credit worthiness, improving cash flow generation, attractive risk/reward characteristics, improving margins and asset turns.
As you can see from these descriptions and the varying drivers of growth based on where a company is positioned on the Life Cycle, we believe the market is much more nuanced and complex than traditional style indices would lead you to believe. Growth and Value are arbitrary labels for a more complex process of competition for capital and investor capital allocation. Growth and Value are cyclical in terms of outperformance largely based on factors out of a manager’s control or an allocator’s ability to predict. Last year value outperformed growth, catching many allocators underweight value and overweight growth. Might an extended persistence of elevated commodity prices extend the “value” rally? We don’t know – which is why Core Portfolios seem to make a lot of sense as a natural hedge to this factor betting uncertainty.
We believe that our “Core” portfolio philosophy and process, which utilizes our Life Cycle framework, allows us to insightfully navigate economic value creation and reveal investment opportunities that occur in both the growth and value universes.
The opinions and analyses expressed in this paper are based on RMB Capital Management, LLC’s (“RMB Capital”) research and professional experience and are expressed as of the date of our mailing of this paper. Certain information expressed represents an assessment at a specific point in time and is not intended to be a forecast or guarantee of future performance, nor is it intended to speak to any future time periods. RMB Capital makes no warranty or representation, express or implied, nor does RMB Capital accept any liability, with respect to the information and data set forth herein, and RMB Capital specifically disclaims any duty to update any of the information and data contained in this newsletter. The information and data in this paper does not constitute legal, tax, accounting, investment, or other professional advice.
While “high quality” has no single, strict industry definition, we define high-quality stocks as those that we believe offer more reliability and less risk based on a set of clearly defined fundamental criteria, including hard criteria (e.g., balance sheet stability, operating efficiency, enterprise life cycle) and soft criteria (e.g., management credibility). We define well managed companies as those that intentionally grow assets when their economic return on capital is above the cost of capital, are willing to shrink assets when economic return is below the cost of capital, and actively seek to improve economic return when it is approximately equal to the cost of capital. We define low-quality stocks as those that we believe offer less reliability and more risk based on the clearly defined fundamental criteria listed above.
An investment cannot be made directly in an index. The index data assumes reinvestment of all income and does not bear fees, taxes, or transaction costs. The investment strategy and types of securities held by the comparison index may be substantially different from the investment strategy and types of securities held by the strategies. The benchmarks are shown for comparison purposes and are fully invested and include the reinvestment of income. The Russell 2000 is a subset of the Russell 3000 Index, representing about 8% of the total market capitalization of that index. It includes approximately 2000 of the smallest securities based on a combination of their market cap and current index membership. The Russell 2500 is a subset of the Russell 3000, including approximately 2500 of the smallest securities based on their market cap and current index membership. The strategies include small- to mid-cap equity portfolios. The strategies may target investments in companies with relatively small market capitalizations (generally between $500 million and $10 billion at the time of initial purchase), that are undervalued as suggested by RMB Capital’s proprietary economic return framework. The Russell 2000® Growth Index measures the performance of the small- cap growth segment of the U.S. equity universe. It includes those Russell 2000 companies with relatively higher price-to-book ratios, higher I/B/E/S forecast medium term (2 year) growth and higher sales per share historical growth (5 years). The Russell 2000® Value Index measures the performance of the small- cap value segment of the U.S. equity universe. It includes those Russell 2000 companies with relatively lower price-to-book ratios, lower I/B/E/S forecast medium term (2 year) growth and lower sales per share historical.
IBES (also known as I/B/E/S) stands for Institutional Broker's Estimate System, a database that was created by the Lynch, Jones, and Ryan brokerage. This system basically compiles the analysis and forecasted future earnings of publicly traded companies.
A cash flow return on investment (CFROI) is a valuation metric that acts as a proxy for a company's economic return. This return is compared to the cost of capital, or discount rate, to determine value-added potential. CFROI is defined as the average economic return on all of a company's investment projects in a given year. The return on investment (ROI) is a measure of how well an investment performs.