


Body
Overview
The last quarter of 2021 yielded mostly positive returns for equities and flat returns for fixed income securities. The S&P 500 Index gained 11.0%, while the Bloomberg U.S. Aggregate Bond Index was flat. Markets were helped by delightful amounts of fiscal spending that contributed to an almost $1.2 trillion expansion in the U.S. public debt in the fourth quarter alone.1 This deficit spending was partially funded by the $309 billion expansion in the Federal Reserve’s balance sheet for the quarter and multiples of that for the year.2 In 2021, the S&P 500 returned a stellar 28.7%. Equally as impressive was the fact that the largest drawdown for the index was just 4%, the sixth shallowest decline since 1968. The Bloomberg U.S. Aggregate Bond Index’s flat return for the quarter kept year-to-date losses to 1.5%. This was the third-worst year since the index’s inception in 1975, with the worst year being 1994, when the index returned -2.9%. That year, the 10-year Treasury yield rose from 5.8% to 7.8%. In 2021, the 10-year Treasury yield rose from a paltry 0.93% to a slightly less paltry 1.52%. The Bloomberg Commodity Index declined 1.6%, leaving the asset class up 27.1% in 2021, as prices gained from stimulus-fueled hyperactivity in parts of the economy and COVID-related supply-chain bottlenecks in others. 2021 was the second-best year for commodities since 1980.
But all sugar highs eventually end. Two notable post-Thanksgiving developments stemmed from policymakers’ desire to shift the economic backdrop as we head into 2022. First, Democratic Senator Joe Manchin of West Virginia cited inflation concerns as the main reason for not supporting the roughly $2 trillion Build Back Better legislation:
“My Democratic colleagues in Washington are determined to dramatically reshape our society in a way that leaves our country even more vulnerable to the threats we face. I cannot take that risk with a staggering debt of more than $29 trillion and inflation taxes that are real and harmful to every hard-working American at the gasoline pumps, grocery stores and utility bills with no end in sight."3
Second, the Federal Reserve announced that it would accelerate its timeline to withdraw its accommodation. In the December Federal Open Market Committee (FOMC) meeting, the Fed announced that it would begin reducing asset purchases within its quantitative easing program and that it planned to cease all purchases in the program by March. Further, the Fed indicated that shortly after ceasing new purchases, it would begin to raise interest rates and projected as many as three to four interest rates hikes in 2022.4
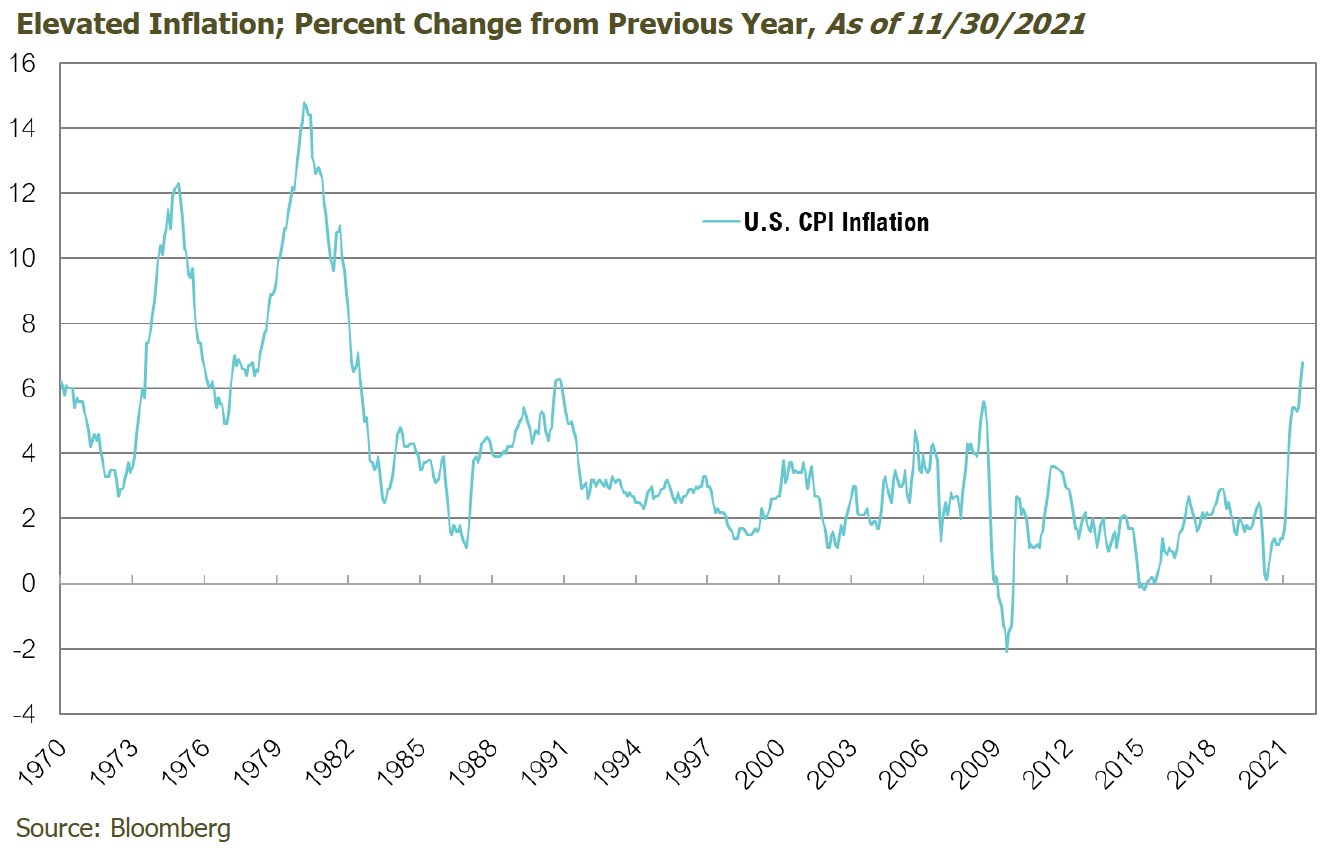
The Federal Reserve’s decision to tighten accommodation and Manchin’s retreat from additional fiscal stimulus are both related to the elevated levels and stickiness of inflation. The November reading of the Consumer Price Index jumped to 6.9% on a year-over-year basis, the highest since 1982.5 This commonly quoted measure of inflation has now stayed above 5% for the past six months. This stretch of CPI readings that have hovered around 5% is the longest since 1982, when inflation was on a downward trajectory from a record high of 15%, set in 1980.5
Image
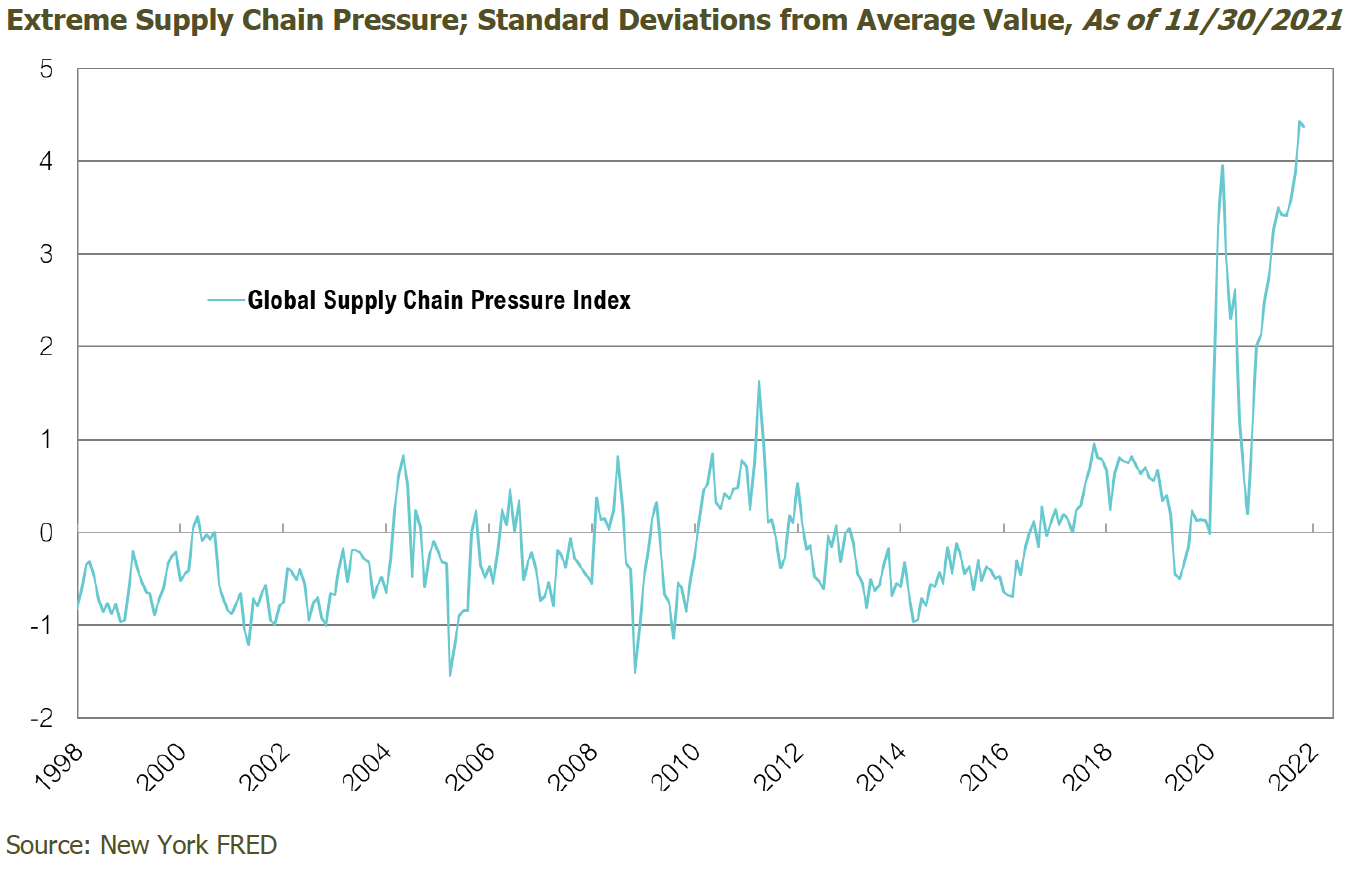
While policymakers’ decisions to withdraw support and raise interest rates should reduce inflationary pressures, supply chain disruptions related to COVID-19 could counteract these efforts. While COVID-19 death rates remained well below prior waves, the U.S. reported six million total active cases in December— substantially more than the 2.5 million cases on average during the first eleven months of the year.6 Outside the U.S., there were nearly 25 million cases in December alone, substantially more than the 16 million averaged through November.7 The prevalence of the Omicron variant and government actions to limit its spread will continue to disrupt supply chains at least until the current surge is behind us. The Global Supply Chain Pressure Index uses 27 metrics to measure different dimensions of potential disruptions in global supply chains.8 This indicator was showing extreme stress in November, even before the Omicron variant had emerged. Despite a challenging near-term outlook, supply chain issues could recede with the passage of time, less demand stemming from less fiscal and monetary stimulus, and the potential for COVID-19 to become endemic.
Image
Less Sugar in 2022
Both monetary and fiscal policymakers are poised to drastically reduce stimulus in 2022. Last year, the Federal Reserve expanded its balance sheet by $1.2 trillion through its bond-buying program (“quantitative easing”).2 Given that the program is expected to cease in March, the Fed is set to purchase substantially fewer bonds in 2022—approximately $360 billion.4 At the same time, fiscal policymakers are poised to deliver meaningfully less support. Including the December 2020 legislation that extended the CARES Act with an additional $900 billion in stimulus,9 last year saw the passage of the nearly $2 trillion American Rescue Plan Act10 and an infrastructure bill estimated at just over $1 trillion.1 In total, these programs provided approximately $4 trillion in support. Senator Manchin’s single-handed defeat of the Build Back Better bill highlighted the divisions within the government, even as the Democrats control both the House and Senate.11 Complicating matters further, President Biden’s approval rating has fallen considerably, further impeding the Democratic agenda.12 Finally, the U.S. is heading into mid-term Congressional elections. With the Build Back Better legislation tabled for now, it is safe to assume that fiscal stimulus in 2022 will trail 2021 levels—and substantially so. Withholding this fiscal “sugar” may help reduce inflation, but it will also affect financial markets, which have gorged themselves on the sweetness of low interest rates, cheap asset purchases, and plentiful stimulus checks. The withdrawal symptoms from nearly two years of an unprecedented sugar high will likely translate to heightened volatility across the economic and capital markets.
This significant reduction in stimulus will not necessarily cause a recession this year and we would caution against comparing the anticipated reduction in monetary support in early 2022 to the fourth quarter of 2018—the last time quantitative easing was significantly reduced. You may recall that the S&P 500 declined by 19% from October to December 2018. However, that drop was primarily in response to what many believe was a tightening gaffe: the Fed had raised interest rates eight times to 2.5% and had been shrinking its balance sheet for about a year.13 However, although the two situations may be very different, markets have never experienced such an abrupt end to such dramatic levels of accommodation, so volatility should be expected.
Looking Forward
The next twelve months could usher in more volatility than investors have experienced in some time, as the economy and markets adjust to lower levels of stimulus. In addition, monetary policy is not on a predefined course because it hinges on incoming data related to inflation, the labor market, and financial conditions, all three of which are now explicitly in the Fed’s purview. Of these, we believe inflation will be the main antagonist for markets this year. Further, incoming data will ebb and flow as the year progresses, so we believe monetary policy will be on a tug-and-pull course between incoming data and policymakers desire to support the economy. In a year like this, we are reminded of a quote often attributed to Mark Twain and Yogi Berra: it is dangerous to make forecasts, especially about the future. As such, we think investors will be well-served to err on the side of humility, discipline, and patience in 2022.
At RMB, we continue to recommend maintaining diversified portfolios of investments that have the potential to perform well in a broad range of market outcomes. As we head into the new year, uncertainty surrounding economic recovery remains and concern over long-term inflation growth. Consumers are still facing higher prices and long delivery times, as shortages within the labor market and supply chain have made delivery of goods difficult for companies. Many investors view these issues as a sign that the inflationary pressures seen over the second half of last year are likely to continue into 2022. As cases increase with the COVID-19 variant Omicron, corrections in equity markets and continued interest rate volatility remain a possibility in this environment. Given this, RMB believes investors should evaluate risk exposures in portfolios. One way for investors to respond in this type of environment is to maintain long-term asset allocation targets to stocks and bonds, but to reduce risk through a focus on high-quality core investments within these allocations. While remaining cognizant of the increasing risks, we continue to focus on balancing opportunities in the current environment and taking advantage of niche markets that present attractive risk/reward opportunities.
Citations
1 CNN: https://www.cnn.com/2021/07/28/politics/infrastructure-bill-explained/index.html
2 FRED: https://fred.stlouisfed.org/series/WALCL#0
3 Joe Manchin Press Release: https://www.manchin.senate.gov/newsroom/press-releases/manchin-statement-on-build-back-better-act
4 FOMC Transcript: https://www.federalreserve.gov/mediacenter/files/FOMCpresconf20211215.pdf
5 FRED: https://fred.stlouisfed.org/series/CPIAUCSL#0
6 CDC COVID Data Tracker: https://covid.cdc.gov/covid-data-tracker/#trends_dailycases
7 Our World in Data: https://ourworldindata.org/covid-cases
9 WSJ: https://www.wsj.com/articles/what-is-in-the-900-billion-covid-19-aid-bill-11608557531
10 Washington Post: https://www.washingtonpost.com/business/2021/03/10/what-is-in-the-stimulus/
12 FiveThirtyEight: https://projects.fivethirtyeight.com/biden-approval-rating/
Disclaimers
Index is widely regarded as the best single gauge of the U.S equity market. It includes 500 leading companies in leading industries of the U.S economy. The S&P 500 focuses on the large cap segment of the market and covers 75% of U.S. equities. The Bloomberg Barclays U.S. Aggregate Bond Index is a broad based benchmark that measures the investment grade. The Bloomberg Commodity Indices (BCOM) are a family of financial benchmarks designed to provide liquid and diversified exposure to physical commodities via futures contracts. The Consumer Price Index (CPI) is a measure of the average change over time in the prices paid by urban consumers for a market basket of consumer goods and services. Indexes are available for the U.S. and various geographic areas. Average price data for select utility, automotive fuel, and food items are also available. The Russell 1000® Growth Index measures the performance of the large- cap growth segment of the US equity universe. It includes those Russell 1000® companies with higher price-to-book ratios and higher forecasted growth values. The Russell 1000® Value Index measures the performance of the large cap value segment of the US equity universe. It includes those Russel 1000® companies with lower price-to-book ratios and lower expected growth values. The Russell 2000® Value Index measures the performance of small-cap value segment of the US equity universe. It includes those Russell 2000® companies with lower price-to-book ratios and lower forecasted growth values The Russell 2000® Growth Index measures the performance of the small- cap growth segment of the US equity universe. It includes those Russell 2000® companies with higher price-to-value ratios and higher forecasted growth values. The MSCI EAFE Index is an equity index which captures large and mid cap representation across 21 Developed Markets countries around the world, excluding the US and Canada. The Bloomberg Barclays 1-10 Year Municipal Blend Index is a market value-weighted index which covers the short and intermediate components of the Barclays Municipal Bond Index—an unmanaged, market value-weighted index which covers the U.S. investment-grade tax-exempt bond market. The Bloomberg Barclays US Corporate High Yield Bond Index measures the USD-denominated, high yield, fixed-rate corporate bond market. Global Supply Chain Pressure Index, documents disruptions to supply chains since 1997. The MSCI EAFE Index is a stock market index that is designed to measure the equity market performance of developed markets outside of the U.S. & Canada.