


Body
Overview
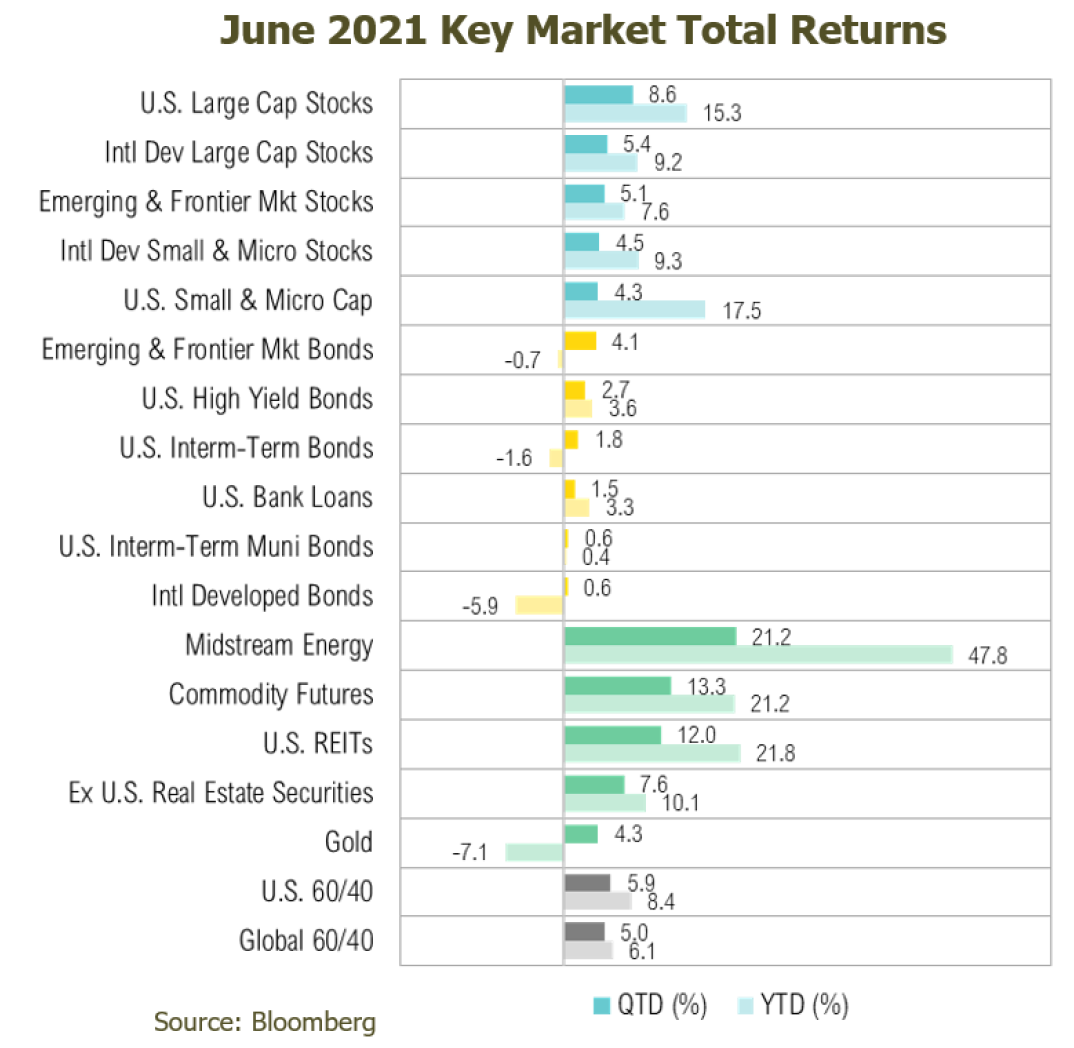
Most asset classes generated attractive returns during the second quarter. As of June 30, 2021, U.S. equities increased 9%, while bonds rose by 2%. Commodities increased 13%, leaving them up 21% for the first half of the year. The S&P 500 Index is now up 15% for the year, while the Bloomberg Barclays U.S. Aggregate Bond Index is down 2% so far this year.
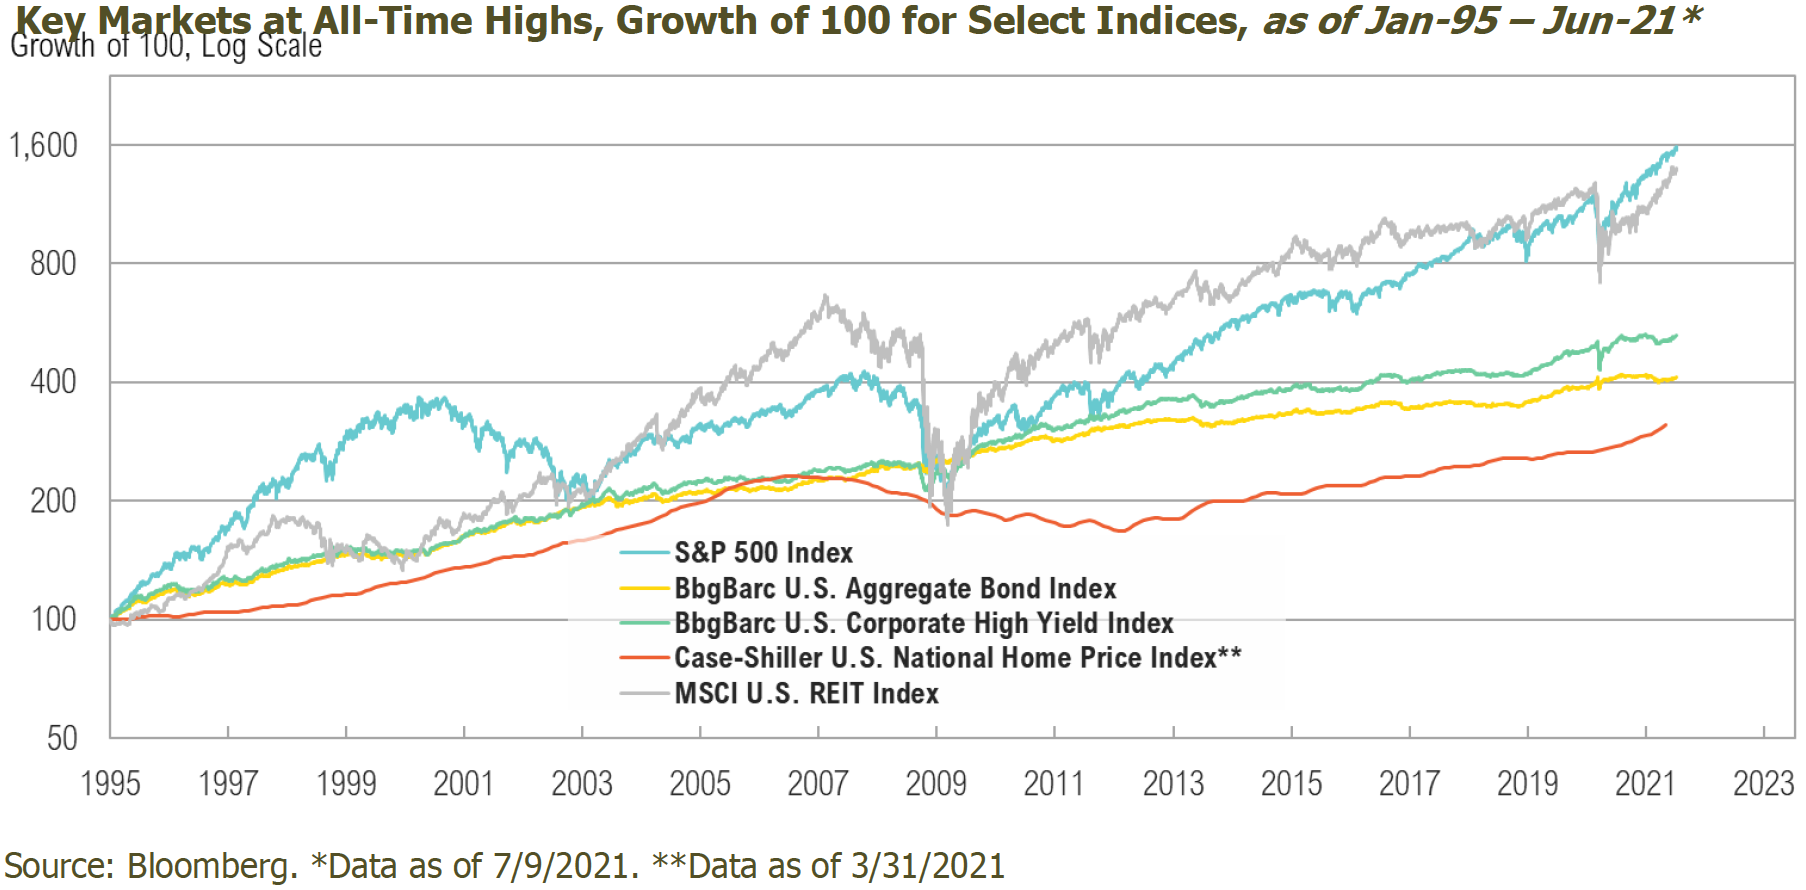
As we review the recovery, stock, bond, and real estate benchmarks are mostly at—or very close to—all-time highs, implying widespread investor optimism. This optimism has also extended to corporate earnings. Estimates for S&P 500 operating earnings in 2021 are currently $188 per share—a 53% increase from 2020 and a new all-time high in earnings, eclipsing the $157 per share mark set in 2019.1 This would put the valuation of the S&P 500, based on a one-year forward price-to-earnings ratio, at 21 times, not far from the Tech Bubble extreme of 25 times.2 Other markets are experiencing the same policy-driven boom. Residential real estate prices, for example, have exploded. The S&P CoreLogic Case-Shiller National Home Price Index has eclipsed its previous high, set in 2006, by 35%.2
Image
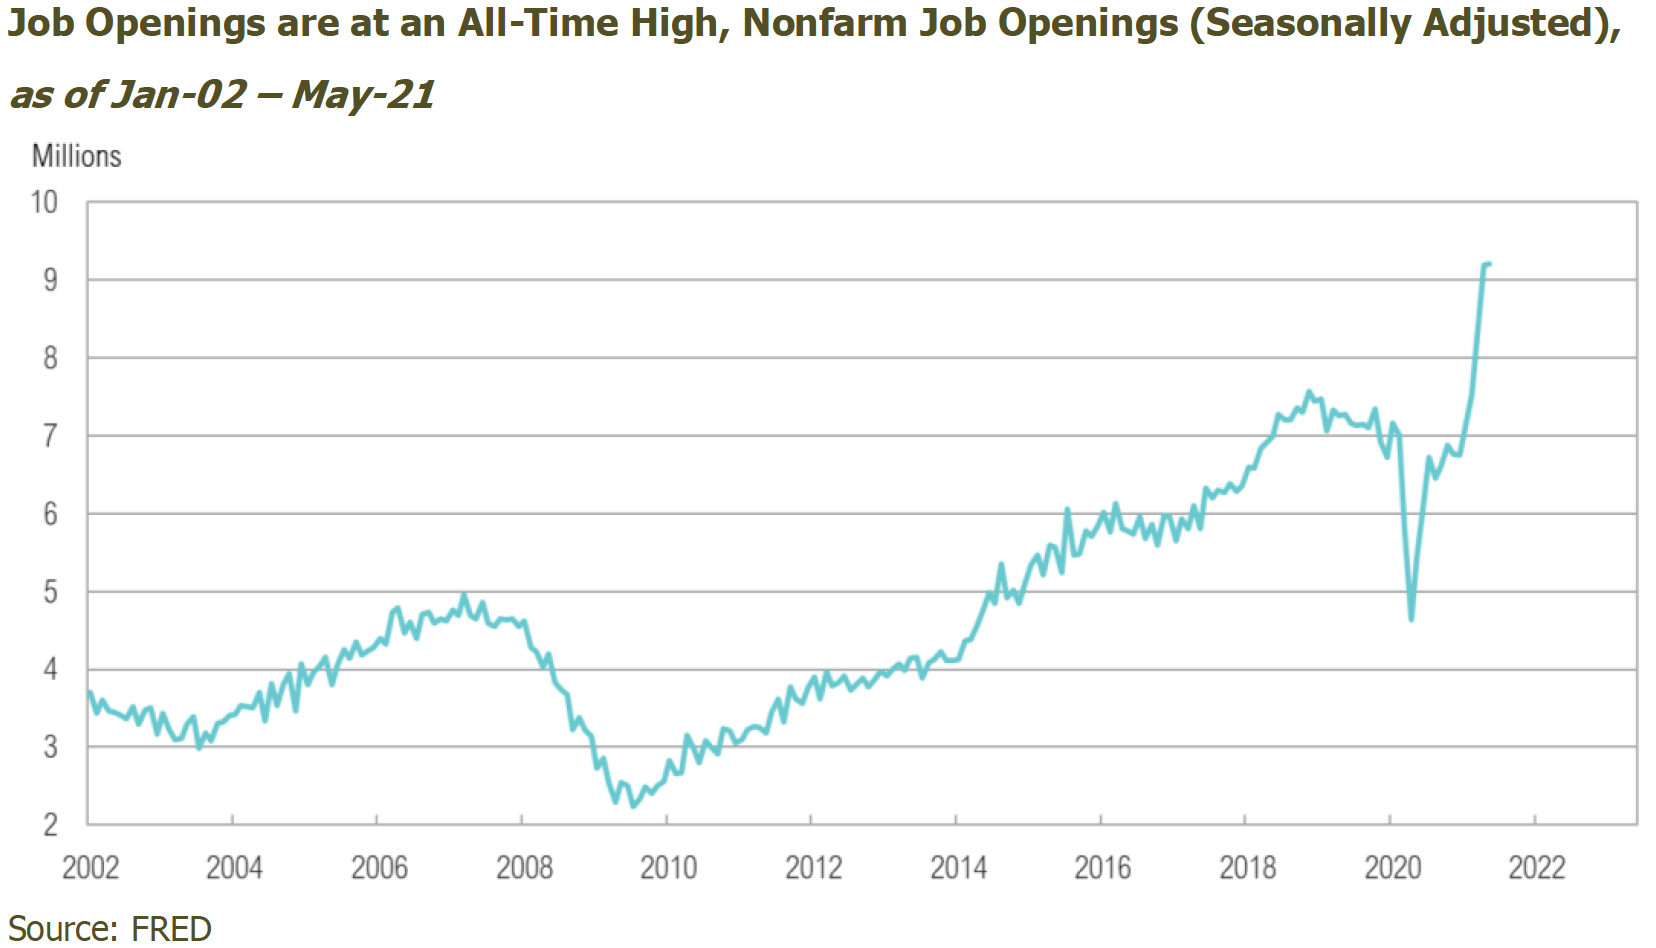
These strong asset prices are occurring even while another, very visible measure of economic health, total payroll employment, remains sluggish. According to the Bureau of Labor Statistics, the U.S. had approximately 153 million people on nonfarm payrolls just before the pandemic.3 Even with the substantial recovery of 16 million jobs, 7 million fewer people are employed today. From here, it will take nearly two years to achieve the Federal Reserve’s goal of full employment, assuming a pace of 350,000 additions per month. On the bright side, the jobs do appear there for the taking. The recent Job Openings and Labor Turnover Survey report shows current job openings moving parabolically higher to record levels.4 Even with the high number of available positions, filling these jobs will likely take time. As the reopening continues, workers relocate and are retrained, and pandemic assistance programs are discontinued.
Image
The labor market reflects the current economic situation, so it tends to trail asset prices, which are often leading indicators of economic weakness or strength. While we expect the labor market to lag behind asset prices in a recovery, it appears more disconnected than usual in this cycle. Much of this can be traced to the devastation left in the wake of the COVID-19 crisis and lockdowns. However, policymakers’ swift and aggressive reaction to the crisis, especially the Federal Reserve’s response, has significantly buoyed asset prices, via low interest rates and widescale asset purchases (quantitative easing). In just over a year since COVID-19 hit the U.S., the Fed has slashed interest rates to zero and doubled its balance sheet to over $8 trillion.5 From a fiscal perspective, the amount of total public debt has increased by over 20% to 127% of GDP.6
Not only does the U.S. stock market appear to favor these policies, the U.S. Treasury bond and foreign exchange markets—which dwarf the stock market in size and in economic importance—also appear to be ratifying policy decisions made so far. Indeed, support for these policies apparently extends even to assets that are widely seen as hedges against policy mistakes and the U.S. dollar, like gold and bitcoin, which declined on comments suggesting nothing more than a potential slowing of support more than a year from now. Taking stock of whether the levels of policy support can persist is critical in not only achieving the employment goals of policymakers, but also for asset prices and whether these lofty levels can be maintained.
Fiscal and Monetary Policy
So far this year, the Biden Administration has announced intentions to pass two fiscal bills. The American Jobs Plan is an infrastructure spending bill that seeks to invest $2 trillion over the next decade, with about 1% of GDP per year invested in infrastructure.7 President Biden also proposed the American Families Plan, which includes a $1.8 trillion stimulus program.8 These proposals come after the passage of the $1.9 trillion American Rescue Plan Act of 2021 earlier this year.9
As fall approaches, politicians will begin to weigh how these spending plans will affect their mid-term re-election chances in 2022. There does not appear to be any impediments to more spending if Congress myopically heeds the advice of political consultant James Carville and voters. Carville may be best known for being the lead strategist of Bill Clinton’s successful 1992 presidential campaign. He was keenly aware that political wins were based on concepts such as “Talk about things that’ll matter to the people, you know? It’s the economy, stupid.”10 his advice seems just as relevant 30 years later, as recent polls suggest that almost twice as many Americans support further spending plans, especially on infrastructure, than those who oppose them (see chart below). Further, the number of Americans who favor additional stimulus appears to have increased over the past year. In a recent poll by Morning Consult and Politico, 91% of respondents favored additional stimulus to help the economy “recover from the coronavirus pandemic.” This is an increase from 74% in October 2020.11
Image
With the green light to spend, the Fed plays an important role in this political situation, because it will need to monetize a significant portion of government spending—something it has so far appeared willing to do to sustain the pandemic recovery. At its most recent meeting in June, the Federal Open Market Committee (FOMC) also endorsed further large spending bills by maintaining both the pace of its quantitative easing program, which purchases $120 billion per month of Treasuries and agency mortgage-backed securities, as well as its the zero-interest rate policy, until at least 2023.12 Yet recent inflation readings are rising.13 According to the U.S. Bureau of Labor Statistics, the Consumer Price Index rose 4.9% for the year ending May 202114—its largest year-over-year increase since September 2008.13 The Fed believes these elevated readings will soon subside, as they are partly the result of the anniversary effects of the significantly depressed prices from last year. But this explanation does not account for the increased prices in either commodities or housing, which are critical to economic recovery and are also front of mind for consumers, businesses, and investors.
The final piece of the accommodation puzzle, the bond market, is the most important. Another quote from James Carville comes to mind here: “I used to think if there was reincarnation, I wanted to come back as the president or the pope or a .400 baseball hitter. But now I want to come back as the bond market. You can intimidate everybody.”15 By late in the first quarter, the 10-year Treasury yield had increased substantially from 0.5% during the depths of the pandemic to 1.75%.2 On a price basis, longer term bonds declined by over 20%.2 Rising interest rates means bond prices moved lower—a signal from investors that they required a higher yield to purchase U.S. government debt. Higher yields would not only cause the government to spend more on interest payments but also cause a tightening of financial conditions that could disrupt the recovery. However, the 10-Year Treasury yield has moved substantially lower in recent weeks to below 1.4%.2 This comes in the face of increased fiscal spending proposals and higher inflation readings, so for now, the bond market appears willing to tolerate continued fiscal spending, debt monetization, and elevated inflation.
Mid-Year Recap of Market Movements
Declining interest rates likely influenced the relative outperformance of large cap growth stocks over large cap value stocks. That’s because when the discount rate used in calculations falls, the present value of longer duration growth assets increases. The Russell 1000 Growth Index, a proxy for large growth companies, gained 12% during the quarter, leaving it up 13% for the year. The Russell 1000 Value Index gained 5% in the quarter and is up 17% so far in 2021. Over the past twelve months, the indices have produced nearly identical returns with value, up 44%, outperforming growth by 1%. Within smaller companies, value slightly outperformed growth during the quarter. The Russell 2000 Value Index gained almost 5% in the quarter and is now up 27% for the year. The Russell 2000 Growth Index was higher by 4% for the quarter, leaving it up 9% for the year. Over the past twelve months, the growth index’s 51% return trails value by 22%. The interest-rate sensitive utilities sector was the only sector to produce negative returns during the quarter, down less than 1%, and has trailed for the year, returning just 2%. Top-performing sectors for the year include energy, up 46%; financials, up 26%; and real estate, up 23%. Energy and real estate companies alike have benefited from the continued economic re-opening, while financials have benefited from the re-opening and steeper yield curve.
Stocks outside of the U.S. trailed their U.S. counterparts during the quarter and so far in 2021. The MSCI EAFE Index was higher by 5% in the quarter and is up 9% for the year, in U.S. dollar terms. In local currency terms, developed market equities were up 5% in the quarter and up 13% for the year. Emerging markets (in U.S. dollar terms) also climbed 5% for the quarter and are now up nearly 8% for the year. Local currency returns have nearly matched on a quarter and year-to-date basis.
Municipal bonds, as measured by the Bloomberg Barclays Municipal 1-10 Year Bond Index, fared much better than investment-grade taxable bonds during the quarter, as they gained 0.6%, leaving them up 0.4% for the year. The Bloomberg Barclays High Yield Index was able to absorb the rise in interest rates and post a gain of 2.7% and is now up 3.6% for the year.
Looking Forward
The stock market appears to be comfortable with rising prices for now, especially considering that the rate of year-over-year change is expected to drop in coming months from its historically high reading in May. The bond market also appears content with the inflation picture, at least for now. That said, we are keenly interested in how the U.S. government bond market behaves in the second half of the year, as the U.S. Treasury is expected to issue substantially more bonds in the third quarter—$821 billion, compared to $281 billion in net issuance during the second quarter. In addition, through its quantitative easing program, the Fed purchased $240 billion in U.S. Treasury bonds in the second quarter and is expected to purchase the same amount in the third quarter, implying a significantly reduced level of Fed absorption. As it stands currently, the bond market is playing the role of enabler and, should that change, we may need to take stock of current positioning.
As the economic recovery continues gaining momentum and inflation becomes more widely anticipated, the stock and bond markets will increasingly reflect that expectation. With stocks trading at high valuations and interest rates still at very low levels, investors are in a challenging position when determining how to allocate their investment assets. At RMB, we recommend maintaining diversified portfolios of investments that have the potential to perform well in a broad range of market outcomes. Given this, RMB believes now is a good time for investors to evaluate risk exposures in portfolios. One way for investors to respond in the current environment is to maintain long-term asset allocation targets to stocks and bonds but reduce risk within these allocations. Last month, we reduced our allocation to opportunistic fixed income securities within the fixed income allocation. Now, we are recommending investors reduce risk within equity allocations by taking profits in some of the top performing assets over the last year, such as U.S. small cap stocks, and reallocating to less-volatile sectors of the equity market, like U.S. large cap. This is one example of how we strive to balance opportunities in the current environment while remaining cognizant of the increasing risks. We will continue to focus on opportunities to balance our client portfolios for the current environment while also taking advantage of niche markets that present attractive risk/reward opportunities.
Citations
1 S&P Global: https://www.spglobal.com/spdji/en/indices/equity/sp-500/#overview
2 Bloomberg
3 BLS: https://www.bls.gov/news.release/archives/empsit_03062020.pdf
4 BLS: https://www.bls.gov/news.release/pdf/jolts.pdf
5 FRED: https://fred.stlouisfed.org/series/WALCL
6 FRED: https://fred.stlouisfed.org/series/GFDEGDQ188S
7 White House: https://www.whitehouse.gov/briefing-room/statements-releases/2021/03/31/fact-sheet-the-american-jobs-plan/
8 White House: https://www.whitehouse.gov/briefing-room/statements-releases/2021/04/28/fact-sheet-the-american-families-plan/
9 Congress: https://www.congress.gov/bill/117th-congress/house-bill/1319/text
10 Harvard Politics: https://harvardpolitics.com/its-the-economy-stupid/
11 Morning Consult + Politico: https://assets.morningconsult.com/wpuploads/2021/05/19073309/210579_crosstabs_POLITICO_RVs_v1_SH.pdf
12 U.S. Federal Reserve: https://www.federalreserve.gov/monetarypolicy/files/monetary20210616a1.pdf
13 FRED: https://fred.stlouisfed.org/series/CPIAUCSL
14 BLS: https://www.bls.gov/news.release/pdf/cpi.pdf
15 Bloomberg: https://www.bloomberg.com/news/articles/2018-01-29/the-daily-prophet-carville-was-right-about-the-bond-market-jd0q9r1w
Disclaimers
All market pricing and performance data from Bloomberg, unless otherwise cited. Asset class and sector performance are gross of fees unless otherwise indicated.
The opinions and analyses expressed in this newsletter are based on RMB Capital Management, LLC’s (“RMB Capital”) research and professional experience, and are expressed as of the date of our mailing of this newsletter. Certain information expressed represents an assessment at a specific point in time and is not intended to be a forecast or guarantee of future results, nor is it intended to speak to any future time periods. RMB Capital makes no warranty or representation, express or implied, nor does RMB Capital accept any liability, with respect to the information and data set forth herein, and RMB Capital specifically disclaims any duty to update any of the information and data contained in this newsletter. The information and data in this newsletter does not constitute legal, tax, accounting, investment or other professional advice. Returns are presented net of fees. An investment cannot be made directly in an index. The index data assumes reinvestment of all income and does not bear fees, taxes, or transaction costs. The investment strategy and types of securities held by the comparison index may be substantially different from the investment strategy and types of securities held by your account. The S&P 500 Index is widely regarded as the best single gauge of the U.S equity market. It includes 500 leading companies in leading industries of the U.S economy. The S&P 500 focuses on the large cap segment of the market and covers 75% of U.S. equities. Asset class performance was measured using the following benchmarks: U.S. Large Cap Stocks: S&P 500 TR Index; U.S. Small & Micro Cap: Russell 2000 TR Index; Intl Dev Large Cap Stocks: MSCI EAFE GR Index; Emerging & Frontier Market Stocks: MSCI Emerging Markets GR Index; U.S. Interm-Term Muni Bonds: Bloomberg Barclays 1-10 (1-12 Yr) Muni Bond TR Index; U.S. Interm-Term Bonds: Bloomberg Barclays U.S. Aggregate Bond TR Index; U.S. High Yield Bonds: Bloomberg Barclays U.S. Corporate High Yield TR Index; U.S. Bank Loans: S&P/LSTA U.S. Leveraged Loan Index; Intl Developed Bonds: Bloomberg Barclays Global Aggregate ex-U.S. Index; Emerging & Frontier Market Bonds: JPMorgan EMBI Global Diversified TR Index; U.S. REITs: MSCI U.S. REIT GR Index, Ex U.S. Real Estate Securities: S&P Global Ex-U.S. Property TR Index; Commodity Futures: Bloomberg Commodity TR Index; Midstream Energy: Alerian MLP TR Index; Gold: LBMA Gold Price, U.S. 60/40: 60% S&P 500 TR Index; 40% Bloomberg Barclays U.S. Aggregate Bond TR Index; Global 60/40: 60% MSCI ACWI GR Index; 40% Bloomberg Barclays Global Aggregate Bond TR Index. The S&P/ CoreLogic Case-Shiller Home Price Indexes -also known simply as the Case-Shiller Home Price Indexes - refers to a group of indexes that measures or tracks the average changes in the prices of single-family-detached residences (houses) throughout the United States by observing the purchase price and resale value of those houses that have undergone at least two arm's length sale transactions.