


Overview
March 5, 2021, marked the one-year anniversary of the World Health Organization’s declaration of the COVID-19 pandemic. The world has changed dramatically over the past 12 months. Entire segments of the economy shut down, along with thousands of businesses. Many of those will not reopen. Millions of people were put out of work.
Central banks and lawmakers alike stepped in to patch up the sinking ship that was the global economy. Now, like the warming March weather, the economy is also starting to thaw, especially in areas frozen out by COVID-19. The February jobs report showed a 379,000 increase in nonfarm payroll employment, with 355,000 of those jobs in leisure and hospitality. Of those gains, roughly 80% were in food services and drinking places.1
Markets seem to anticipate that fundamentals will continue to improve. According to Factset, for calendar year 2021, analysts are projecting corporate earnings growth of 24% and revenue growth of 9.2%, relative to 2020.2
In terms of the virus itself, as of March 8, 2021, nearly 10% of the U.S. population had received both doses of the COVID-19 vaccine, and 20% had received at least one. Over 50% of those over the age of 65 have received at least one dose of a vaccine, an age cohort that shouldered over 80% of mortalities.3 As if to mark the end of the pandemic era, the popular website, “The COVID Tracking Project,” announced it will stop collecting data on March 7. The press release detailing their decision began with the pronouncement: “It’s time.”4
Rising Interest Rates
Perhaps no other measure chronicles the market’s decline and recovery during the COVID-19 era more succinctly than long-term interest rates. The 10-year Treasury declined to an all-time low of 0.4% on March 9, 2020. As of March 8, 2021, this widely quoted barometer of economic growth and inflation sat at 1.59%. While the move seems insignificant in absolute terms, the relative increase is one of the most drastic in history. Even more surprisingly, it comes on the heels of its largest ever six-month percentage decrease leading up to March 2020.
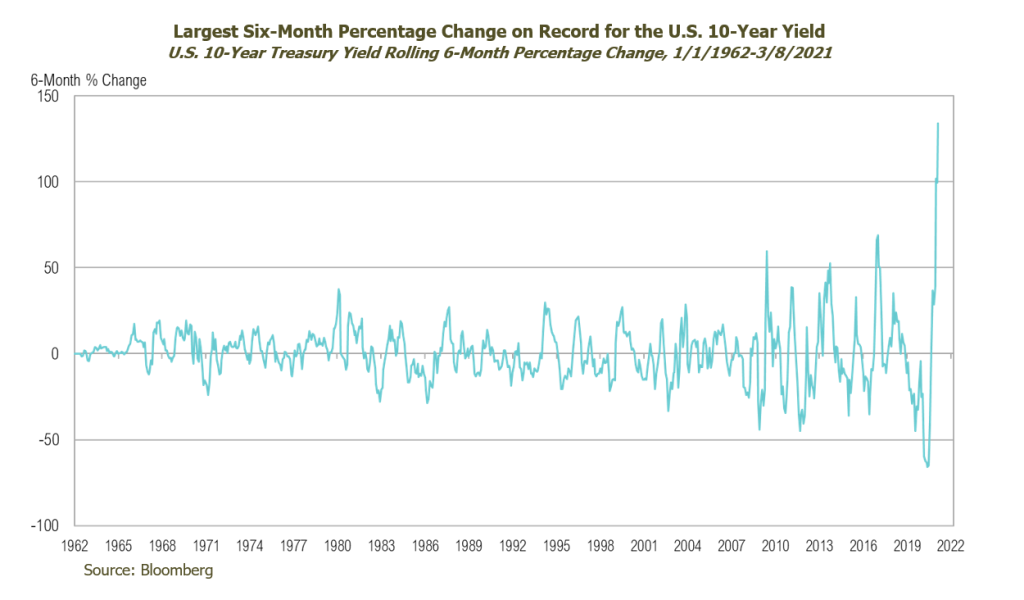
The low rates over the past year favored companies positioned for high growth, far off in the future, and minimized the focus on current cash flow. They also spurred a wave of speculation, akin to some of history’s great manias, via three avenues. First, they made low-yielding safe-haven investments less attractive and encouraged investors to move out on the risk curve. Second, by lowering the discount rate used in valuation calculations, they increased the present value of longer-duration growth assets relative to value assets. Third, they made leverage more affordable for individuals and corporations.
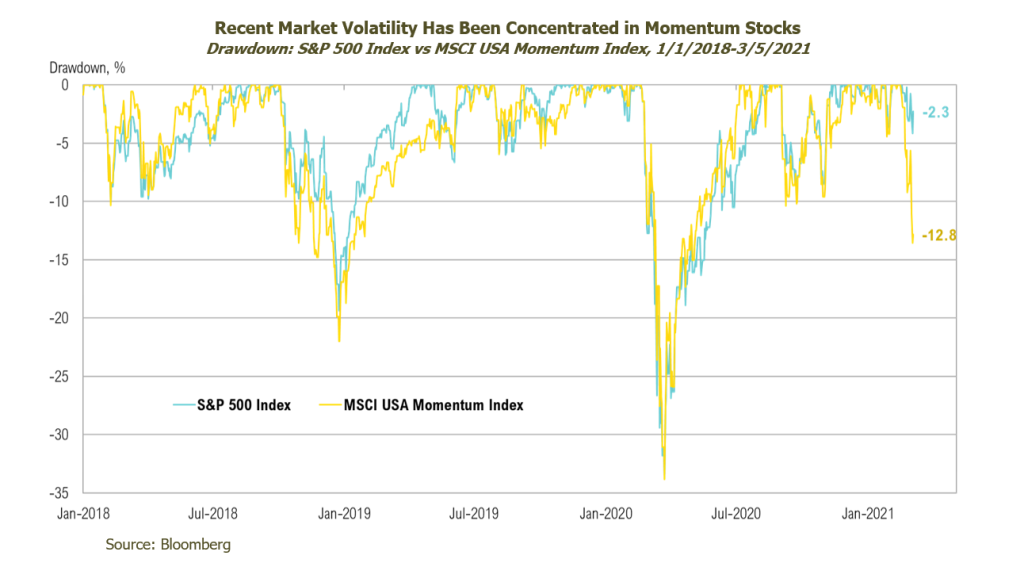
The recent spike in interest rates has taken the wind out of growth investors’ sails. This is best captured by the -12.8% decline of the MSCI USA Momentum Index, relative to the -2.3% performance of the S&P 500 Index over the week ending March 5. The Federal Reserve, however, is likely not too bothered by the recent rise in interest rates because stocks are within 5% of their all-time highs and the federal government is on the verge of passing a $1.9 trillion spending bill. However, we believe the Fed will need to take further accommodative action if interest rates rise much further—and will be especially likely to do so if broader equity markets collapse, as well.
Energy Markets
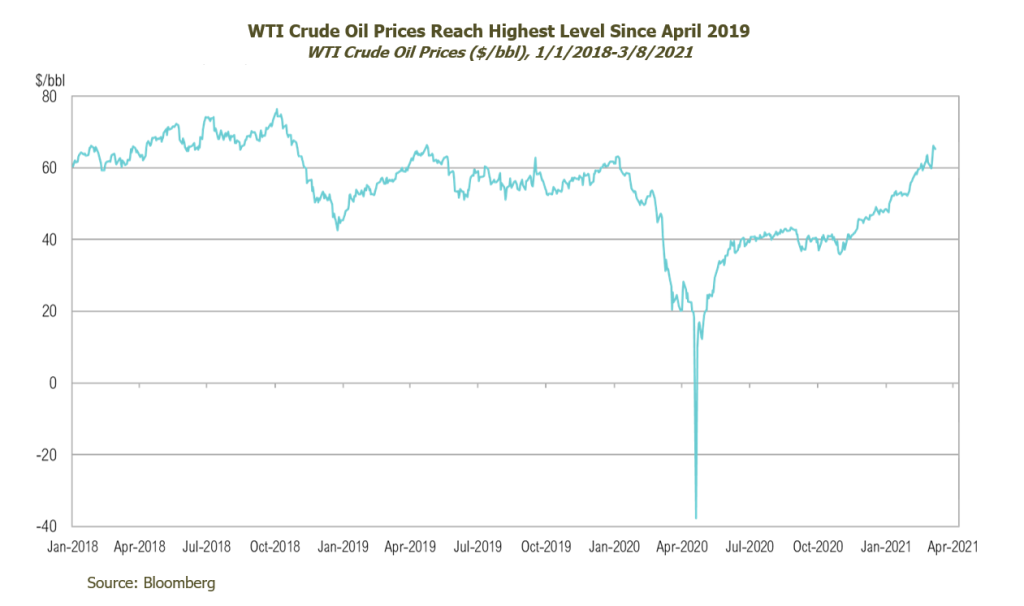
Crude oil closed above $66 a barrel on Friday for the first time since April 2019. The rally continued last week after OPEC+ talks unexpectedly announced that there would be no increase in oil production through April 2021.5 In addition, outlooks were also bolstered by President Biden’s announcement that the U.S. expects to have enough doses to vaccinate the entire adult population by the end of May.6 At the same time, U.S. oil production has come offline given the treacherous February weather. The U.S. Energy Information Administration said production was less than 10 million barrels per day in the last two weeks of February, a rate last seen in early 2018.7 These developments all point to a sustained rebound in oil prices.
Looking Forward
We continue to position our portfolios for higher inflation, but we believe it will emerge in fits and starts over the next few years. Also, as inflation becomes more widely anticipated, prices will increasingly reflect that expectation, and as a result, the potential gains of investing according to this belief will decrease while the associated risks will increase. It’s worth noting that inflation becomes likely only if both monetary and fiscal stimuli continue consistently, which takes time. To that end, we recommend maintaining diversified portfolios of investments that anticipate a broad range of outcomes. We will strive to balance opportunities in the current environment while remaining cognizant of the increasing risks. The rally in risk assets is likely to persist amid promises of fiscal stimulus from the White House and the continued distribution of vaccines. Given this, RMB believes this is a good time for investors to evaluate exposures in portfolios as the possibility for a pullback increases for those investments. We will continue to look for additional opportunities to selectively increase risk, if/when further stock market pullbacks develop. In the meantime, we continue to focus on dislocations in various niche markets that present attractive risk/reward opportunities.
1BLS: https://www.bls.gov/news.release/empsit.htm
2Factset: https://www.factset.com/hubfs/Website/Resources%20Section/Research%20Desk/Earnings%20Insight/EarningsInsight_030521.pdf
3USAfacts.org: https://usafacts.org/visualizations/covid-vaccine-tracker-states/
4COVID Tracking Project: https://covidtracking.com/analysis-updates/covid-tracking-project-end-march-7
5WSJ: https://www.wsj.com/articles/saudis-russia-discuss-joint-oil-output-raise-ahead-of-opec-meeting-11614857084?mod=searchresults_pos5&page=1
6AP: https://apnews.com/article/merck-help-make-johnson-johnson-vaccine-9ca6f1f4c502b095531926a53abe7262
7EIA: https://www.eia.gov/dnav/pet/hist/LeafHandler.ashx?n=PET&s=WCRFPUS2&f=W
All market pricing and performance data from Bloomberg, unless otherwise cited. Asset class and sector performance are gross of fees unless otherwise indicated.
The opinions and analyses expressed in this newsletter are based on RMB Capital Management, LLC’s (“RMB Capital”) research and professional experience, and are expressed as of the date of our mailing of this newsletter. Certain information expressed represents an assessment at a specific point in time and is not intended to be a forecast or guarantee of future results, nor is it intended to speak to any future time periods. RMB Capital makes no warranty or representation, express or implied, nor does RMB Capital accept any liability, with respect to the information and data set forth herein, and RMB Capital specifically disclaims any duty to update any of the information and data contained in this newsletter. The information and data in this newsletter does not constitute legal, tax, accounting, investment or other professional advice. Returns are presented net of fees. An investment cannot be made directly in an index. The index data assumes reinvestment of all income and does not bear fees, taxes, or transaction costs. The investment strategy and types of securities held by the comparison index may be substantially different from the investment strategy and types of securities held by your account. The S&P 500 Index is widely regarded as the best single gauge of the U.S equity market. It includes 500 leading companies in leading industries of the U.S economy. The S&P 500 focuses on the large cap segment of the market and covers 75% of U.S. equities. Bloomberg Barclays U.S. Corporate High Yield Index is an unmanaged index that is composed of issues that meet the following criteria: at least $150 million par value outstanding, maximum credit rating of Ba1 (including defaulted issues), and at least one year to maturity. The MSCI USA Momentum Index is based on MSCI USA Index, its parent index, which captures large- and mid-cap stocks of the US market. It is designed to reflect the performance of an equity momentum strategy by emphasizing stocks with high price momentum, while maintaining reasonably high trading liquidity, investment capacity and moderate index turnover.