

Overview
Global equities and other risky assets rallied significantly during the quarter, driven largely by positive vaccine developments and abundant liquidity. Stock markets were already headed higher after the presidential election, and news of effective vaccines rejuvenated even previously lagging areas of the market as the Pfizer-BioNTech vaccine announcement on November 9 kicked off a recovery in value stocks.1 On that day, the Russell 2000 Value Index outperformed the Russell 1000 Growth Index by 9%, the largest single-day relative gain since 1992. For the quarter, the MSCI All Country World Index increased by 14%, pushing it to all-time highs and leaving it up 16% in the tumultuous year that was 2020. The rally also extended to below-investment-grade bonds, with the Bloomberg Barclays High-Yield Index higher by more than 6% in the quarter, leaving it up 7% for the year. A broad measure of taxable fixed income securities, the Bloomberg Barclays U.S. Aggregate Bond Index, was up 0.7% in the quarter, capping off a remarkable year of a more than 7% increase. The Bloomberg Barclays Municipal 1-10 Year Bond Index was up 1% in the quarter and up 4% for the year.
Recent Events
On December 27, President Trump signed a $900 billion COVID-19 relief package that included payments of up to $600 for each qualifying American adult and child.2 But, as President-elect Joe Biden put it, this package was just a “down payment” on what will come in 2021.3 If future payments become more frequent and more timely, as Biden suggests they will, then the federal government will likely need a more efficient medium to disburse them. The Federal Reserve appears poised to help as they published two papers during the fourth quarter of 2020 in which they discussed how Central Bank Digital Currency (“CBDC”) could help fiscal policymakers in this area.4,5 In one paper, the Fed concludes, “If the central bank can increase the quantity of CBDC to satisfy this demand, the reduction in real economic activity is less severe, attenuating the decline in spending and therefore welfare.”4 We expect that the Fed and Treasury will work seamlessly on this and other endeavors, especially since Janet Yellen, former Federal Reserve Chair, has been nominated to take over as U.S. Treasury Secretary under the Biden administration. In December, Yellen launched a Twitter account and posted comments that suggest continued aggressive government support, “The Treasury Department must be an institution that wakes up every morning thinking about the American people. Your jobs, your paychecks. Your struggles, your hopes. Your dignity. And your limitless potential. We will work to restore that public trust and promise.”6
On January 5, the Georgia Senate runoffs resulted in both Democratic Party nominees defeating the Republican incumbents. Ostensibly, Democrats will control the Senate, which should create a coordinated dynamic between the inbound government, the U.S. Department of the Treasury, and the Federal Reserve.
The relationship between massive spending and the need for further tax hikes and/or debt monetization will be crucial. Given the lack of progress on a fiscal spending package in the second-half of 2020 and the nearly $1.7 trillion in cash held at the Treasury, fourth-quarter debt issuance was cut by $600 billion and pushed into the first quarter of 2021.7,8 As a result, in early November, the U.S. Treasury announced that it expects its first-quarter 2021 issuance to be an astronomical $1.1 trillion.8 Through its quantitative easing program, in which it buys Treasuries and mortgage-backed securities, the Fed bought $240 billion of Treasuries or 39% of total issuance in the fourth quarter. At its current pace, the Fed would only be buying 22% of first-quarter issuance, which suggests the program may need to be increased, especially with longer-term interest rates currently on the rise.9
Redefining Normal
As of January 8, less than seven million people in the U.S. have received a COVID-19 vaccine.10 Markets are understandably excited to see light at the end of the COVID-19 tunnel. But a crucial question looms: when, if ever, will life return to what it was before the pandemic? As the idea of mass vaccinations (or herd immunity) becomes reality, investors’ focus must shift to what the world we return to will look like.
Consider equity markets, where the pandemic negatively impacted corporate earnings, but monetary stimulus more than offset any potential negative impact to drive an atypical jump in prices. That disconnect between prices and earnings has driven valuations substantially higher. The operating earnings of companies in the S&P 500 Index are currently expected to close 2020 at $120 per share. This would represent a 23% decline from 2019 levels. Expectations for 2021 operating earnings are currently $164 per share, which would represent a 37% increase from 2020. It would also be a new high in earnings, eclipsing the $157 per-share mark set in 2019.11 The S&P 500 currently trades at a one-year forward price-to-earnings ratio of 23 times, not far from the Tech Bubble high of 26 times.12 If monetary policy were not so supportive, prices might decline now, as life returns to normal, so that they align better with earnings. But monetary support is highly likely in 2021, and historically, supportive monetary policy has pushed economic and market fundamentals to the back seat.
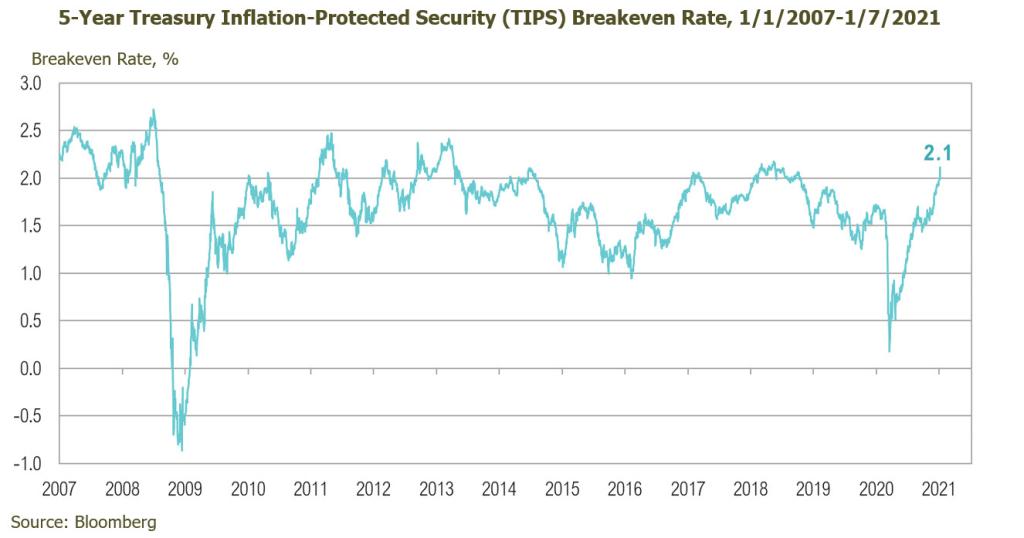
If fundamentals were less relevant, inflation may be the clue to determining if and when the monetary support starts to decline. At its August virtual “Jackson Hole” Economic Policy Symposium, the Federal Reserve formalized a policy position that is more tolerant of overheating markets and inflation levels above 2%.13 Prior to the speech, the 10-year Treasury yield was at 69 basis points and had risen to 112 basis points on January 8.14 The Fed’s tolerance for higher prices is rooted in its view that further accommodation will support the economy and that economic growth will help heal a labor market left in tatters. While the headline unemployment rate of 6.7% may not seem dire, the fact that 19 million Americans (approximately 12% of the workforce) remain on some type of government assistance is of significant concern to the Fed.12,15,16 The Fed’s aggressive and rapid response to the COVID-19 crisis in March helped maintain market-based inflation expectations at levels well above those experienced during the financial crisis, even though COVID-19 could be considered a much more serious deflationary event. Even as inflation expectations have bounced back, the Fed has shown no signs of removing the metaphorical punch bowl. Currently, five-year TIPS-implied inflation expectations are back up to 2.1%, roughly where they were in 2018, when the Fed was raising interest rates and shrinking its balance sheet.17 Today, however, the Fed seems set on maintaining both $120 billion per month of asset purchases and zero interest rates, policies which have been in place for several months. At its December Federal Open Market Committee (FOMC) meeting, the Fed’s press release reiterated its commitment to both.18
The Fed’s willingness to tolerate higher inflation—thereby lowering the real (inflation-adjusted) return for investment assets—will be most obvious in the fixed income markets. The rising yields on Treasury bonds (yields and prices move inversely) may reflect investors’ attempt to adjust to this new reality as they move away from low-yielding debt in search of higher interest rates or for other speculative investments that will compensate them for the risk of higher inflation. If that occurs, the Fed will need to assuage those higher yields (and lower prices) with increased asset purchases. This situation will be exacerbated by expectations of high Treasury issuance to fund another year of sizable U.S. deficits.19
Another market at the epicenter of transformation is real estate. This segment of the economy will provide meaningful guideposts on how “normal” is redefined in a post-COVID world. To put its size into perspective, the $20 trillion commercial real estate market is roughly half of the value of the U.S. stock market.20 Even prior to COVID-19, real estate was changing rapidly. Retail in particular was already shifting due to the well-understood Amazon-effect.
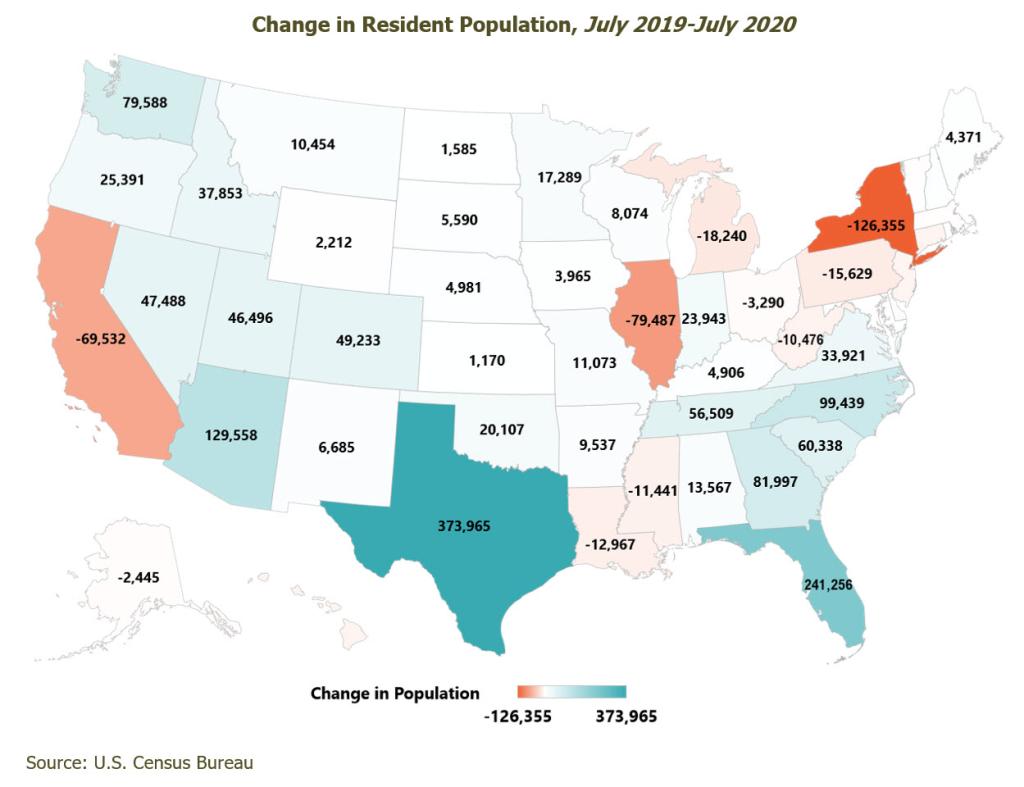
But the pandemic and its aftermath will likely affect the office sector most significantly for a few reasons. First, corporations have started to move headquarters from high-tax to lower-tax locales. California-based companies, including Oracle, Tesla, and Hewlett Packard, have all recently announced moves to Texas.21,22 Americans also appear to be making a personal decision to move states. According to the U.S. Census Bureau, states with the biggest decline in their resident population have been New York, Illinois, and California, with Texas, Florida, and Arizona having the biggest increase in residents.23 This theme is also evident in the dramatic increases in family migration as vast numbers of Americans leave urban areas in favor of the suburbs. Miller Samuel estimates that in Manhattan the average number of months of supply of apartments has more than doubled to 19 versus a 10-year average of seven.24 They also estimate that the median level of rent has plummeted to its lowest levels in 10 years.25
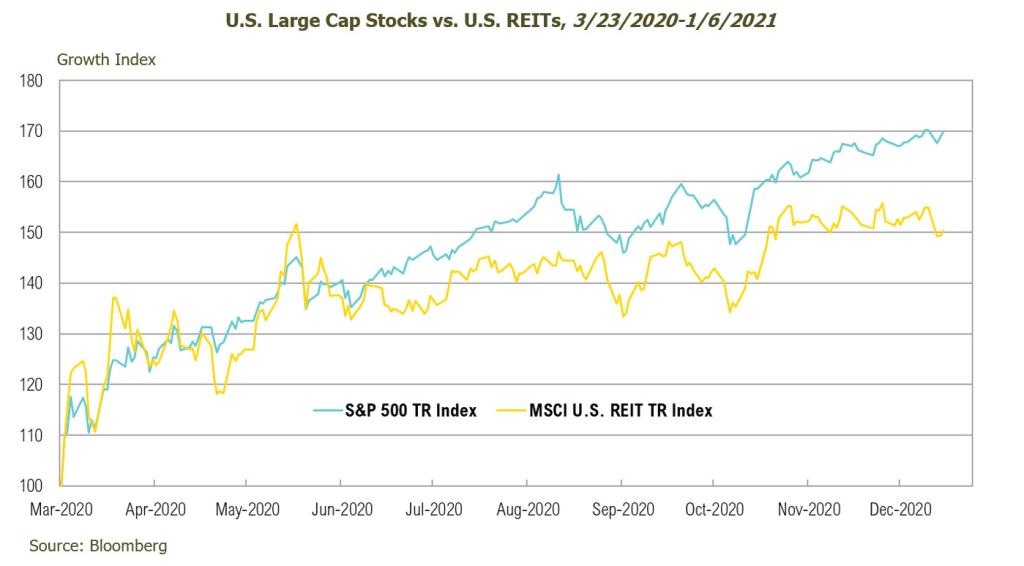
As if movement were not enough to redefine normal, corporate management teams are actively pursuing strategies that reduce or alter their commercial real estate footprint in order to cut costs. In a September CBRE study, 60% of respondents indicated they were aggressively pursuing contraction, consolidation, or exit plans. This was up 21% from a similar study conducted just three months earlier.26 Together, these changes put billions of dollars of carefully placed properties, designed to accommodate people’s normal weekday commute, in peril. A flexible workplace and changes in consumption trends will also serve to change real estate as vehicle miles traveled could decline by 9%, according to KPMG estimates. This is the equivalent to 270 billion fewer miles driven per year—or 100 million trips from New York to California.27 Given these dynamic conditions, it’s no surprise that significant uncertainty remains, which has caused U.S. REITs to lag behind the broader equity market since the March bottom, posting a loss of nearly 8% for the year.
Looking Forward
The results of the two Georgia Senate run-offs held on January 5 were notable developments in the new year. With Democrats winning both seats, the balance of power now shifts decidedly to Democrats. In the 24 presidential elections since 1928, markets have averaged a return of 7.7% from November 1 of the election year to the end of the first year of the next presidential term. The average over that period for divided governments was 10.6%, more than 5% higher than the average for single-party sweeps, which generate an average of 5.5%. But investors may want to discount any historical analogs for the current environment. The virus and potential reopening, massive government spending, and inevitable debt-monetization all make the current environment truly unprecedented. As the hurdle for policymakers to withdraw support remains abnormally high, so too does the risk that an already expensive market will continue to move higher, potentially faster than what would be justified by the fundamentals. At the same time, we may be approaching an environment in which investors fear rising inflation— a novel situation to an entire generation of investors, business operators, and even policymakers. We will continue look for additional opportunities to selectively increase risk, if and when further stock market pullbacks develop. In the meantime, we continue to focus on dislocations in various niche markets that present attractive risk/reward opportunities.
1Pfizer: https://www.pfizer.com/news/press-release/press-release-detail/pfizer-and-biontech-announce-vaccine-candidate-against
2CBS: https://www.cbsnews.com/news/trump-signs-covid-19-relief-spending-bill/
3The Hill: https://thehill.com/homenews/administration/530480-biden-says-stimulus-deal-under-negotiation-would-be-a-down-payment
4Federal Reserve: https://www.federalreserve.gov/econres/notes/feds-notes/central-bank-digital-currency-a-literature-review-20201109.htm
5Federal Reserve: https://www.federalreserve.gov/econres/notes/feds-notes/tokens-and-accounts-in-the-context-of-digital-currencies-122320.htm
6Twitter: https://twitter.com/JanetYellen/status/1333913622339207168
7Treasury: https://fsapps.fiscal.treasury.gov/dts/files/20123100.pdf
8Treasury: https://home.treasury.gov/news/press-releases/sm1172
9Federal Reserve: https://www.federalreserve.gov/newsevents/pressreleases/monetary20201216a1.htm, SpringTide Calculations
10CDC: https://covid.cdc.gov/covid-data-tracker/#vaccinations
11S&P Global: https://www.spglobal.com/spdji/en/indices/equity/sp-500/#overview
12Bloomberg
13Federal Reserve: https://www.federalreserve.gov/newsevents/speech/powell20200827a.htm
14FRED: https://fred.stlouisfed.org/series/DGS10
15FRED: https://fred.stlouisfed.org/series/UNRATE
16Department of Labor: https://www.dol.gov/ui/data.pdf
17FRED: https://fred.stlouisfed.org/series/T5YIFR
18Federal Reserve: https://www.federalreserve.gov/monetarypolicy/files/monetary20201216a1.pdf
192021 U.S. Budget Deficit Estimate
20Federal Reserve: https://www.federalreserve.gov/publications/files/financial-stability-report-20201109.pdf
21CNBC: https://www.cnbc.com/2020/12/11/oracle-is-moving-its-headquarters-from-silicon-valley-to-austin-texas.html
22Investopedia: https://www.investopedia.com/why-silicon-valley-companies-are-moving-to-texas-5092782#:~:text=High%20housing%20costs,%20high%20tax%20rates,%20and%20strict,lower%20costs%20of%20living%20and%20more-favorable%20tax%20laws.
23U.S. Census Bureau: https://www.census.gov/programs-surveys/popest/technical-documentation/research/evaluation-estimates.html
24Twitter: https://twitter.com/LONGCONVEXITY/status/1334951631209771011/photo/1
25Twitter: https://twitter.com/LizAnnSonders/status/1338460599030833154/photo/1
26CBRE: https://www.cbre.com/-/media/files/the-way-forward/cbre_the-future-of-the-office-september-survey-highlights.pdf?la=en
27KPMG: https://advisory.kpmg.us/content/dam/advisory/en/pdfs/2020/automotives-new-reality.pdf
All market pricing and performance data from Bloomberg, unless otherwise cited. Asset class and sector performance are gross of fees unless otherwise indicated.
The opinions and analyses expressed in this newsletter are based on RMB Capital Management, LLC’s (“RMB Capital”) research and professional experience, and are expressed as of the date of our mailing of this newsletter. Certain information expressed represents an assessment at a specific point in time and is not intended to be a forecast or guarantee of future results, nor is it intended to speak to any future time periods. RMB Capital makes no warranty or representation, express or implied, nor does RMB Capital accept any liability, with respect to the information and data set forth herein, and RMB Capital specifically disclaims any duty to update any of the information and data contained in this newsletter. The information and data in this newsletter does not constitute legal, tax, accounting, investment or other professional advice. Returns are presented net of fees. An investment cannot be made directly in an index. The index data assumes reinvestment of all income and does not bear fees, taxes, or transaction costs. The investment strategy and types of securities held by the comparison index may be substantially different from the investment strategy and types of securities held by your account. The S&P 500 Index is widely regarded as the best single gauge of the U.S equity market. It includes 500 leading companies in leading industries of the U.S economy. The S&P 500 focuses on the large cap segment of the market and covers 75% of U.S. equities. The Russell 1000® Growth Index measures the performance of the large-cap growth segment of the US equity universe. It includes those Russell 1000® companies with higher price to book ratios and higher forecasted growth values. The Russell 1000® Growth Index is constructed to provide a comprehensive and unbiased barometer for the large-cap growth segment. The index is completely reconstituted annually to ensure new and growing equities are included and that the represented companies continue to reflect growth characteristics. The Russell 2000® Value Index measures the performance of small-cap value segment of the US equity universe. It includes those Russell 2000® companies with lower price-to-book ratios and lower forecasted growth values. The MSCI ACWI Index, MSCI’s flagship global equity index, is designed to represent performance of the full opportunity set of large- and mid-cap stocks across 23 developed and 26 emerging markets. It covers more than 3,000 constituents across 11 sectors and approximately 85% of the free float adjusted market capitalization in each market. Bloomberg Barclays U.S. Corporate High Yield Index is an unmanaged index that is comprised of issues that meet the following criteria: at least $150 million par value outstanding, maximum credit rating of Ba1 (including defaulted issues) and at least one year to maturity. The Barclays Capital U.S. Aggregate Index Is an unmanaged index composed of securities from the Bloomberg Barclays Government/Corporate Bond Index, Mortgage Backed Securities Index and the Asset Backed Securities Index. Total return comprises price appreciation/depreciation and income as a percentage of the original investment. Indices are rebalanced monthly by market capitalization. Bloomberg Barclays Municipal Bond Inter Short 1-10 Year Index is an unmanaged index of municipal bonds traded in the U.S. with maturities ranging from 1-10 years. The MSCI US REIT Index is a free float-adjusted market capitalization weighted index that is comprised of equity Real Estate Investment Trusts (REITs). The index is based on the MSCI USA Investable Market Index (IMI), its parent index, which captures the large, mid and small cap segments of the USA market.